
$1,150,000
Investment Summary
- Monthly Cash Flow
- -$3,368
- Cap Rate
- 2.6%
- Cash-on-Cash Return
- -15.3%
- Debt Coverage Ratio
- 0.43
- Internal Rate of Return (5 years)
- -10.8%
Cash Flow
Net Operating Income (NOI) minus mortgage payments.
Calculation:
NOI - Mortgage Payments
Cap Rate (Market Value)
Capitalization Rate is a rate of return that compares the yearly Net Operating Income (NOI) to the market value.
Calculation:
NOI / Market Value
Cash-on-Cash Return (CoC)
Annual Cash Flow / Cash Invested
Calculation:
Annual cash flow divided by initial cash invested.
Debt Coverage Ratio (DCR)
Net Operating Income (NOI) divided by total debt payments.
Calculation:
NOI / Total Debt Payments
Internal Rate of Return (IRR)
A metric for assessing profitability over time. IRR is the discount rate at which the net present value (NPV) of all future cash flows (positive and negative) from an investment equals zero — including both periodic cash flow (such as rent) and a projected sale at the end of the holding period. It represents the expected annualized return, accounting for income, expenses, and the recovery of capital through a future sale.
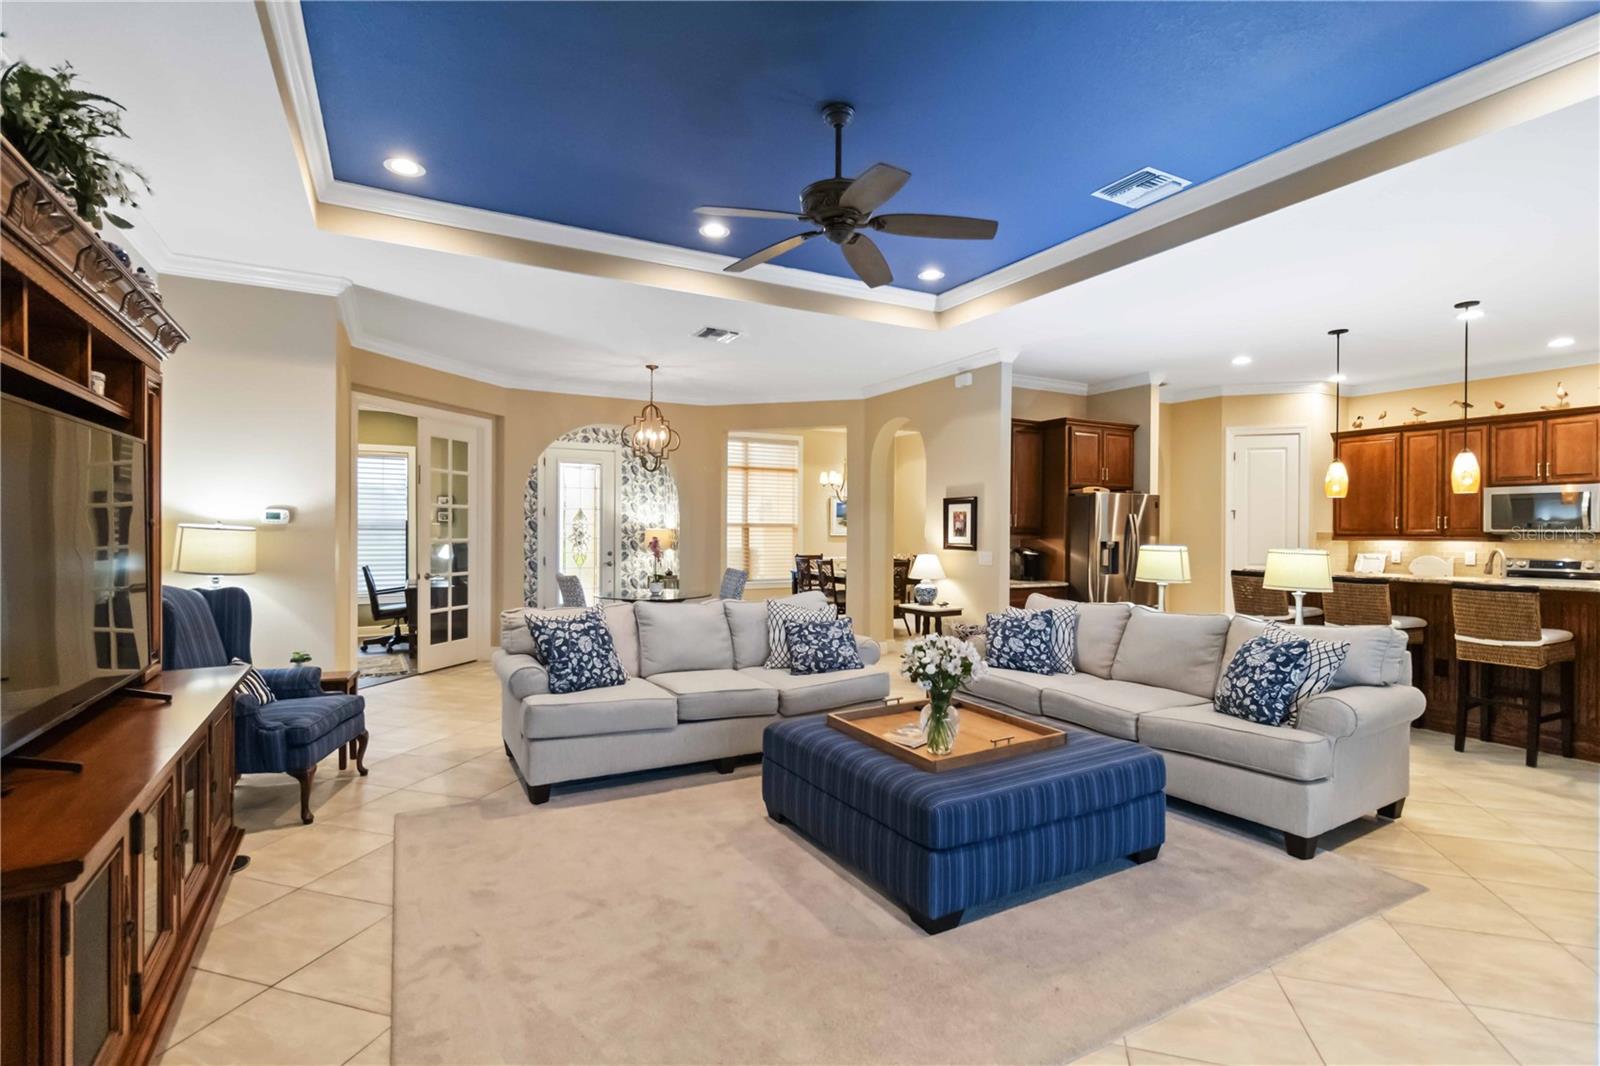
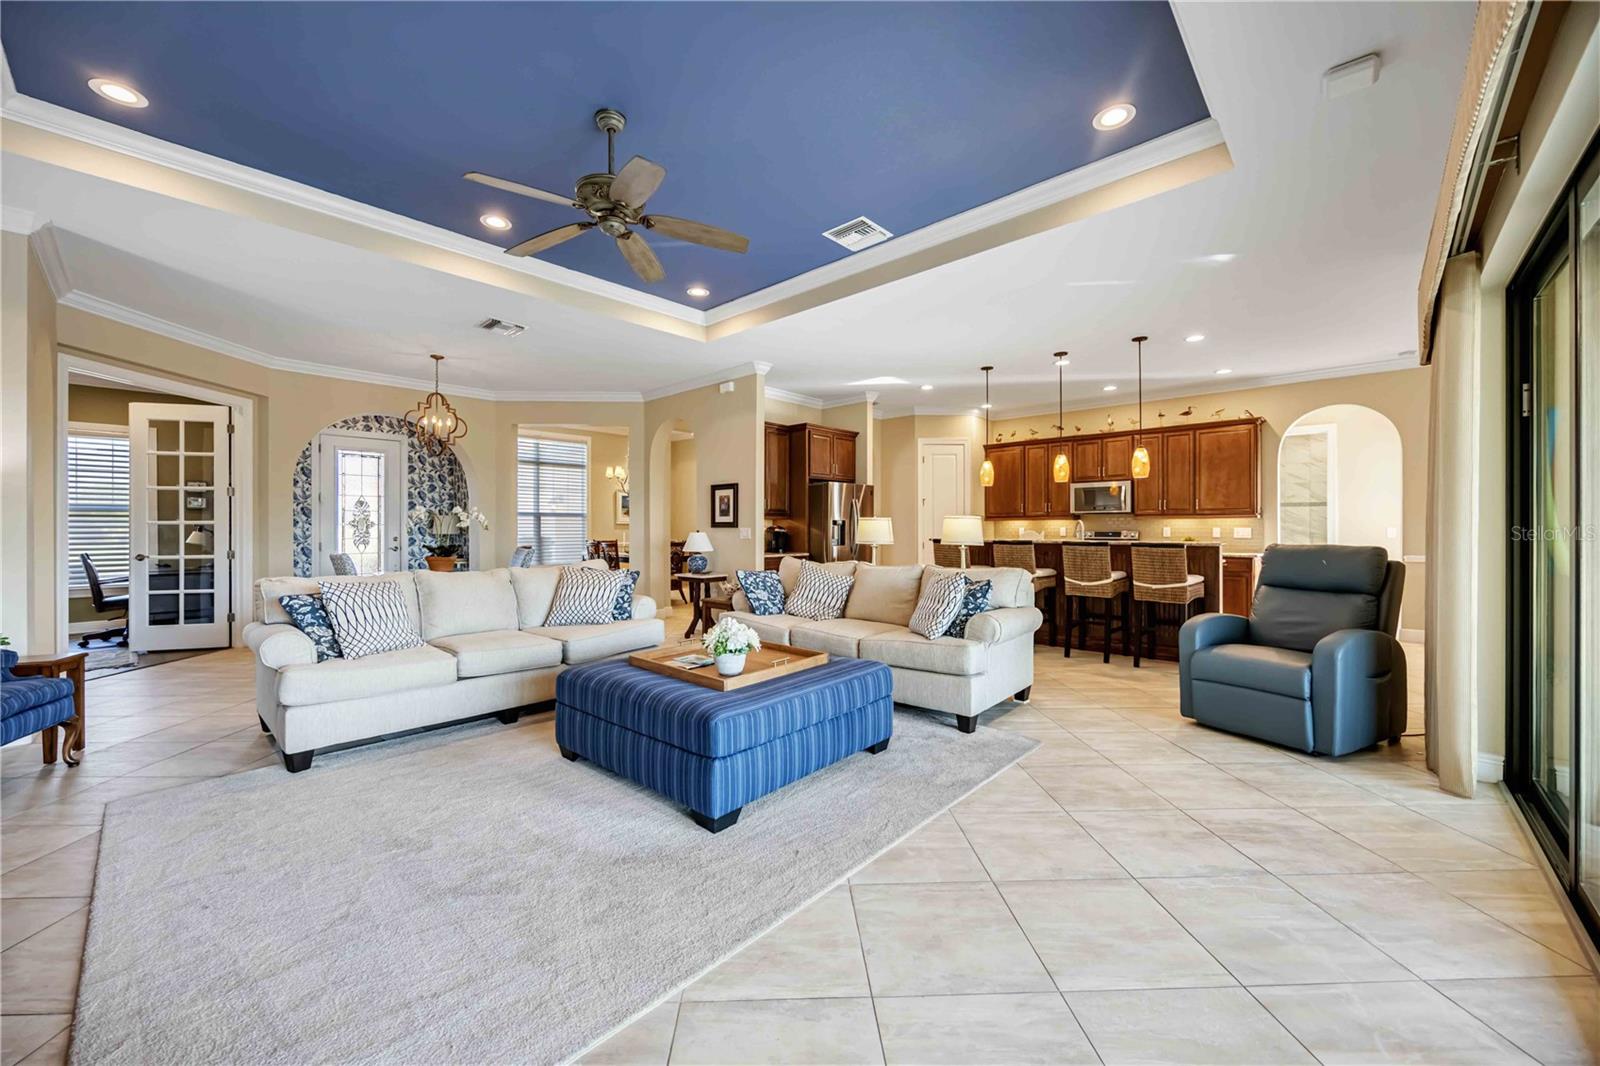
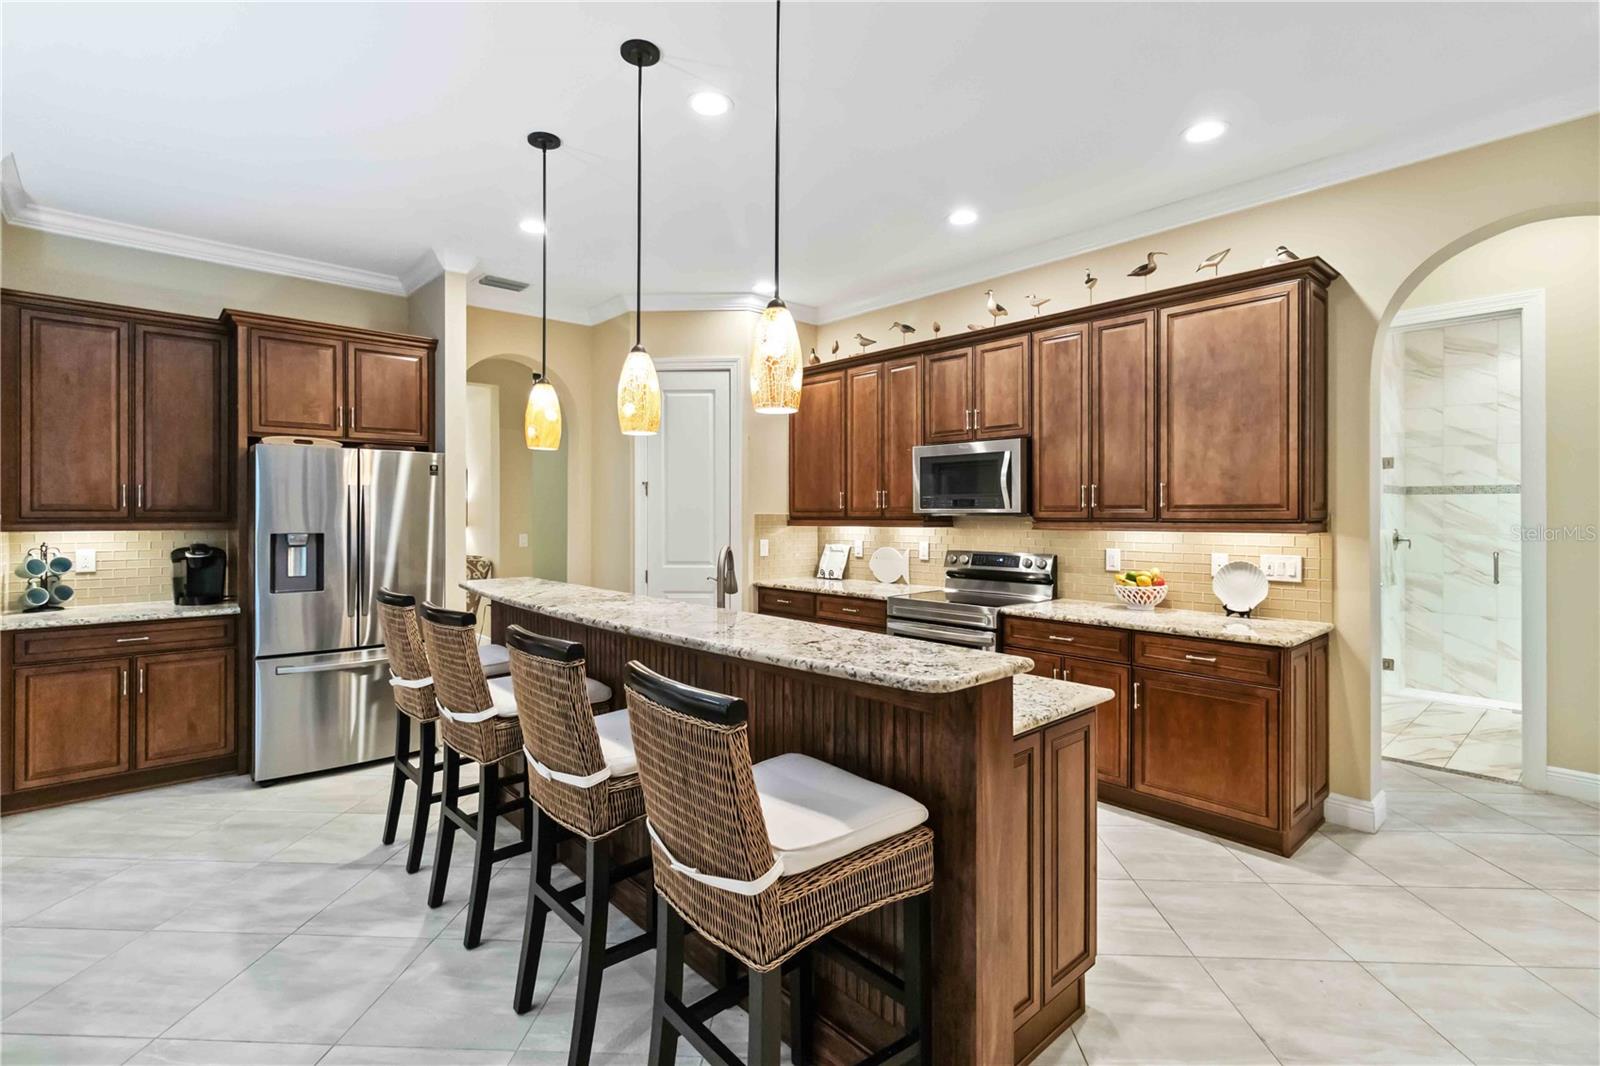
Property Description
Welcome to 10953 Bullrush Drive, where luxury meets serene golf course living. This stunning Pinehurst Model Estate home is perfectly positioned along the celebrated 15th green of Sarasota National, offering breathtaking water views that wrap around the back of the property. Imagine unwinding on your lanai, watching golfers make their final putts, while nature provides a tranquil backdrop filled with graceful wading birds and playful otters. Step inside to discover casual elegance at its finest. This grand southern-style home features 3 ensuite bedrooms, a private den, and an expansive 3-car garage with ample storage. The gourmet kitchen flows seamlessly into a casual dining area, while a formal dining room offers the perfect setting for special gatherings. The thoughtfully placed laundry room at the back of the home ensures quiet convenience. The primary suite is a true sanctuary, enhanced by a 10x20 addition with a structural porch — an idyllic spot for morning coffee or sunset views. French doors in the family room open to the pool, spa, and lanai, creating a seamless indoor-outdoor living experience. With five storm screens and a whole-house generator, this home offers lifelong, worry-free storm protection and added security. Nestled within Sarasota National, a premier gated community on Florida’s southwest coast, this home includes two golf memberships with no buy-in fees. The championship golf course, managed by Troon Privé, ensures an exceptional golfing experience with world-class service, meticulous course care, and exclusive member benefits that extend to elite courses worldwide. Sarasota National is a Silver Certified Audubon community, dedicated to preserving the natural environment. Residents live in harmony with protected wildlife and lush landscapes, promoting sustainable living and preserving the area’s pristine beauty for generations to come. The community’s resort-style amenities include a state-of-the-art fitness center, pool with lap lanes, tennis and pickleball courts, bocce ball, and a vibrant social calendar. Enjoy casual meals at one of the four on-site restaurants, practice your swing on the meticulously maintained course, or explore scenic nature trails. Beyond the gates, historic downtown Venice offers boutique shopping, gourmet dining, and a rich cultural scene, while nearby Wellen Park provides modern conveniences and lively community events. Pristine Gulf Coast beaches and endless outdoor activities complete this unparalleled lifestyle. This Pinehurst Model Estate home is more than just a residence — it's a gateway to extraordinary living, blending luxury, nature, and community with the prestige and benefits of Troon Privé membership. Embrace the best of southwest Florida and make this exceptional property your own.
Build Your Team
Quickly find investor-friendly professionals who can help you succeed in real estate investing at any stage of the investing journey.


Agents
Match with investor-friendly agents who can help you find, analyze, and close your next deal


Lenders
Get the best funding…find investor-friendly lenders who specialize in your deal strategy


Property Managers
Transition to passive investing. Find a trusted property management partnership that lasts.


Tax Pros & Accountants
Taxes and financial reporting made easy—find experts to create tax savings strategies, file taxes, and more
Location
Property Details
Parking
- Description: Assigned, Covered, Driveway, Garage Door Opener, Garage Faces Side, Ground Level, Parking Pad
- Details: Assigned, Covered, Driveway, Garage Door Opener, Garage Faces Side, Parking Pad, Attached
- Garage Spaces: 3
- Spaces Total: 0
Bedroom Information
- # of Bedrooms: 3
Bathroom Information
- # of Baths (Full): 3
- # of Baths (Total): 3.0
Interior Features
- # of Rooms: 9
- # of Stories: 1
Exterior Features
- Exterior Walls Materials: Stucco
- Foundation: Slab
- Roof Type: Hip
- Roof Material: Tile
- Pool: Yes
HOA
- Has HOA: Yes
- Association: Bob Duncan
- HOA Fee: $3,254/quarterly
Land Information
- Land Use: Residential
- Land Use Subtype: Single Family Residential
Lot Information
- Parcel ID: 0462019290
- Lot Size: 12578 sqft
Property Information
- Property Type: Single Family Residence
- Style: Florida, Mediterranean
- Year Built: 2016
Tax Information
- Annual Tax: $9,689
Utilities
- Water & Sewer: Public
- Heating: Central, Heat Pump
- Cooling: Central Air
Location
- County: Sarasota
Listing Details
Investment Summary
- Monthly Cash Flow
- -$3,368
- Cap Rate
- 2.6%
- Cash-on-Cash Return
- -15.3%
- Debt Coverage Ratio
- 0.43
- Internal Rate of Return (5 years)
- -10.8%
Cash Flow
Net Operating Income (NOI) minus mortgage payments.
Calculation:
NOI - Mortgage Payments
Cap Rate (Market Value)
Capitalization Rate is a rate of return that compares the yearly Net Operating Income (NOI) to the market value.
Calculation:
NOI / Market Value
Cash-on-Cash Return (CoC)
Annual Cash Flow / Cash Invested
Calculation:
Annual cash flow divided by initial cash invested.
Debt Coverage Ratio (DCR)
Net Operating Income (NOI) divided by total debt payments.
Calculation:
NOI / Total Debt Payments
Internal Rate of Return (IRR)
A metric for assessing profitability over time. IRR is the discount rate at which the net present value (NPV) of all future cash flows (positive and negative) from an investment equals zero — including both periodic cash flow (such as rent) and a projected sale at the end of the holding period. It represents the expected annualized return, accounting for income, expenses, and the recovery of capital through a future sale.
Purchase Details
Purchase PriceThe price paid for the property. Purchase price:
| $1,150,000 |
|---|---|
Amount FinancedThe amount of the purchase financed through a loan. Amount financed:
| -$920,000 |
Down paymentThe initial payment made towards the purchase. Down payment:
| $230,000 |
Closing CostsFees and expenses associated with purchasing a property, typically ranging from 2% to 5% of the home’s purchase price, paid at the end of a home purchase to cover services like lending, title transfer, and taxes. Closing costs:
| $34,500 |
Rehab CostsCosts incurred to repair or improve the property, including: roof, flooring, exterior siding, kitchen, exterior paint, bathrooms, etc. Rehab costs:
| $0 |
Initial Cash InvestedThe total initial cash invested in the property. Calculation:Down payment + Buying costs + Rehab costs Initial cash invested:
| $264,500 |
Square Feet (SQFT)The total square footage of the property. Square feet:
| 2,999 |
Cost Per Square FootCost per square foot of the property. Calculation:Purchase Price / Square Feet Cost per square foot:
| $383 |
Monthly Rent Per Square FootMonthly rent divided by the number of square feet. This ratio helps investors compare rental income efficiency across properties, markets, and unit sizes Calculation:Monthly Rent / Square Feet Monthly rent per square foot:
| $2.13 |
Financing Details
Loan AmountThe total sum of money borrowed from a lender to finance a property purchase. Calculation:Purchase Price - Down Payment
Loan amount:
| $920,000 |
|---|---|
Loan to Value Ratio (LTV)Loan amount divided by the market value of the property. Calculation:Loan Amount / Market Value
Loan to value ratio:
| 80.0% |
Loan TypeThe type of loan (e.g., fixed, adjustable).
Loan type:
| Amortizing |
TermThe loan repayment period in years.
Term:
| 30 years |
Interest RateThe percentage a lender charges on the borrowed amount of a loan, determining the cost of borrowing money.
Interest rate:
| 6.625% |
Principal & Interest (PI)The principal is the portion of the loan payment that reduces the loan balance. The interest is the lender's charge for borrowing money. Calculation:(P * r * (1 + r) ** n) / ((1 + r) ** n - 1) Where:
P = Loan amount (principal)
Principal & interest:
| $5,891 |
Property TaxesAnnual taxes levied by local governments on real estate properties. These taxes fund public services like schools, roads, and emergency services.
Property tax:
| $808 |
InsuranceThe costs for insurance coverage to protect against financial losses due to risks like fire, natural disasters, theft, liability, or tenant-related damages. Calculation:Assumes 7% of gross rental income, unless insurance rates are specified.
Insurance:
| $448 |
Private Mortgage Insurance (PMI)A fee that borrowers pay when they take out a conventional loan with a loan-to-value (LTV) ratio above 80%.
Private mortgage insurance (PMI):
| $0 |
Monthly PaymentThe fixed amount a borrower pays each month to repay a loan. It typically includes principal and interest (P&I) and may also cover property taxes, insurance, HOA fees, and PMI if escrowed. Monthly payment:
| $7,147 |
Operating Income
| % Rent | Monthly | Yearly | |
|---|---|---|---|
Gross RentThe total rental income received from tenants before deducting any expenses. Includes base rent, late fees, pet fees, parking fees, and other recurring charges.
Gross rent:
| $6,400 | $76,800 | |
Vacancy LossExpected loss of rent due to vacancies.
Vacancy loss:
(6%)
| 6% | -$384 | -$4,608 |
Operating IncomeGross rental income minus vacancy loss. Calculation:Gross rent - Vacancy loss
Operating income:
| $6,016 | $72,192 |
Operating Expenses
| % Rent | Monthly | Yearly | |
|---|---|---|---|
Property TaxesAnnual taxes levied by local governments on real estate properties. These taxes fund public services like schools, roads, and emergency services. | 13% | -$808 | -$9,690 |
InsuranceThe costs for insurance coverage to protect against financial losses due to risks like fire, natural disasters, theft, liability, or tenant-related damages. Calculation:Assumes 7% of gross rental income, unless insurance rates are specified. | 7% | -$448 | -$5,376 |
Property ManagementThe costs associated with hiring a property manager to handle the day-to-day operations of a rental property. Includes management fees, leasing fes, eviction fees, etc. Calculation:Assumes 8% of gross rental income. | 8% | -$512 | -$6,144 |
Repairs & MaintenanceOngoing costs for routine upkeep and minor fixes needed to keep a property in good working condition. Calculation:Assumes 5% of gross rental income. Varies by property age and condition. | 5% | -$320 | -$3,840 |
Capital ExpensesLarge, infrequent costs for major improvements or replacements, like a new roof, HVAC system, or appliances. Calculation:Assumes 5% of gross rental income. Varies by property age. | 5% | -$320 | -$3,840 |
HOA FeesRegular dues paid to a Homeowners Association for community maintenance, amenities, and management. Similar fees include: Condo Association Fees, Co-op Maintenance Fees, etc. | 17% | -$1,085 | -$13,020 |
Operating ExpensesRecurring costs required to maintain and manage a rental property, including property taxes, insurance, maintenance, repairs, utilities (if paid by the owner), property management fees, and other day-to-day expenses. Calculation:Insurance + Property Taxes + Property Management + Repairs & Maintenance + Capital Expenditures + HOA Fees | 55% | -$3,493 | -$41,910 |
Cash Flow
| Monthly | Yearly | |
|---|---|---|
Net Operating Income (NOI)The income generated from a property after deducting all operating expenses but before deducting mortgage payments, taxes, and capital expenditures. Calculation:Gross Operating Income - Operating Expenses
Net operating income:
| $2,523 | $30,276 |
Mortgage PaymentThe fixed amount a borrower pays each month to repay a loan. It typically includes principal and interest (P&I) and may also cover property taxes, insurance, HOA fees, and PMI if escrowed. | -$5,891 | -$70,692 |
Cash FlowNet Operating Income (NOI) minus mortgage payments. Calculation:NOI - Mortgage Payments | $3,368 | $40,416 |