$1,590,000
Investment Summary
We noticed that HOA fees are missing—this is a standard expense and should be considered in your estimate.
- Monthly Cash Flow
- -$3,936
- Cap Rate
- 3.3%
- Cash-on-Cash Return
- -12.9%
- Debt Coverage Ratio
- 0.53
- Internal Rate of Return (5 years)
- -8.5%
Cash Flow
Net Operating Income (NOI) minus mortgage payments.
Calculation:
NOI - Mortgage Payments
Cap Rate (Market Value)
Capitalization Rate is a rate of return that compares the yearly Net Operating Income (NOI) to the market value.
Calculation:
NOI / Market Value
Cash-on-Cash Return (CoC)
Annual Cash Flow / Cash Invested
Calculation:
Annual cash flow divided by initial cash invested.
Debt Coverage Ratio (DCR)
Net Operating Income (NOI) divided by total debt payments.
Calculation:
NOI / Total Debt Payments
Internal Rate of Return (IRR)
A metric for assessing profitability over time. IRR is the discount rate at which the net present value (NPV) of all future cash flows (positive and negative) from an investment equals zero — including both periodic cash flow (such as rent) and a projected sale at the end of the holding period. It represents the expected annualized return, accounting for income, expenses, and the recovery of capital through a future sale.
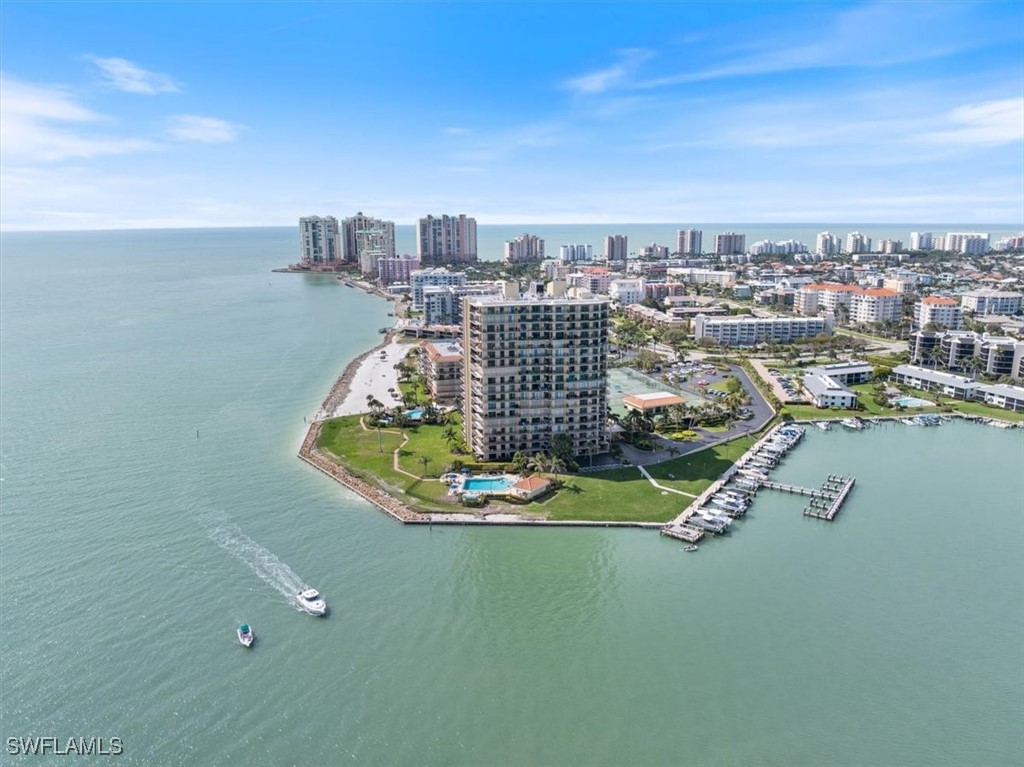
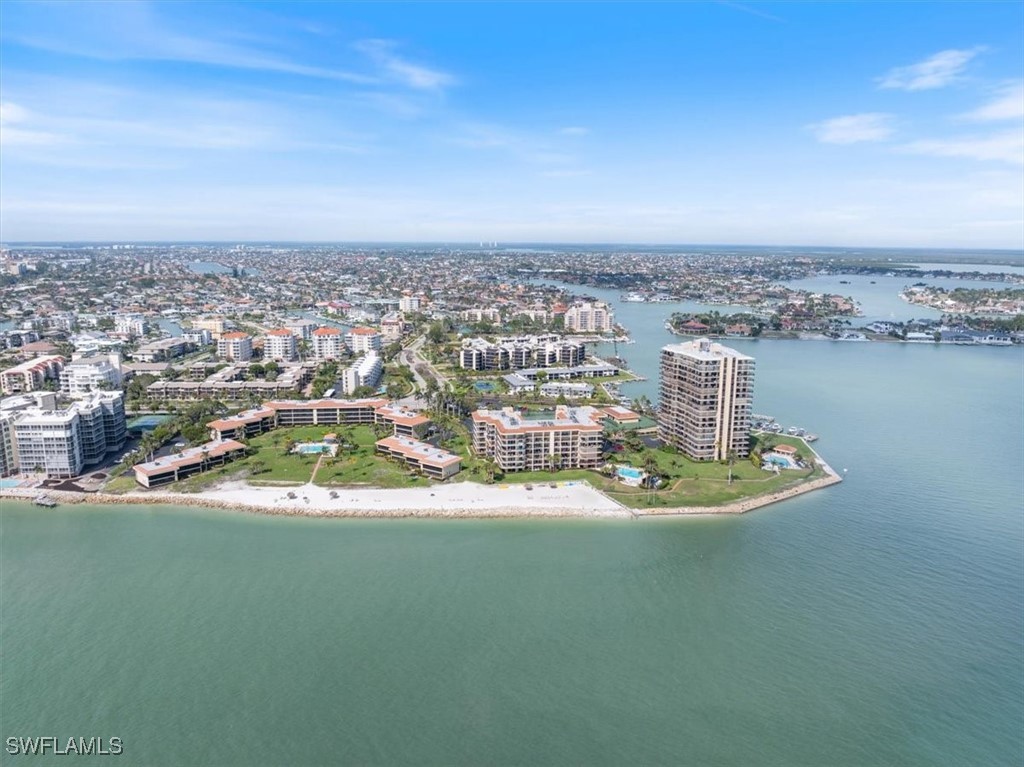
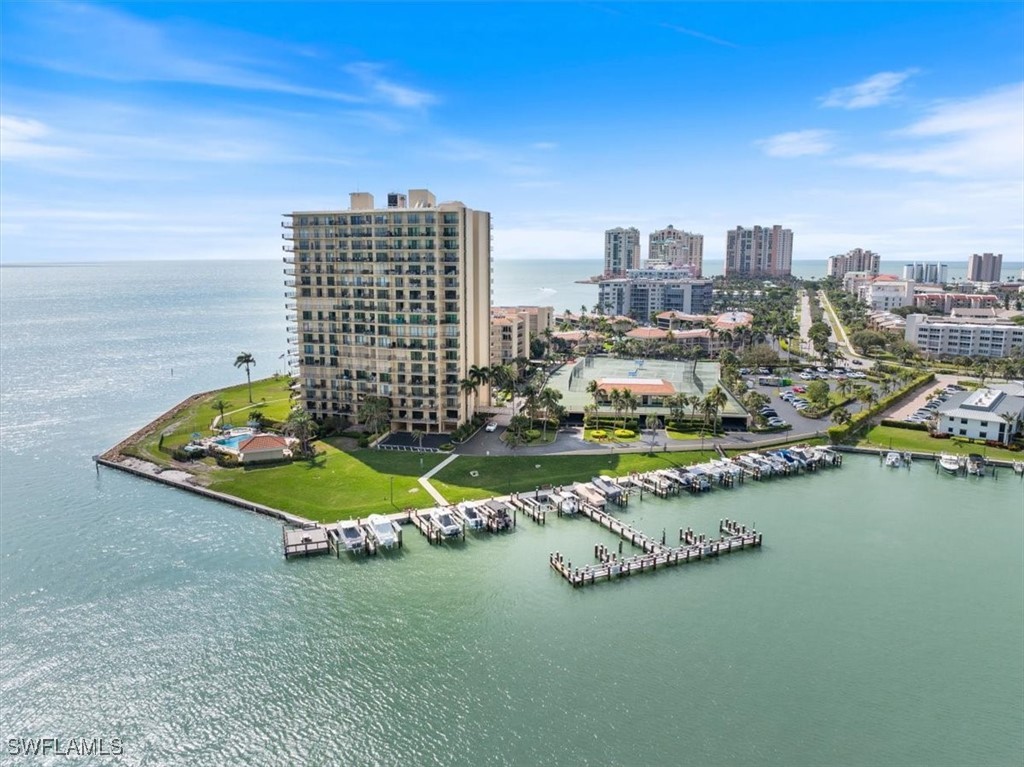
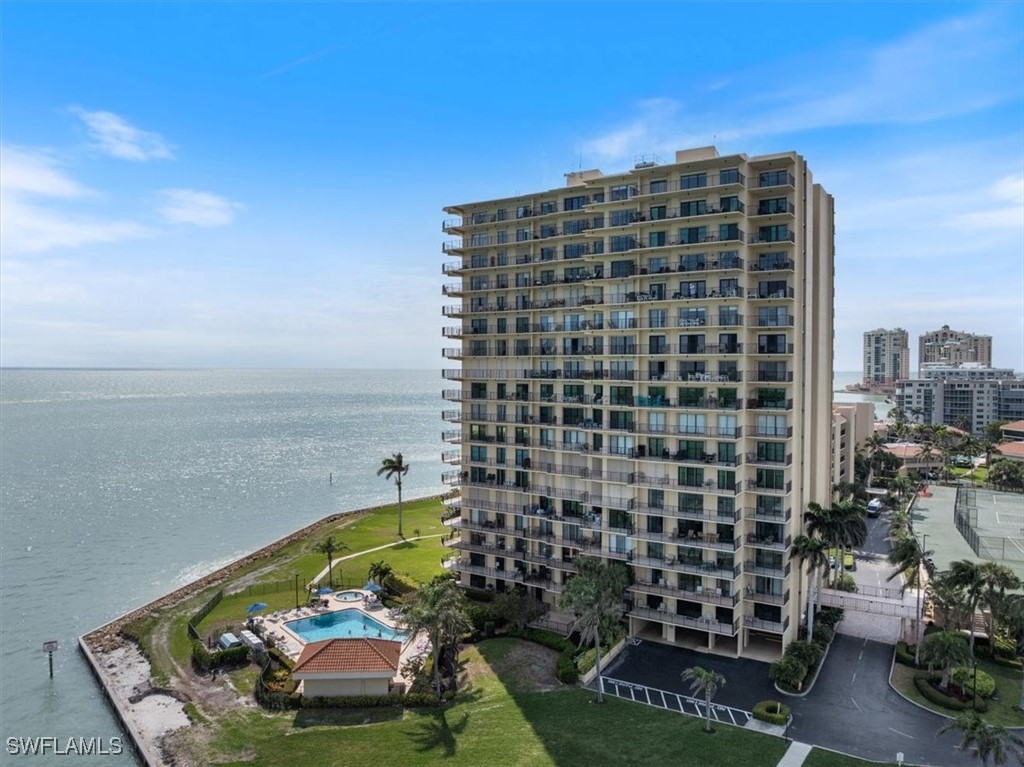
Property Description
OFF SEASON SPECIAL NOW IS A GREAT OPPORTUNITY TO PURCHASE YOUR OWN INCREDIBLE PIECE OF PARADISE! This HGTV inspired, totally renovated condominium has it all and is situated at the southern tip of Marco Island in highly sought after Shipps Landing. You will enjoy sweeping views of Caxambas Pass, Ten Thousand Islands, and the Gulf of Mexico from every room of this corner unit. There are two private balconies that offer outstanding picturesque water views from sunrise to sunset, and a great place for you to begin & end your day. This 10th-floor luxury resort-style home offers two roomy bedrooms, two splendid baths, and a redesigned and designated office space that is the perfect blend of style, form, & function. Once inside, you will be pleased by this surprisingly spacious re-designed, open concept home with four impact-resistant sliders that provide tons of natural light and phenomenal views from every room. This home has an abundance of high-end, tasteful finishes; plank tile flooring, crown molding, 5.5-inch baseboards, upgraded fans & fixtures, and LED recessed lighting to name a few. The kitchen features custom white soft close cabinets, designer handles, exquisite Cambria quartz backsplash and countertops, JennAir Stainless Steel appliances along with a custom coffee and dry bar. There is a spacious breakfast bar with loads of counter space ideal for creating your next delicious gourmet meal. The split floor plan provides plenty of privacy for you and your overnight guests. Both bathrooms have been gorgeously remodeled and make this home an entertainer’s delight as it is the perfect place to host family & friends. There are two large walk-in closets for you to help maximize your storage space; keeping you and your home neat & organized. The laundry room has a newer full size stackable washer/dryer, a folding counter/storage cabinet, & a convenient utility sink. Shipps Landing is a 15-acre waterfront active community that offers numerous amenities that include 3 outdoor Pools/Spas, a well-equipped Fitness Center, Tennis & Pickleball Courts, Bocce Ball, Shuffleboard, Pool and Ping Pong Table & Community Grills, a Private Beach & Kayak Launch, Fishing Pier, and Marina with 32 Dock Boat Slips & Lifts that can be leased. Shipps Landing is close to Marco Island Executive (MKY) Airport & Naples Municipal Airport (APF), in addition it offers exclusive shopping, superb coastal dining, & unique entertainment. This home truly is a MUST SEE! Ask for the Home Feature Sheet. Start packing...you DON’T want to miss the opportunity to own this magnificent move in ready home and begin your own fabulous coastal-waterfront lifestyle of which you have always dreamed. The only thing missing is YOU!
Build Your Team
Quickly find investor-friendly professionals who can help you succeed in real estate investing at any stage of the investing journey.


Agents
Match with investor-friendly agents who can help you find, analyze, and close your next deal


Lenders
Get the best funding…find investor-friendly lenders who specialize in your deal strategy


Property Managers
Transition to passive investing. Find a trusted property management partnership that lasts.


Tax Pros & Accountants
Taxes and financial reporting made easy—find experts to create tax savings strategies, file taxes, and more
Location
Property Details
Parking
- Details: Assigned, Covered, Deeded, Driveway, Detached, Underground, Garage, Paved, Electric Vehicle Charging Station(s)
- Garage Spaces: 1
- Spaces Total: 0
Bedroom Information
- # of Bedrooms: 2
Bathroom Information
- # of Baths (Full): 2
- # of Baths (Total): 2.0
Interior Features
- # of Rooms: 8
- # of Stories: 19
Exterior Features
- Roof Material: Built-Up, Flat
- Pool: Yes
Land Information
- Land Use: Residential
- Land Use Subtype: Condominium Unit
Lot Information
- Parcel ID: 73536320003
- Lot Size: 0 sqft
Property Information
- Property Type: Condominium
- Style: Other, High Rise
- Year Built: 1981
Tax Information
- Annual Tax: $5,276
Utilities
- Water & Sewer: Public
- Heating: Central, Electric, Heat Pump
- Cooling: Central Air, Electric, Heat Pump
Location
- County: Collier
Listing Details
Investment Summary
We noticed that HOA fees are missing—this is a standard expense and should be considered in your estimate.
- Monthly Cash Flow
- -$3,936
- Cap Rate
- 3.3%
- Cash-on-Cash Return
- -12.9%
- Debt Coverage Ratio
- 0.53
- Internal Rate of Return (5 years)
- -8.5%
Cash Flow
Net Operating Income (NOI) minus mortgage payments.
Calculation:
NOI - Mortgage Payments
Cap Rate (Market Value)
Capitalization Rate is a rate of return that compares the yearly Net Operating Income (NOI) to the market value.
Calculation:
NOI / Market Value
Cash-on-Cash Return (CoC)
Annual Cash Flow / Cash Invested
Calculation:
Annual cash flow divided by initial cash invested.
Debt Coverage Ratio (DCR)
Net Operating Income (NOI) divided by total debt payments.
Calculation:
NOI / Total Debt Payments
Internal Rate of Return (IRR)
A metric for assessing profitability over time. IRR is the discount rate at which the net present value (NPV) of all future cash flows (positive and negative) from an investment equals zero — including both periodic cash flow (such as rent) and a projected sale at the end of the holding period. It represents the expected annualized return, accounting for income, expenses, and the recovery of capital through a future sale.
Purchase Details
Purchase PriceThe price paid for the property. Purchase price:
| $1,590,000 |
|---|---|
Amount FinancedThe amount of the purchase financed through a loan. Amount financed:
| -$1,272,000 |
Down paymentThe initial payment made towards the purchase. Down payment:
| $318,000 |
Closing CostsFees and expenses associated with purchasing a property, typically ranging from 2% to 5% of the home’s purchase price, paid at the end of a home purchase to cover services like lending, title transfer, and taxes. Closing costs:
| $47,700 |
Rehab CostsCosts incurred to repair or improve the property, including: roof, flooring, exterior siding, kitchen, exterior paint, bathrooms, etc. Rehab costs:
| $0 |
Initial Cash InvestedThe total initial cash invested in the property. Calculation:Down payment + Buying costs + Rehab costs Initial cash invested:
| $365,700 |
Square Feet (SQFT)The total square footage of the property. Square feet:
| 1,711 |
Cost Per Square FootCost per square foot of the property. Calculation:Purchase Price / Square Feet Cost per square foot:
| $929 |
Monthly Rent Per Square FootMonthly rent divided by the number of square feet. This ratio helps investors compare rental income efficiency across properties, markets, and unit sizes Calculation:Monthly Rent / Square Feet Monthly rent per square foot:
| $4.09 |
Financing Details
Loan AmountThe total sum of money borrowed from a lender to finance a property purchase. Calculation:Purchase Price - Down Payment
Loan amount:
| $1,272,000 |
|---|---|
Loan to Value Ratio (LTV)Loan amount divided by the market value of the property. Calculation:Loan Amount / Market Value
Loan to value ratio:
| 80.0% |
Loan TypeThe type of loan (e.g., fixed, adjustable).
Loan type:
| Amortizing |
TermThe loan repayment period in years.
Term:
| 30 years |
Interest RateThe percentage a lender charges on the borrowed amount of a loan, determining the cost of borrowing money.
Interest rate:
| 6.840% |
Principal & Interest (PI)The principal is the portion of the loan payment that reduces the loan balance. The interest is the lender's charge for borrowing money. Calculation:(P * r * (1 + r) ** n) / ((1 + r) ** n - 1) Where:
P = Loan amount (principal)
Principal & interest:
| $8,326 |
Property TaxesAnnual taxes levied by local governments on real estate properties. These taxes fund public services like schools, roads, and emergency services.
Property tax:
| $440 |
InsuranceThe costs for insurance coverage to protect against financial losses due to risks like fire, natural disasters, theft, liability, or tenant-related damages. Calculation:Assumes 7% of gross rental income, unless insurance rates are specified.
Insurance:
| $490 |
Private Mortgage Insurance (PMI)A fee that borrowers pay when they take out a conventional loan with a loan-to-value (LTV) ratio above 80%.
Private mortgage insurance (PMI):
| $0 |
Monthly PaymentThe fixed amount a borrower pays each month to repay a loan. It typically includes principal and interest (P&I) and may also cover property taxes, insurance, HOA fees, and PMI if escrowed. Monthly payment:
| $9,256 |
Operating Income
| % Rent | Monthly | Yearly | |
|---|---|---|---|
Gross RentThe total rental income received from tenants before deducting any expenses. Includes base rent, late fees, pet fees, parking fees, and other recurring charges.
Gross rent:
| $7,000 | $84,000 | |
Vacancy LossExpected loss of rent due to vacancies.
Vacancy loss:
(6%)
| 6% | -$420 | -$5,040 |
Operating IncomeGross rental income minus vacancy loss. Calculation:Gross rent - Vacancy loss
Operating income:
| $6,580 | $78,960 |
Operating Expenses
| % Rent | Monthly | Yearly | |
|---|---|---|---|
Property TaxesAnnual taxes levied by local governments on real estate properties. These taxes fund public services like schools, roads, and emergency services. | 6% | -$440 | -$5,276 |
InsuranceThe costs for insurance coverage to protect against financial losses due to risks like fire, natural disasters, theft, liability, or tenant-related damages. Calculation:Assumes 7% of gross rental income, unless insurance rates are specified. | 7% | -$490 | -$5,880 |
Property ManagementThe costs associated with hiring a property manager to handle the day-to-day operations of a rental property. Includes management fees, leasing fes, eviction fees, etc. Calculation:Assumes 8% of gross rental income. | 8% | -$560 | -$6,720 |
Repairs & MaintenanceOngoing costs for routine upkeep and minor fixes needed to keep a property in good working condition. Calculation:Assumes 5% of gross rental income. Varies by property age and condition. | 5% | -$350 | -$4,200 |
Capital ExpensesLarge, infrequent costs for major improvements or replacements, like a new roof, HVAC system, or appliances. Calculation:Assumes 5% of gross rental income. Varies by property age. | 5% | -$350 | -$4,200 |
HOA FeesRegular dues paid to a Homeowners Association for community maintenance, amenities, and management. Similar fees include: Condo Association Fees, Co-op Maintenance Fees, etc. | n/a | n/a | n/a |
Operating ExpensesRecurring costs required to maintain and manage a rental property, including property taxes, insurance, maintenance, repairs, utilities (if paid by the owner), property management fees, and other day-to-day expenses. Calculation:Insurance + Property Taxes + Property Management + Repairs & Maintenance + Capital Expenditures + HOA Fees | 31% | -$2,190 | -$26,276 |
Cash Flow
| Monthly | Yearly | |
|---|---|---|
Net Operating Income (NOI)The income generated from a property after deducting all operating expenses but before deducting mortgage payments, taxes, and capital expenditures. Calculation:Gross Operating Income - Operating Expenses
Net operating income:
| $4,390 | $52,680 |
Mortgage PaymentThe fixed amount a borrower pays each month to repay a loan. It typically includes principal and interest (P&I) and may also cover property taxes, insurance, HOA fees, and PMI if escrowed. | -$8,326 | -$99,912 |
Cash FlowNet Operating Income (NOI) minus mortgage payments. Calculation:NOI - Mortgage Payments | $3,936 | $47,232 |