$599,900
Investment Summary
- Monthly Cash Flow
- -$1,610
- Cap Rate
- 3.1%
- Cash-on-Cash Return
- -14.0%
- Debt Coverage Ratio
- 0.49
- Internal Rate of Return (5 years)
- -9.5%
Cash Flow
Net Operating Income (NOI) minus mortgage payments.
Calculation:
NOI - Mortgage Payments
Cap Rate (Market Value)
Capitalization Rate is a rate of return that compares the yearly Net Operating Income (NOI) to the market value.
Calculation:
NOI / Market Value
Cash-on-Cash Return (CoC)
Annual Cash Flow / Cash Invested
Calculation:
Annual cash flow divided by initial cash invested.
Debt Coverage Ratio (DCR)
Net Operating Income (NOI) divided by total debt payments.
Calculation:
NOI / Total Debt Payments
Internal Rate of Return (IRR)
A metric for assessing profitability over time. IRR is the discount rate at which the net present value (NPV) of all future cash flows (positive and negative) from an investment equals zero — including both periodic cash flow (such as rent) and a projected sale at the end of the holding period. It represents the expected annualized return, accounting for income, expenses, and the recovery of capital through a future sale.
Property Description
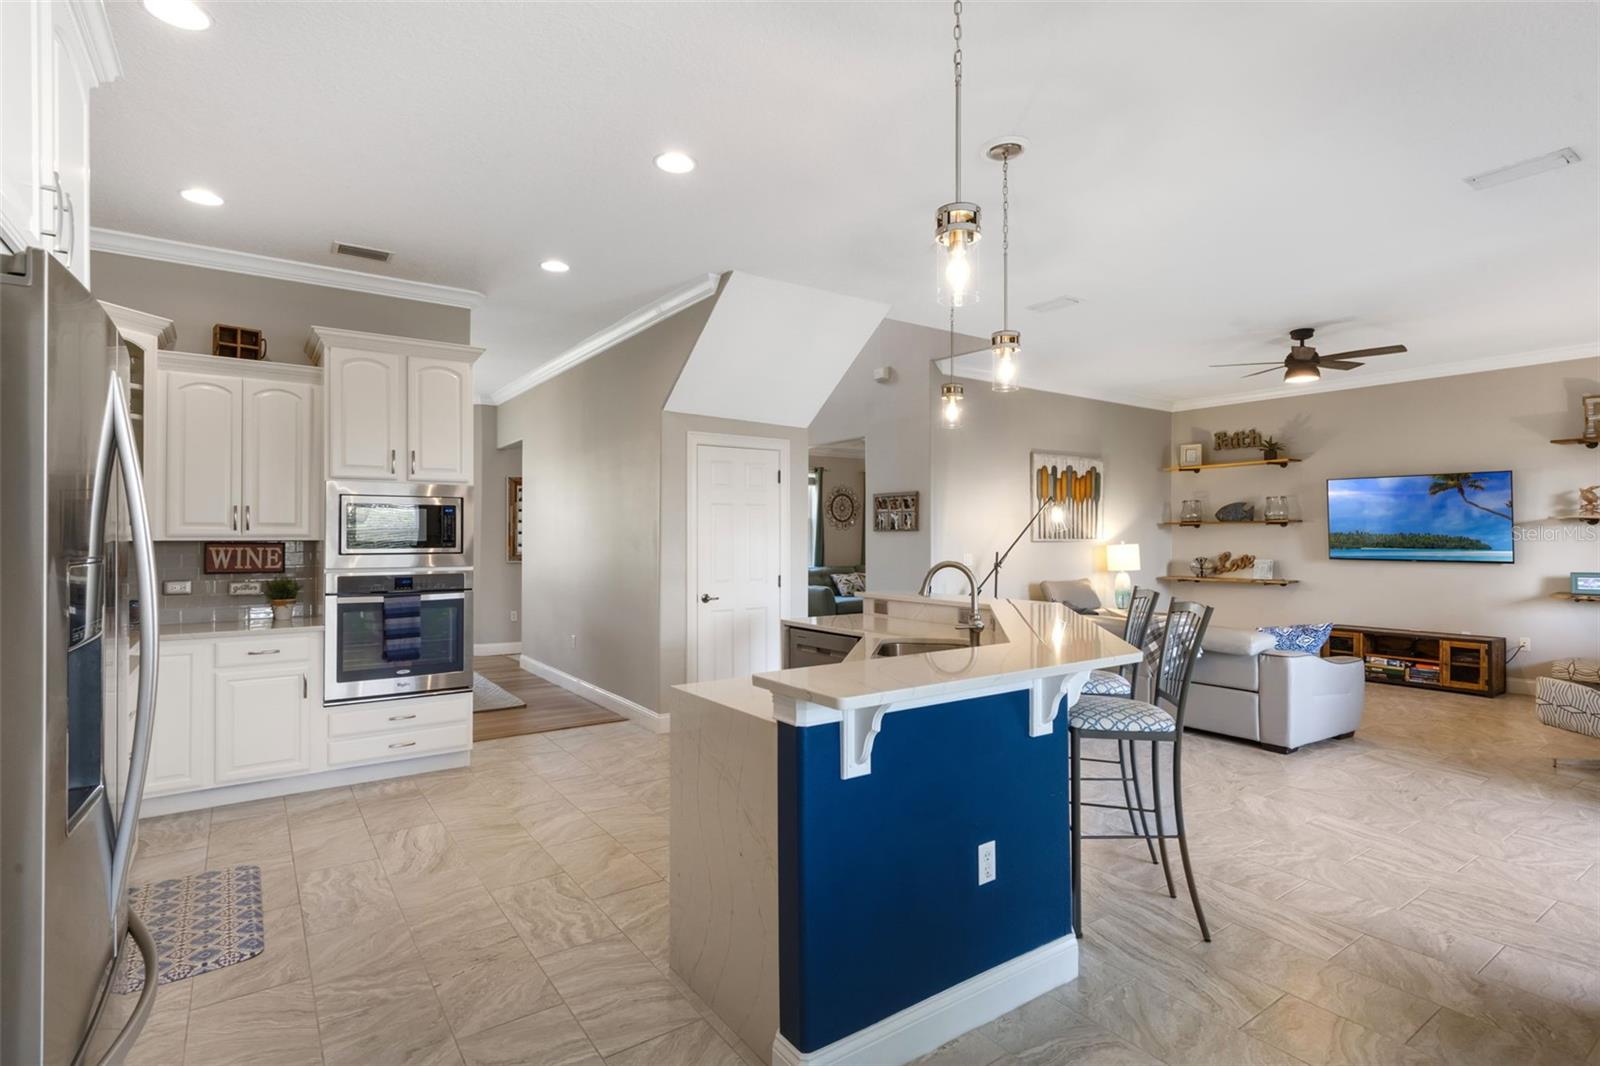
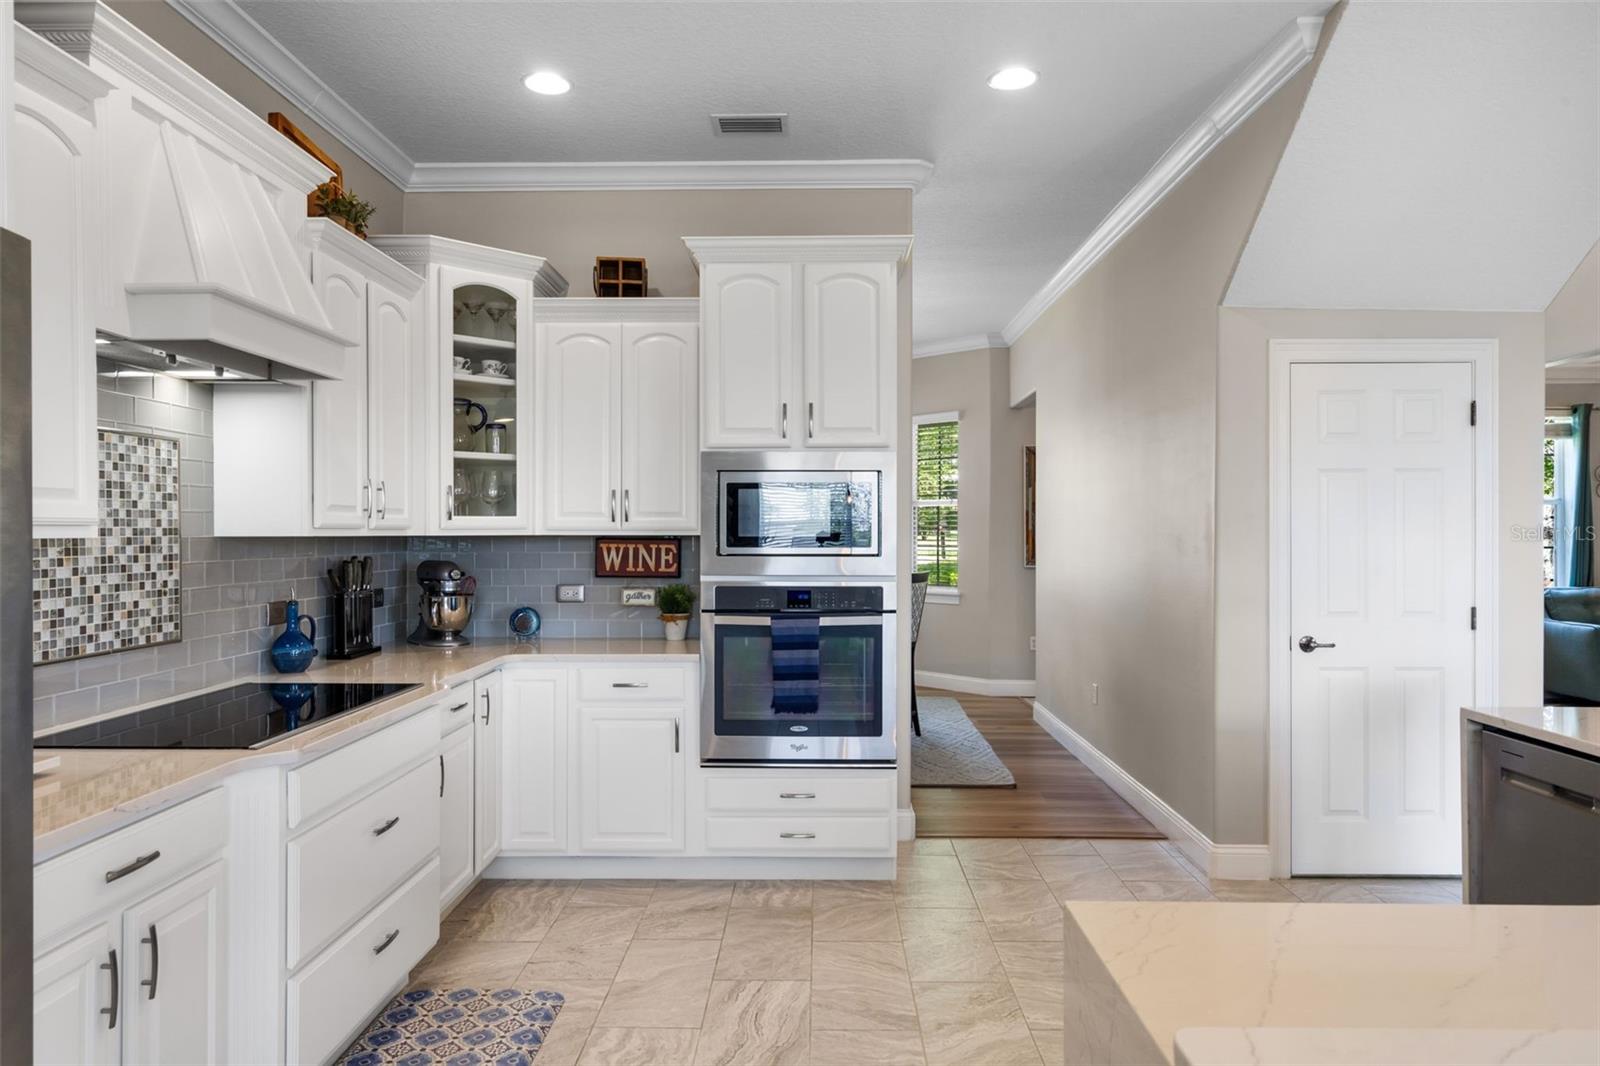
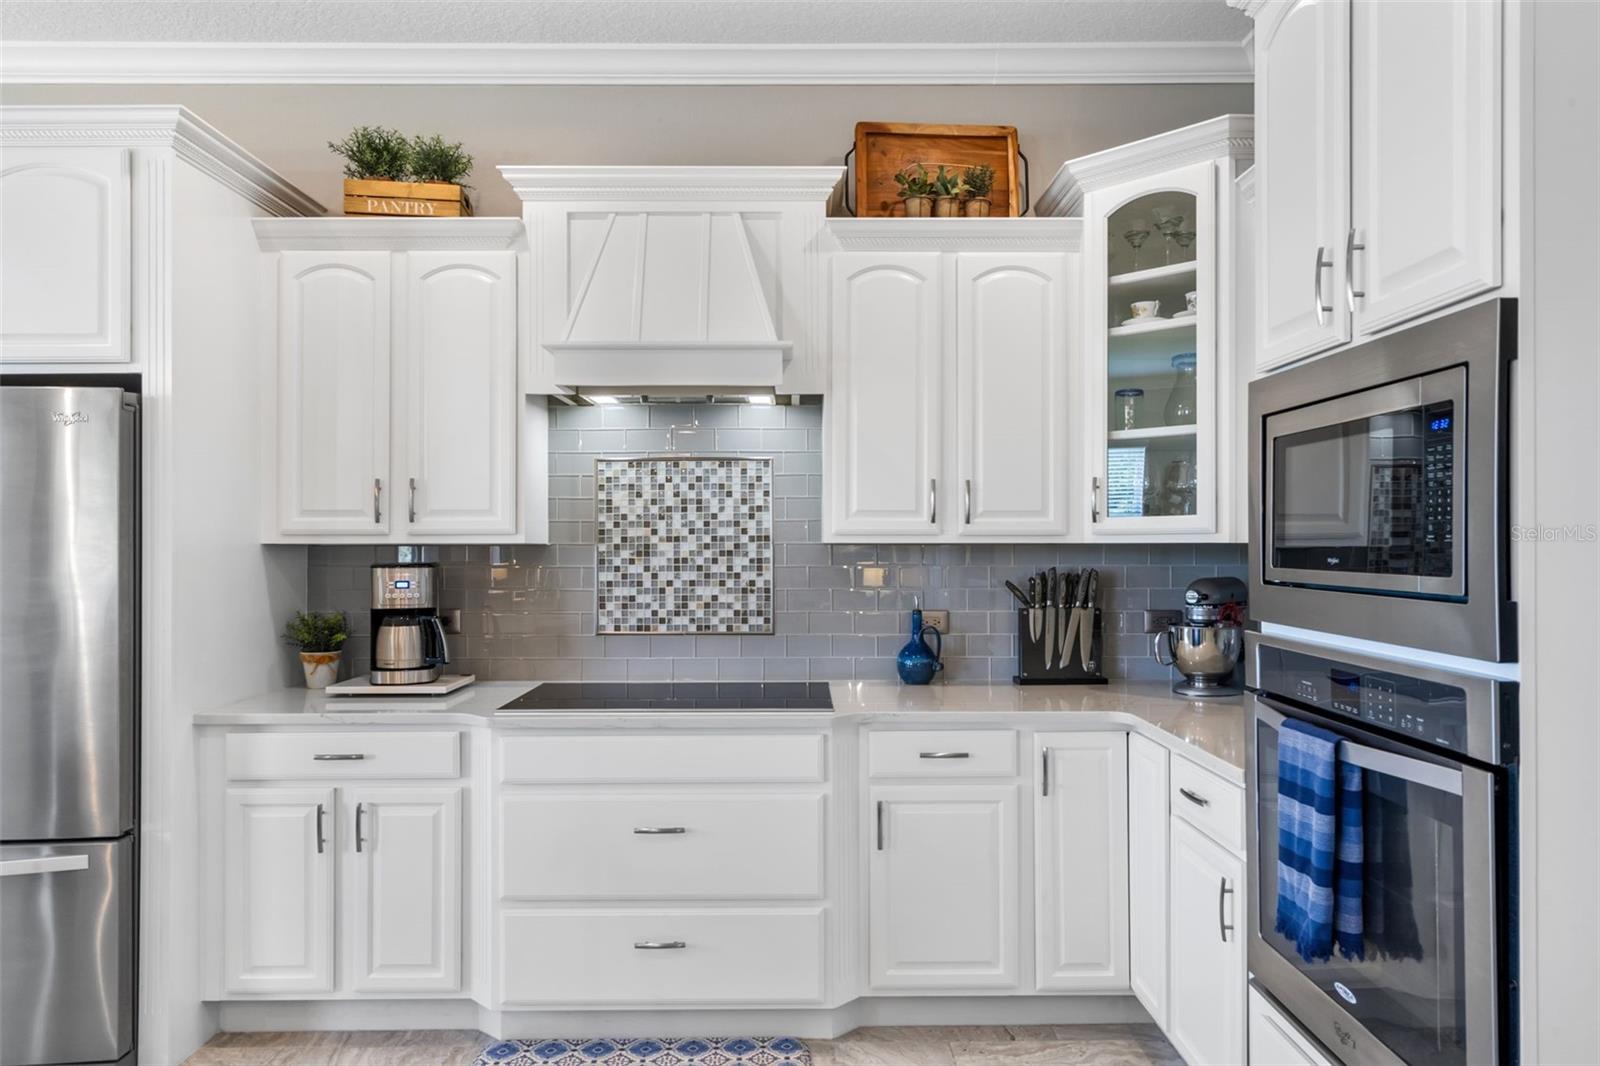
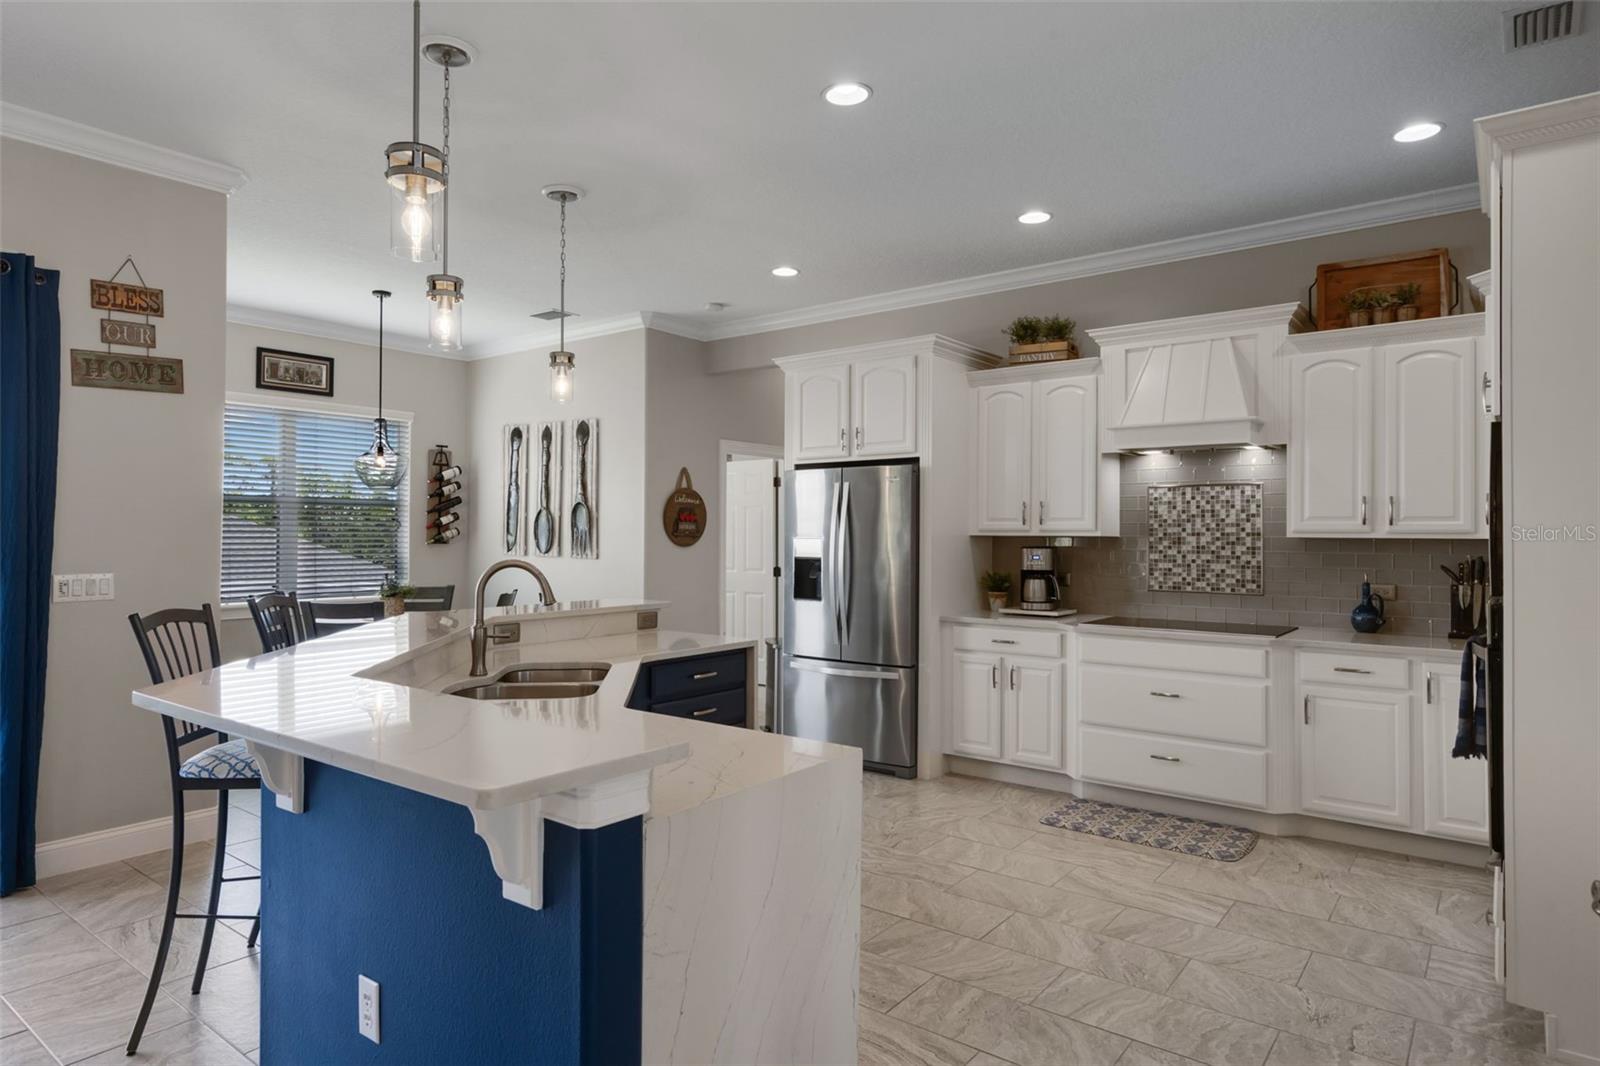
Gorgeous custom home in a gated community. Welcome to your dream lifestyle in this exquisitely remodeled custom home in a smaller gated community with access to the renowned Clermont Chain of Lakes. Boasting a private boat ramp and dock, this four-bedroom, three-bath residence offers a blend of luxury, comfort and waterfront recreation. Entertainer's dream kitchen. The heart of this home showcases a magnificent chef's kitchen featuring stunning quartz countertops with dramatic waterfall edge and premium stainless steel appliance package including built-in oven, microwave, and elegant cooktop with custom hood. The designer tiled backsplash creates an amazing focal point, complemented by 42-inch cabinetry with crown molding and convenient soft-close drawers. Stylish pendant lighting illuminates the expansive workspace, while a charming breakfast nook provides casual dining. Versatile, elegant living spaces. The formal dining room offers a setting for memorable gatherings, while the formal living room provides flexibility as a second family room or home office. The expansive family room features sliding glass doors opening to a screened porch, ideal for year-round outdoor enjoyment. A convenient main-floor bedroom features a walk-in closet and adjacent full bath, ideal for guests or multi-generational living. Luxurious primary retreat. The upstairs primary suite is a private sanctuary with a private balcony showcasing breathtaking views of Lake Susan and spectacular sunrise vistas. Dual walk-in closets provide abundant storage, while the large bath features a deep soaking tub, separate shower and double vanities topped with gorgeous granite. Additional features. Two additional well-appointed bedrooms upstairs share a third full bath with designer finishes. Throughout the home, gorgeous tiled flooring and premium luxury vinyl plank create a cohesive, elegant aesthetic, while a show-stopping custom staircase serves as an elegant focal point. The two-car side-entry garage with extended driveway offers ample guest parking, and the generously sized cul-de-sac lot provides privacy and security. Rain gutters with lifetime warranty, full irrigation system and lush landscape make this a desired home to visit. Lakefront lifestyle. The Clermont Chain of Lakes delivers the ultimate Florida waterfront experience with access to 13 interconnected lakes offering endless recreational opportunities. Enjoy waterfront dining at several lakeside restaurants and easy access to revitalized downtown Clermont with its charming breweries, boutique shops and vibrant events. Whether you love kayaking, wakeboarding, surfing, fishing, or simply floating and soaking up the Florida sunshine, this location offers it all. Prime location. Ideally within an hour's drive of Walt Disney World Resort, Universal Orlando Resort, Orlando International Airport and world-class shopping destinations, this meticulously maintained waterfront retreat offers a balance of luxurious living and outdoor recreation in one of Central Florida's most desirable communities. Schedule your private showing today after viewing the interior/drone video!
Build Your Team
Quickly find investor-friendly professionals who can help you succeed in real estate investing at any stage of the investing journey.


Agents
Match with investor-friendly agents who can help you find, analyze, and close your next deal


Lenders
Get the best funding…find investor-friendly lenders who specialize in your deal strategy


Property Managers
Transition to passive investing. Find a trusted property management partnership that lasts.


Tax Pros & Accountants
Taxes and financial reporting made easy—find experts to create tax savings strategies, file taxes, and more
Location
Property Details
Parking
- Description: Garage Faces Rear, Garage Faces Side
- Details: Garage Door Opener, Garage Faces Side, Attached
- Garage Spaces: 2
- Spaces Total: 0
Bedroom Information
- # of Bedrooms: 4
Bathroom Information
- # of Baths (Full): 3
- # of Baths (Total): 3.0
Interior Features
- # of Rooms: 12
- # of Stories: 1
Exterior Features
- Exterior Walls Materials: Brick Veneer
- Foundation: Slab
- Roof Material: Shingle
HOA
- Has HOA: Yes
- Association: Richard Drake
- HOA Fee: $525/quarterly
Land Information
- Land Use: Residential
- Land Use Subtype: Single Family Residential
Lot Information
- Parcel ID: 012325190500007200
- Lot Size: 12563 sqft
Property Information
- Property Type: Single Family Residence
- Style: Custom
- Year Built: 2006
Tax Information
- Annual Tax: $3,523
Utilities
- Water & Sewer: Public
- Heating: Central, Electric, Heat Pump
- Cooling: Central Air
Location
- County: Lake
Listing Details
Investment Summary
- Monthly Cash Flow
- -$1,610
- Cap Rate
- 3.1%
- Cash-on-Cash Return
- -14.0%
- Debt Coverage Ratio
- 0.49
- Internal Rate of Return (5 years)
- -9.5%
Cash Flow
Net Operating Income (NOI) minus mortgage payments.
Calculation:
NOI - Mortgage Payments
Cap Rate (Market Value)
Capitalization Rate is a rate of return that compares the yearly Net Operating Income (NOI) to the market value.
Calculation:
NOI / Market Value
Cash-on-Cash Return (CoC)
Annual Cash Flow / Cash Invested
Calculation:
Annual cash flow divided by initial cash invested.
Debt Coverage Ratio (DCR)
Net Operating Income (NOI) divided by total debt payments.
Calculation:
NOI / Total Debt Payments
Internal Rate of Return (IRR)
A metric for assessing profitability over time. IRR is the discount rate at which the net present value (NPV) of all future cash flows (positive and negative) from an investment equals zero — including both periodic cash flow (such as rent) and a projected sale at the end of the holding period. It represents the expected annualized return, accounting for income, expenses, and the recovery of capital through a future sale.
Purchase Details
Purchase PriceThe price paid for the property. Purchase price:
| $599,900 |
|---|---|
Amount FinancedThe amount of the purchase financed through a loan. Amount financed:
| -$479,920 |
Down paymentThe initial payment made towards the purchase. Down payment:
| $119,980 |
Closing CostsFees and expenses associated with purchasing a property, typically ranging from 2% to 5% of the home’s purchase price, paid at the end of a home purchase to cover services like lending, title transfer, and taxes. Closing costs:
| $17,997 |
Rehab CostsCosts incurred to repair or improve the property, including: roof, flooring, exterior siding, kitchen, exterior paint, bathrooms, etc. Rehab costs:
| $0 |
Initial Cash InvestedThe total initial cash invested in the property. Calculation:Down payment + Buying costs + Rehab costs Initial cash invested:
| $137,977 |
Square Feet (SQFT)The total square footage of the property. Square feet:
| 2,747 |
Cost Per Square FootCost per square foot of the property. Calculation:Purchase Price / Square Feet Cost per square foot:
| $218 |
Monthly Rent Per Square FootMonthly rent divided by the number of square feet. This ratio helps investors compare rental income efficiency across properties, markets, and unit sizes Calculation:Monthly Rent / Square Feet Monthly rent per square foot:
| $1.06 |
Financing Details
Loan AmountThe total sum of money borrowed from a lender to finance a property purchase. Calculation:Purchase Price - Down Payment
Loan amount:
| $479,920 |
|---|---|
Loan to Value Ratio (LTV)Loan amount divided by the market value of the property. Calculation:Loan Amount / Market Value
Loan to value ratio:
| 80.0% |
Loan TypeThe type of loan (e.g., fixed, adjustable).
Loan type:
| Amortizing |
TermThe loan repayment period in years.
Term:
| 30 years |
Interest RateThe percentage a lender charges on the borrowed amount of a loan, determining the cost of borrowing money.
Interest rate:
| 6.840% |
Principal & Interest (PI)The principal is the portion of the loan payment that reduces the loan balance. The interest is the lender's charge for borrowing money. Calculation:(P * r * (1 + r) ** n) / ((1 + r) ** n - 1) Where:
P = Loan amount (principal)
Principal & interest:
| $3,142 |
Property TaxesAnnual taxes levied by local governments on real estate properties. These taxes fund public services like schools, roads, and emergency services.
Property tax:
| $294 |
InsuranceThe costs for insurance coverage to protect against financial losses due to risks like fire, natural disasters, theft, liability, or tenant-related damages. Calculation:Assumes 7% of gross rental income, unless insurance rates are specified.
Insurance:
| $203 |
Private Mortgage Insurance (PMI)A fee that borrowers pay when they take out a conventional loan with a loan-to-value (LTV) ratio above 80%.
Private mortgage insurance (PMI):
| $0 |
Monthly PaymentThe fixed amount a borrower pays each month to repay a loan. It typically includes principal and interest (P&I) and may also cover property taxes, insurance, HOA fees, and PMI if escrowed. Monthly payment:
| $3,639 |
Operating Income
| % Rent | Monthly | Yearly | |
|---|---|---|---|
Gross RentThe total rental income received from tenants before deducting any expenses. Includes base rent, late fees, pet fees, parking fees, and other recurring charges.
Gross rent:
| $2,900 | $34,800 | |
Vacancy LossExpected loss of rent due to vacancies.
Vacancy loss:
(6%)
| 6% | -$174 | -$2,088 |
Operating IncomeGross rental income minus vacancy loss. Calculation:Gross rent - Vacancy loss
Operating income:
| $2,726 | $32,712 |
Operating Expenses
| % Rent | Monthly | Yearly | |
|---|---|---|---|
Property TaxesAnnual taxes levied by local governments on real estate properties. These taxes fund public services like schools, roads, and emergency services. | 10% | -$294 | -$3,523 |
InsuranceThe costs for insurance coverage to protect against financial losses due to risks like fire, natural disasters, theft, liability, or tenant-related damages. Calculation:Assumes 7% of gross rental income, unless insurance rates are specified. | 7% | -$203 | -$2,436 |
Property ManagementThe costs associated with hiring a property manager to handle the day-to-day operations of a rental property. Includes management fees, leasing fes, eviction fees, etc. Calculation:Assumes 8% of gross rental income. | 8% | -$232 | -$2,784 |
Repairs & MaintenanceOngoing costs for routine upkeep and minor fixes needed to keep a property in good working condition. Calculation:Assumes 5% of gross rental income. Varies by property age and condition. | 5% | -$145 | -$1,740 |
Capital ExpensesLarge, infrequent costs for major improvements or replacements, like a new roof, HVAC system, or appliances. Calculation:Assumes 5% of gross rental income. Varies by property age. | 5% | -$145 | -$1,740 |
HOA FeesRegular dues paid to a Homeowners Association for community maintenance, amenities, and management. Similar fees include: Condo Association Fees, Co-op Maintenance Fees, etc. | 6% | -$175 | -$2,100 |
Operating ExpensesRecurring costs required to maintain and manage a rental property, including property taxes, insurance, maintenance, repairs, utilities (if paid by the owner), property management fees, and other day-to-day expenses. Calculation:Insurance + Property Taxes + Property Management + Repairs & Maintenance + Capital Expenditures + HOA Fees | 41% | -$1,194 | -$14,323 |
Cash Flow
| Monthly | Yearly | |
|---|---|---|
Net Operating Income (NOI)The income generated from a property after deducting all operating expenses but before deducting mortgage payments, taxes, and capital expenditures. Calculation:Gross Operating Income - Operating Expenses
Net operating income:
| $1,532 | $18,384 |
Mortgage PaymentThe fixed amount a borrower pays each month to repay a loan. It typically includes principal and interest (P&I) and may also cover property taxes, insurance, HOA fees, and PMI if escrowed. | -$3,142 | -$37,704 |
Cash FlowNet Operating Income (NOI) minus mortgage payments. Calculation:NOI - Mortgage Payments | $1,610 | $19,320 |