$699,000
Investment Summary
- Monthly Cash Flow
- -$1,255
- Cap Rate
- 3.9%
- Cash-on-Cash Return
- -9.4%
- Debt Coverage Ratio
- 0.64
- Internal Rate of Return (5 years)
- -5.1%
Cash Flow
Net Operating Income (NOI) minus mortgage payments.
Calculation:
NOI - Mortgage Payments
Cap Rate (Market Value)
Capitalization Rate is a rate of return that compares the yearly Net Operating Income (NOI) to the market value.
Calculation:
NOI / Market Value
Cash-on-Cash Return (CoC)
Annual Cash Flow / Cash Invested
Calculation:
Annual cash flow divided by initial cash invested.
Debt Coverage Ratio (DCR)
Net Operating Income (NOI) divided by total debt payments.
Calculation:
NOI / Total Debt Payments
Internal Rate of Return (IRR)
A metric for assessing profitability over time. IRR is the discount rate at which the net present value (NPV) of all future cash flows (positive and negative) from an investment equals zero — including both periodic cash flow (such as rent) and a projected sale at the end of the holding period. It represents the expected annualized return, accounting for income, expenses, and the recovery of capital through a future sale.
Property Description
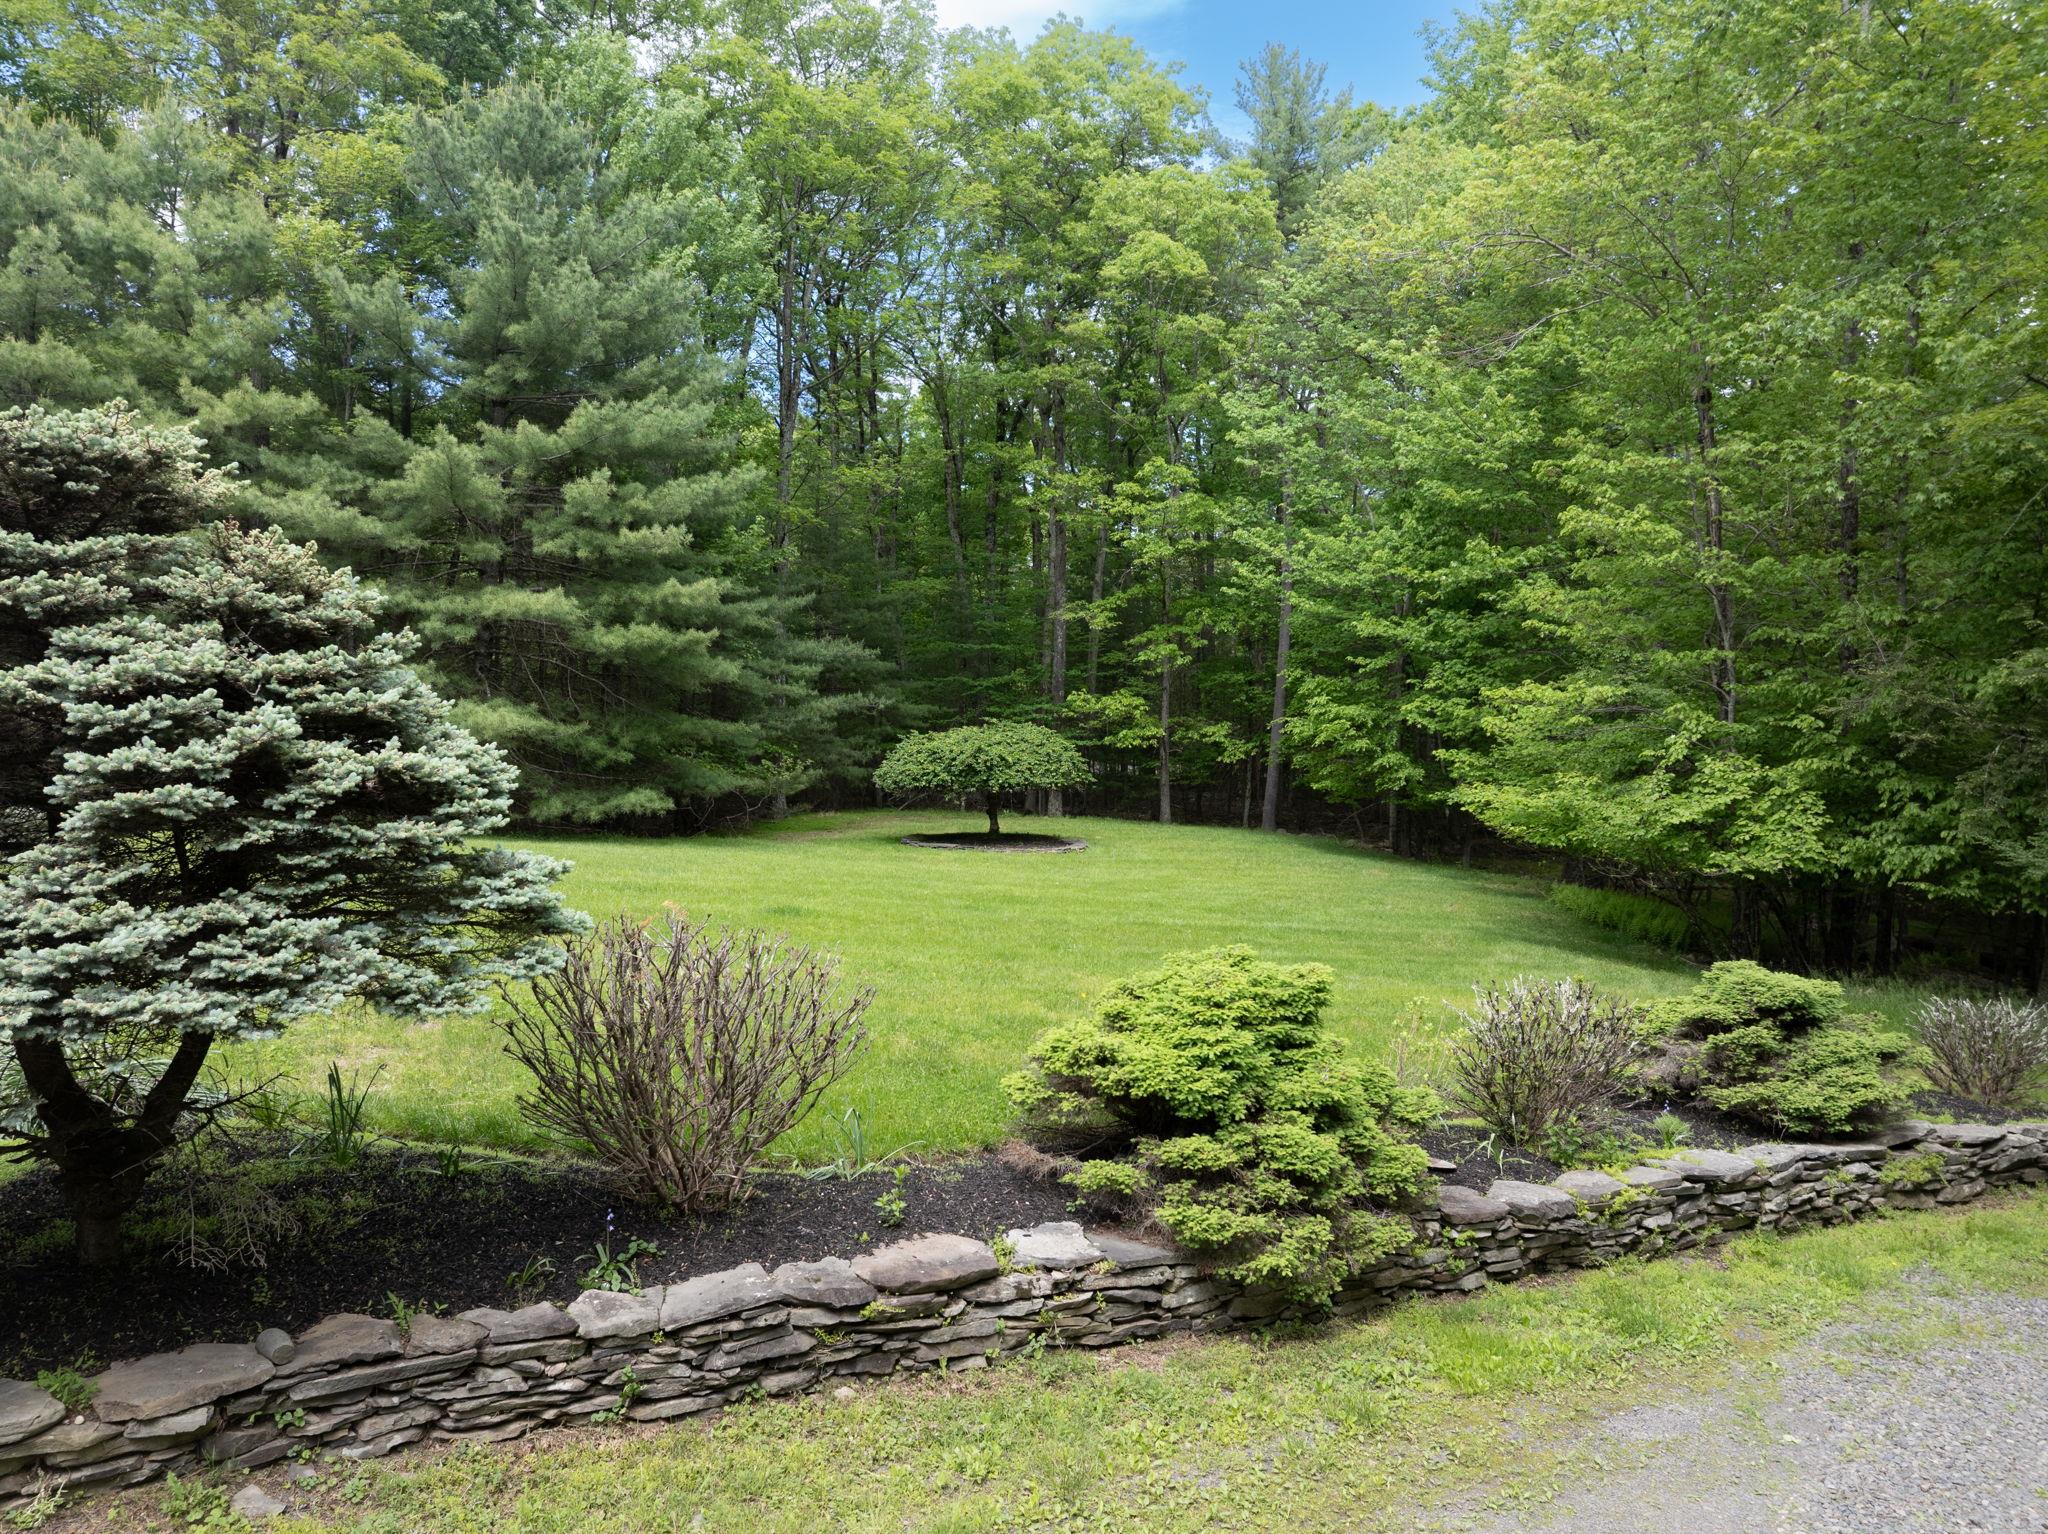
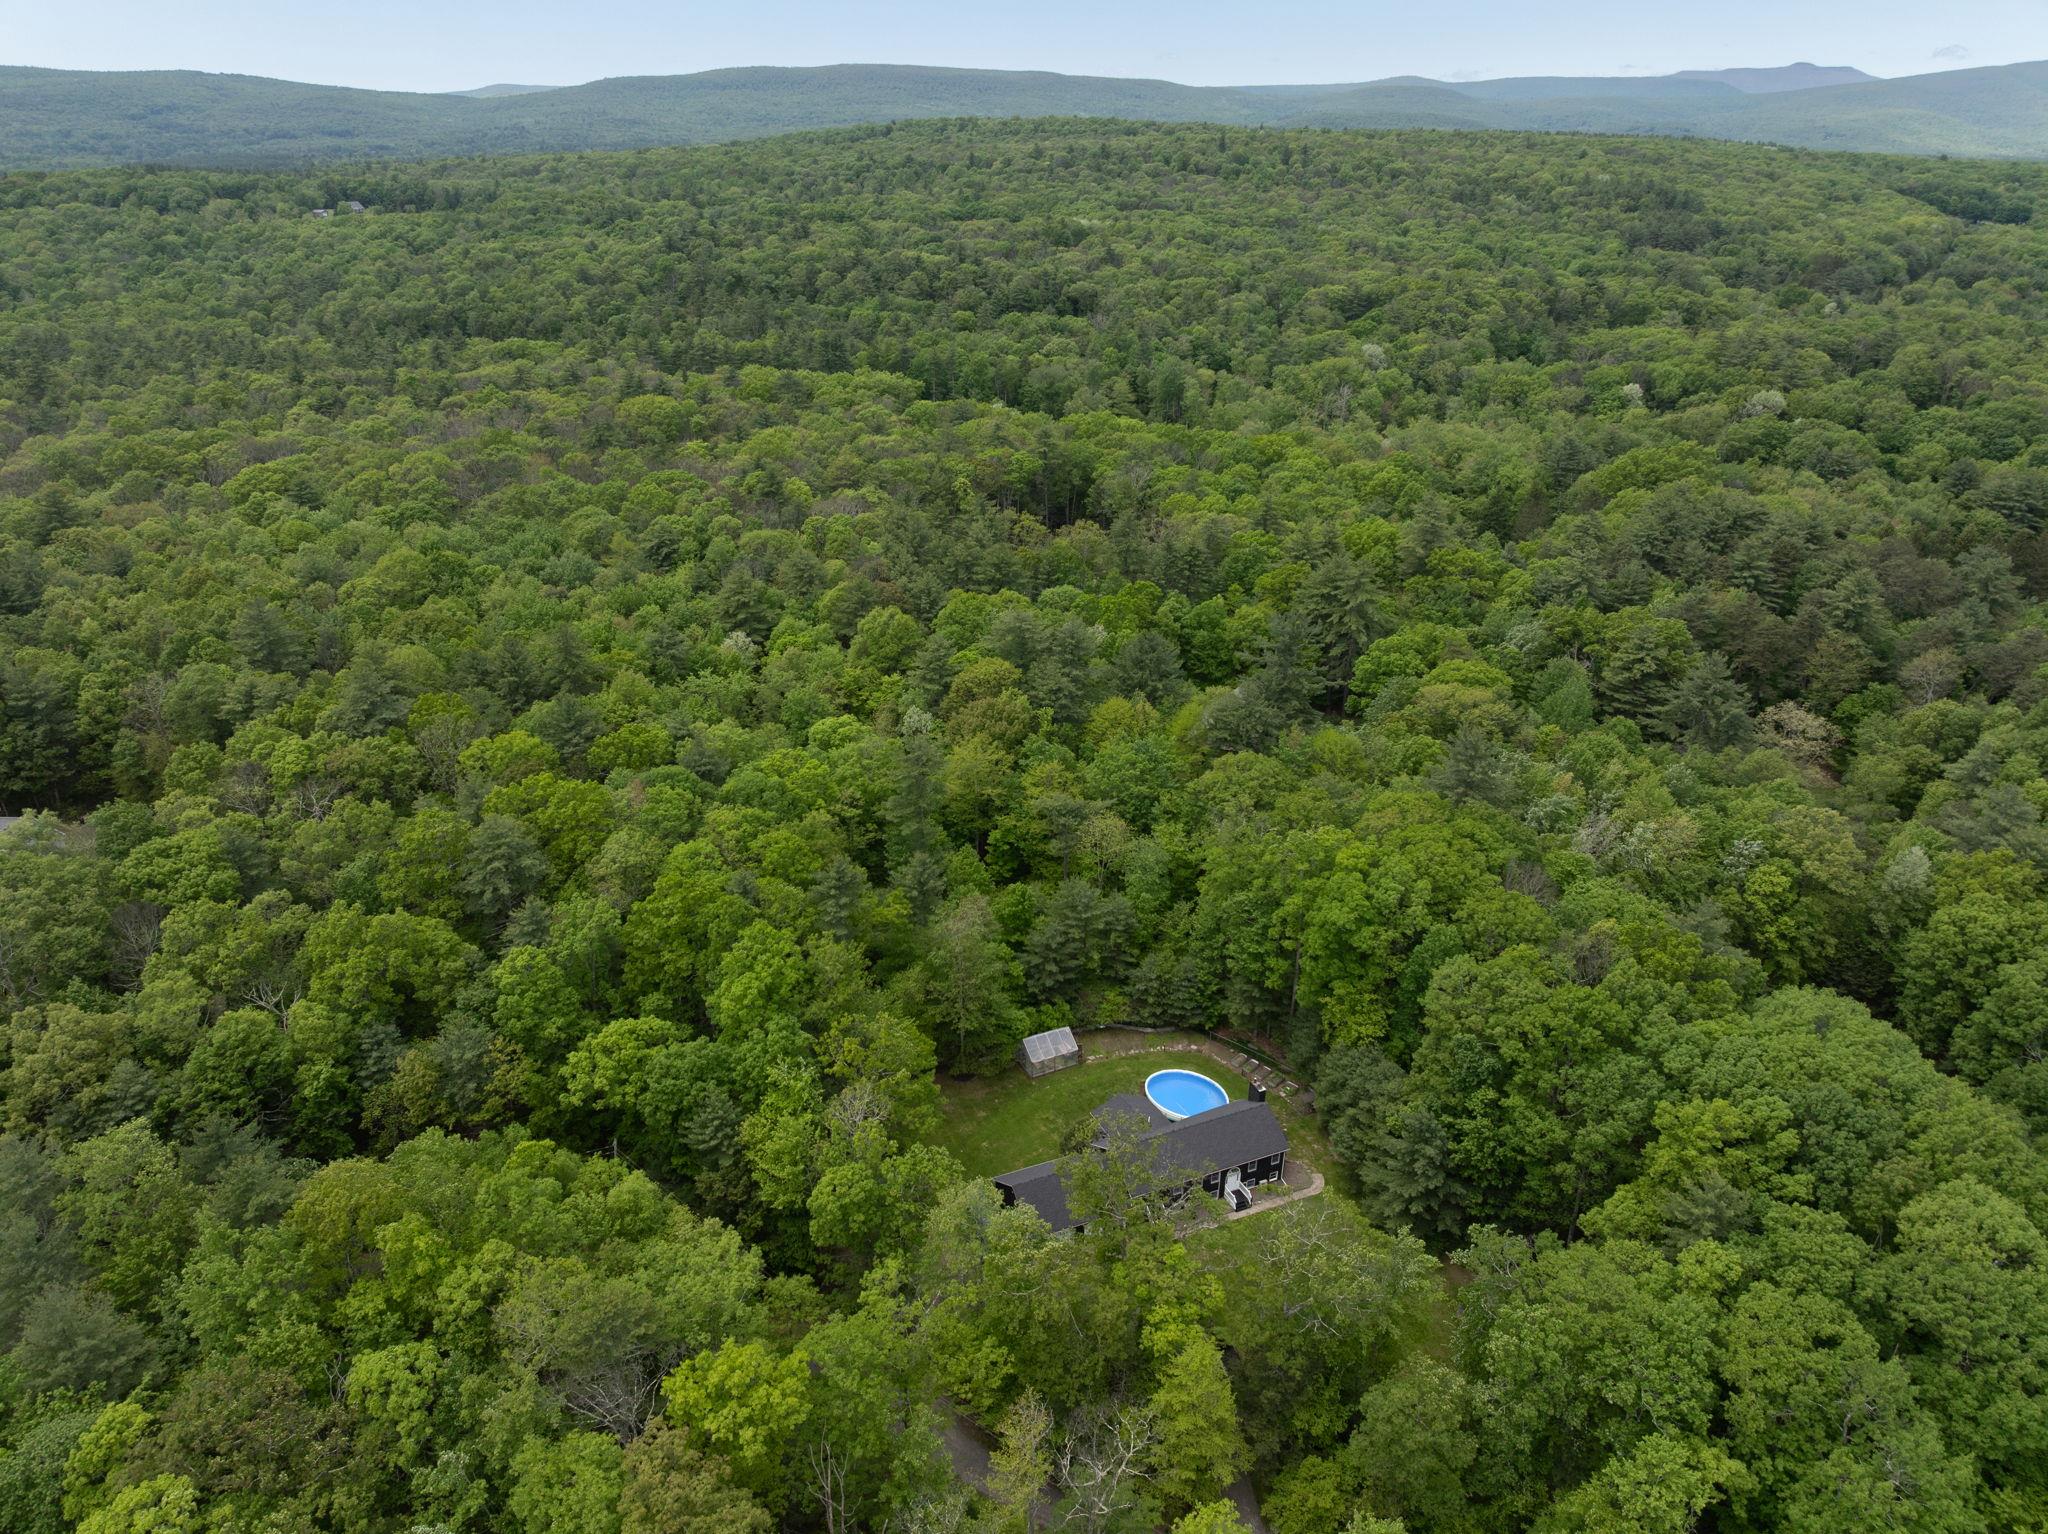
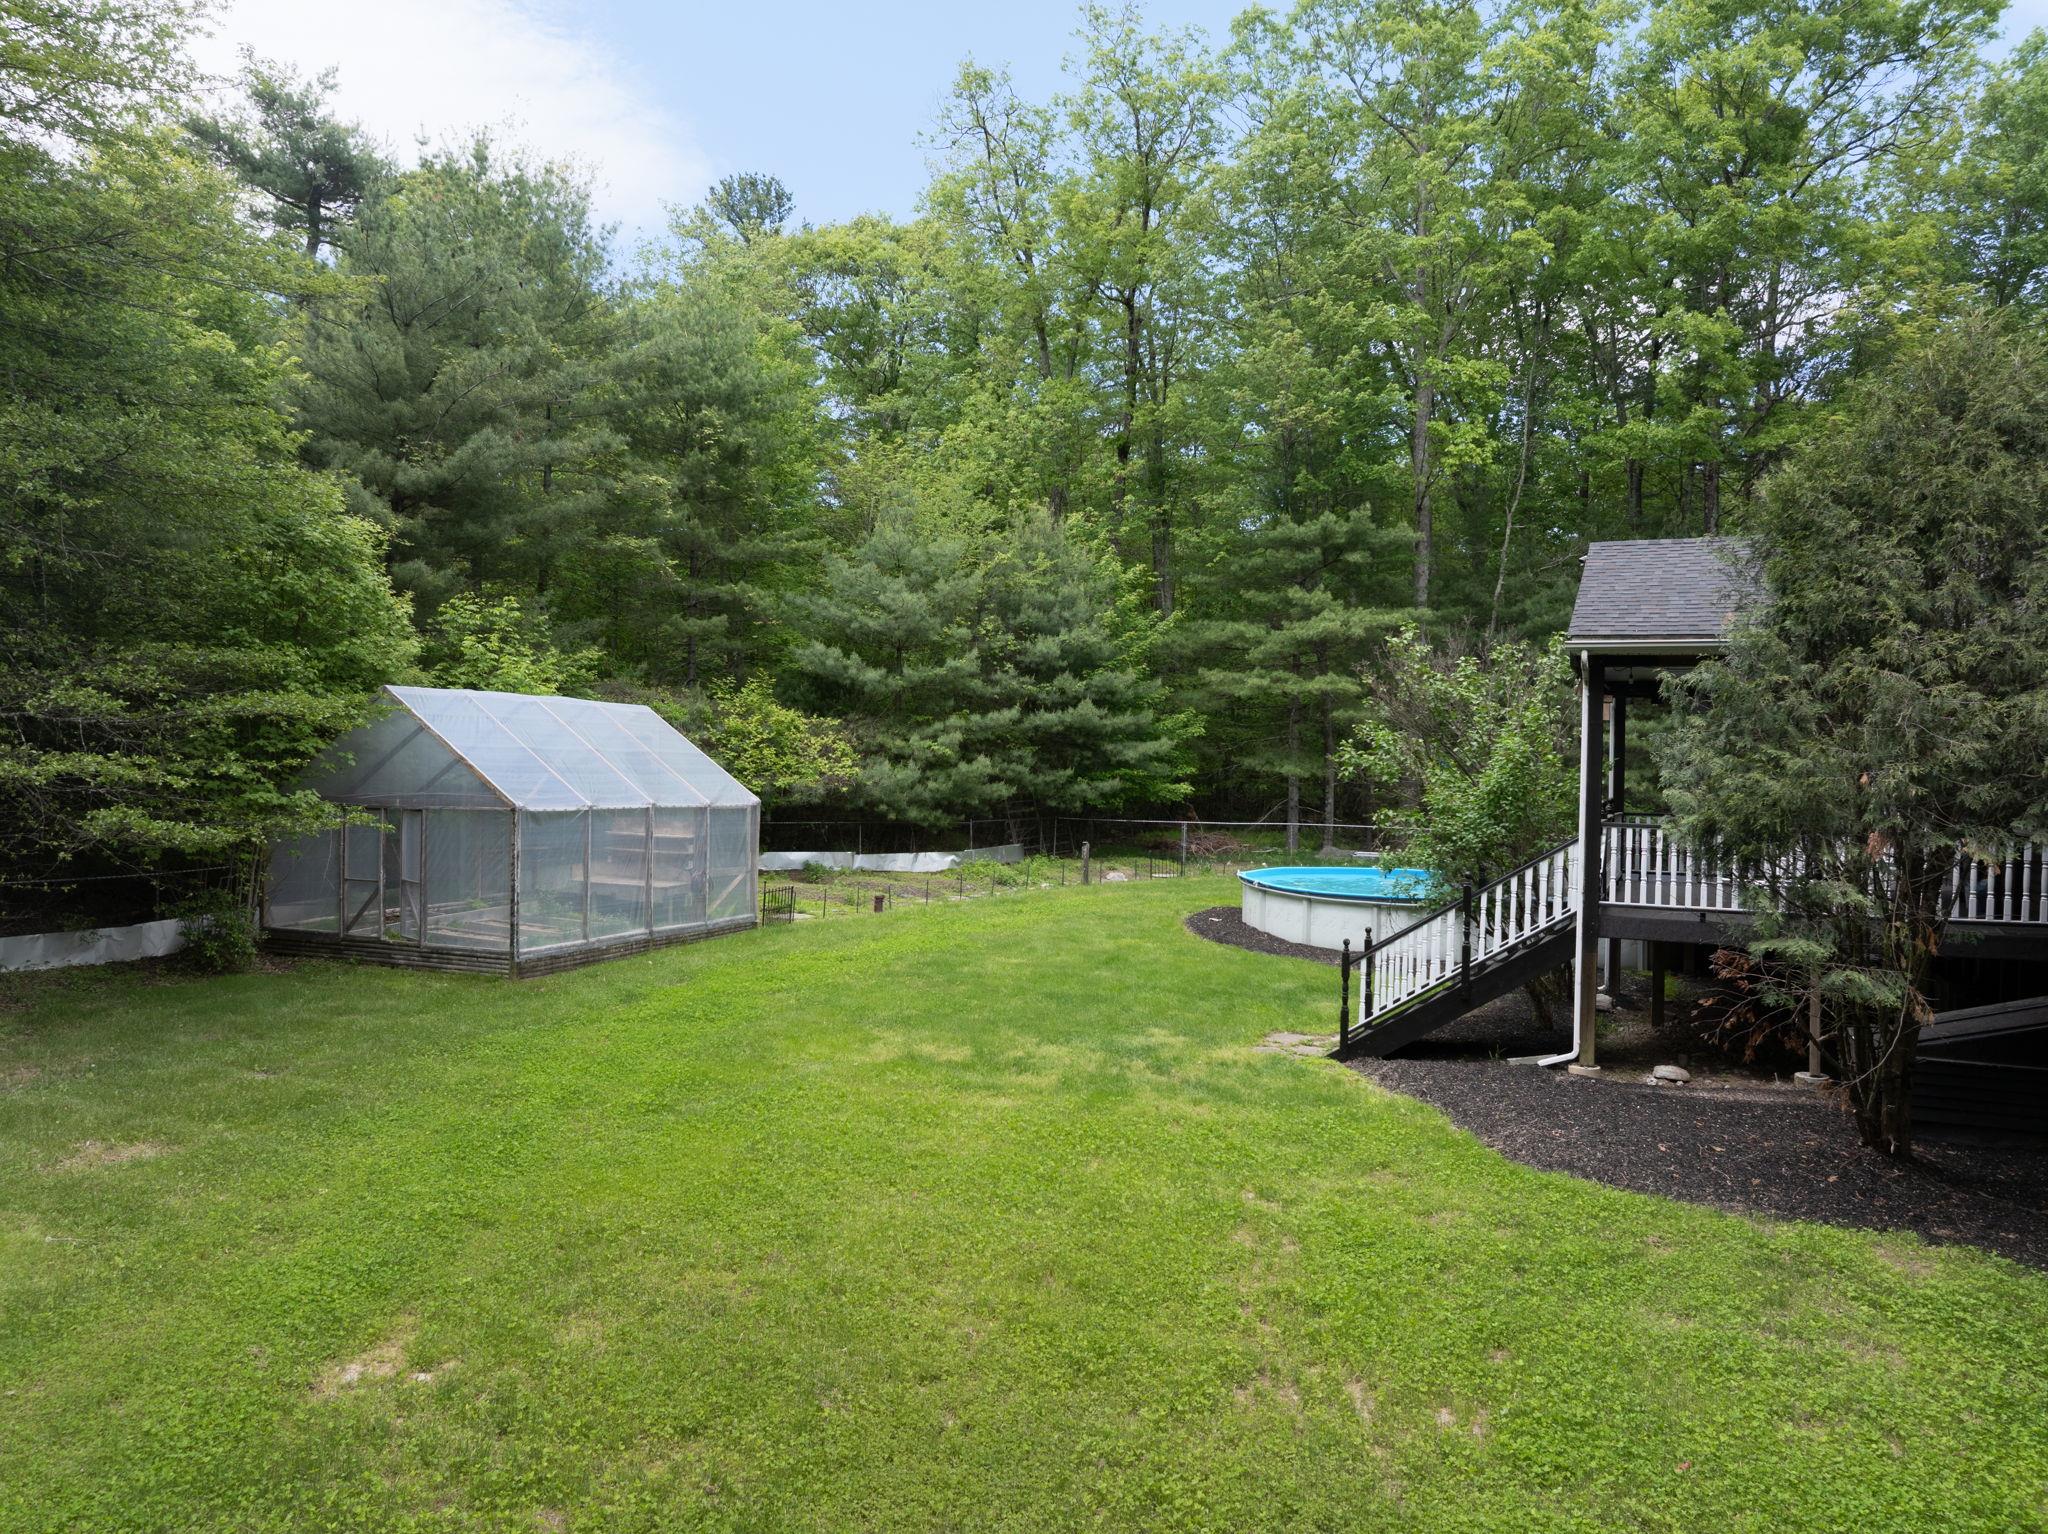
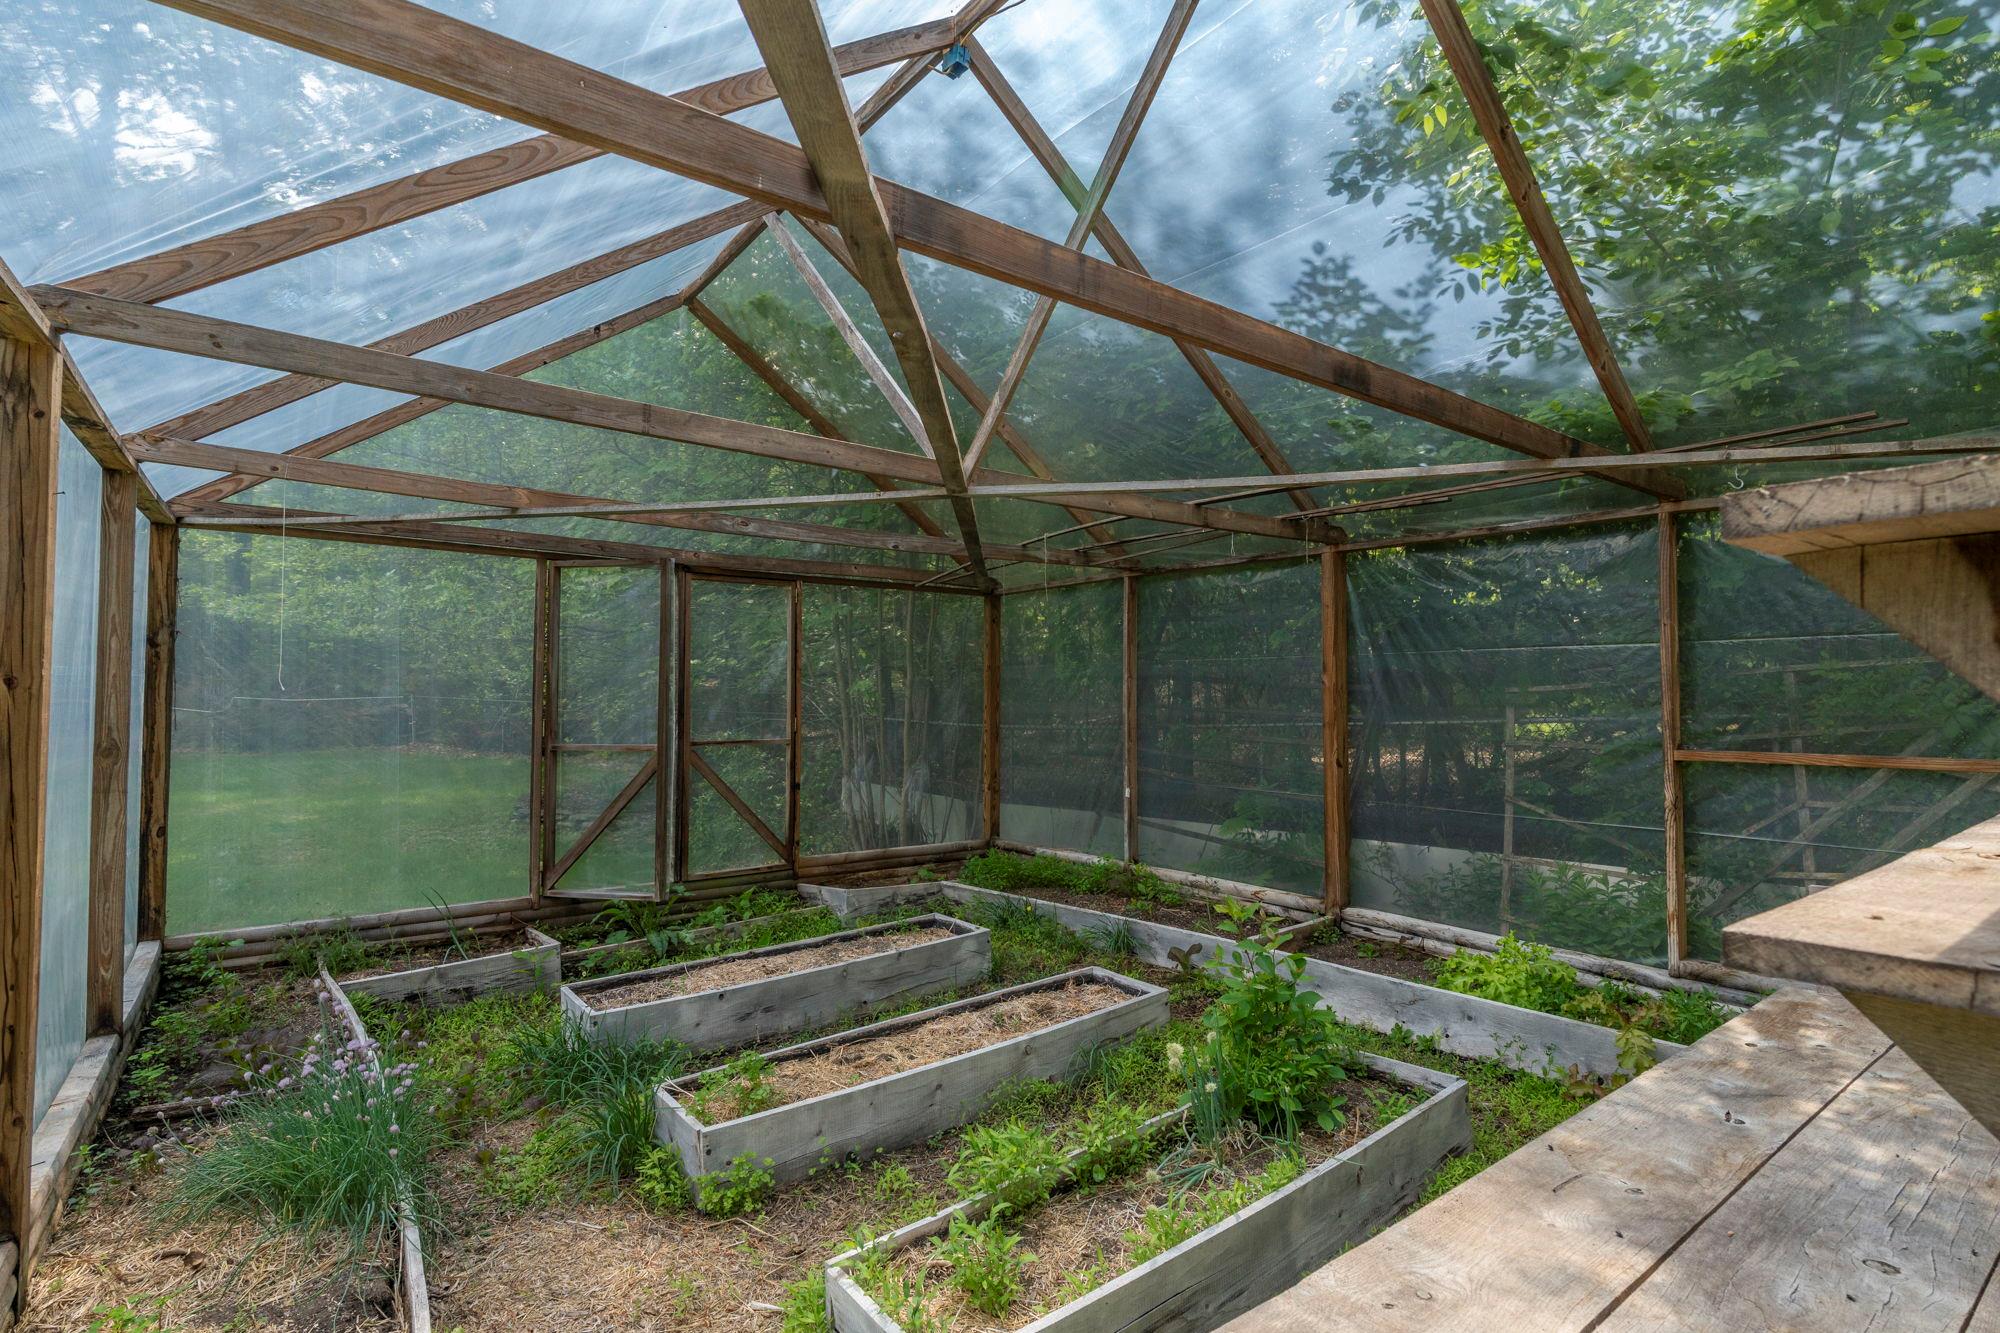
Nestled on a serene country road, this turnkey, beautifully maintained home offers exceptional comfort, privacy, diverse living spaces, and a host of modern updates – ideal for relaxed living. As you approach the circular driveway, you’re greeted by a sprawling front lawn, mature trees, and meticulously landscaped grounds that perfectly frame the property. Soak in the sights and sounds of summer from the front porch, which leads into the spacious and functional mudroom. Thoughtfully designed with built-in benches and ample storage, this entry point provides seamless access to the oversized, heated two-car garage, the main living space, and the backyard. The recently renovated kitchen shines with stainless steel appliances including a new LG refrigerator and Bosch dishwasher, stone countertops, and tiled backsplash. The centrally located dining area overlooks the inviting pool and lush grounds beyond, creating a stunning backdrop for everyday meals and special occasions with friends and loved ones. A renovated half bath is conveniently located between the mudroom and kitchen for added ease. The comfortable living room features a wood-burning fireplace as well as a pellet stove, offering dual options for supplemental warmth during colder months. Enjoy peaceful mornings bathed in sunlight as you gaze out at the picturesque cherry tree in the front yard. The main-level primary bedroom offers privacy and convenience, complete with an updated en-suite bathroom. Downstairs, two additional bedrooms share a full bath with tub and shower. A dedicated laundry room with a new washer, a spacious den with direct yard access, and an additional room – perfect for gaming, hobbies, or guests – enhance the home's flexibility. A separate utility room houses the well-maintained boiler and mechanical systems. Green thumbs will delight in the newly wrapped greenhouse and raised garden beds, while the fully fenced backyard ensures peace of mind for pet owners. In warmer months, enjoy al fresco dining under the canopy on the rear deck. Need more space? The unfinished loft above the garage presents many possibilities: a guest suite, large home office, media room, or accessory apartment. Park your RV, boat, or other recreational equipment in the covered tent adjacent to the garage. Thoughtful recent upgrades include six high-efficiency mini-splits for year-round climate control (heat+ac), a level two electric vehicle charger, whole house perimeter drainage system, a four-year young roof, and so much more. Enjoy all the area has to offer year-round, including endless hiking options at the Mohonk Preserve, local beer, cider, and dining at Arrowood Farms, Westwind orchard, Mill & Main, Wildflower, as well as luxury membership amenities found at Inness including golf, tennis, swimming, fine dining, and lodging. Not to mention all the conveniences of nearby Stone Ridge, Woodstock, Kingston, Rosendale, and New Paltz – less than a two hour drive from the George Washington Bridge.
Build Your Team
Quickly find investor-friendly professionals who can help you succeed in real estate investing at any stage of the investing journey.


Agents
Match with investor-friendly agents who can help you find, analyze, and close your next deal


Lenders
Get the best funding…find investor-friendly lenders who specialize in your deal strategy


Property Managers
Transition to passive investing. Find a trusted property management partnership that lasts.


Tax Pros & Accountants
Taxes and financial reporting made easy—find experts to create tax savings strategies, file taxes, and more
Location
Property Details
Parking
- Description: Attached Garage
- Garage Spaces: 2
- Spaces Total: 0
Bedroom Information
- # of Bedrooms: 3
Bathroom Information
- # of Baths (Full): 2
- # of Baths (Partial): 1
- # of Baths (Total): 3.0
Interior Features
- # of Rooms: 8
- # of Stories: 1
- Basement: Yes
- Basement Description: Finished, Full, Walk-Out Access
- Fireplace: Yes
Exterior Features
- Exterior Walls Materials: Siding (Alum/Vinyl)
- Pool: Yes
Land Information
- Land Use: Residential
- Land Use Subtype: Single Family Residential
Lot Information
- Parcel ID: 51440068.132
- Lot Size: 114563 sqft
Property Information
- Property Type: Single Family Residence
- Style: Raised Ranch
- Year Built: 1998
Tax Information
- Annual Tax: $9,070
Utilities
- Water & Sewer: Private, Well
- Heating: Baseboard, Heat Pump, Hot Water, Oil, See Remarks, Wood
- Cooling: Ductless
Location
- County: Ulster
Listing Details
Investment Summary
- Monthly Cash Flow
- -$1,255
- Cap Rate
- 3.9%
- Cash-on-Cash Return
- -9.4%
- Debt Coverage Ratio
- 0.64
- Internal Rate of Return (5 years)
- -5.1%
Cash Flow
Net Operating Income (NOI) minus mortgage payments.
Calculation:
NOI - Mortgage Payments
Cap Rate (Market Value)
Capitalization Rate is a rate of return that compares the yearly Net Operating Income (NOI) to the market value.
Calculation:
NOI / Market Value
Cash-on-Cash Return (CoC)
Annual Cash Flow / Cash Invested
Calculation:
Annual cash flow divided by initial cash invested.
Debt Coverage Ratio (DCR)
Net Operating Income (NOI) divided by total debt payments.
Calculation:
NOI / Total Debt Payments
Internal Rate of Return (IRR)
A metric for assessing profitability over time. IRR is the discount rate at which the net present value (NPV) of all future cash flows (positive and negative) from an investment equals zero — including both periodic cash flow (such as rent) and a projected sale at the end of the holding period. It represents the expected annualized return, accounting for income, expenses, and the recovery of capital through a future sale.
Purchase Details
Purchase PriceThe price paid for the property. Purchase price:
| $699,000 |
|---|---|
Amount FinancedThe amount of the purchase financed through a loan. Amount financed:
| -$559,200 |
Down paymentThe initial payment made towards the purchase. Down payment:
| $139,800 |
Closing CostsFees and expenses associated with purchasing a property, typically ranging from 2% to 5% of the home’s purchase price, paid at the end of a home purchase to cover services like lending, title transfer, and taxes. Closing costs:
| $20,970 |
Rehab CostsCosts incurred to repair or improve the property, including: roof, flooring, exterior siding, kitchen, exterior paint, bathrooms, etc. Rehab costs:
| $0 |
Initial Cash InvestedThe total initial cash invested in the property. Calculation:Down payment + Buying costs + Rehab costs Initial cash invested:
| $160,770 |
Square Feet (SQFT)The total square footage of the property. Square feet:
| 2,848 |
Cost Per Square FootCost per square foot of the property. Calculation:Purchase Price / Square Feet Cost per square foot:
| $245 |
Monthly Rent Per Square FootMonthly rent divided by the number of square feet. This ratio helps investors compare rental income efficiency across properties, markets, and unit sizes Calculation:Monthly Rent / Square Feet Monthly rent per square foot:
| $1.54 |
Financing Details
Loan AmountThe total sum of money borrowed from a lender to finance a property purchase. Calculation:Purchase Price - Down Payment
Loan amount:
| $559,200 |
|---|---|
Loan to Value Ratio (LTV)Loan amount divided by the market value of the property. Calculation:Loan Amount / Market Value
Loan to value ratio:
| 80.0% |
Loan TypeThe type of loan (e.g., fixed, adjustable).
Loan type:
| Amortizing |
TermThe loan repayment period in years.
Term:
| 30 years |
Interest RateThe percentage a lender charges on the borrowed amount of a loan, determining the cost of borrowing money.
Interest rate:
| 6.500% |
Principal & Interest (PI)The principal is the portion of the loan payment that reduces the loan balance. The interest is the lender's charge for borrowing money. Calculation:(P * r * (1 + r) ** n) / ((1 + r) ** n - 1) Where:
P = Loan amount (principal)
Principal & interest:
| $3,535 |
Property TaxesAnnual taxes levied by local governments on real estate properties. These taxes fund public services like schools, roads, and emergency services.
Property tax:
| $756 |
InsuranceThe costs for insurance coverage to protect against financial losses due to risks like fire, natural disasters, theft, liability, or tenant-related damages. Calculation:Assumes 7% of gross rental income, unless insurance rates are specified.
Insurance:
| $308 |
Private Mortgage Insurance (PMI)A fee that borrowers pay when they take out a conventional loan with a loan-to-value (LTV) ratio above 80%.
Private mortgage insurance (PMI):
| $0 |
Monthly PaymentThe fixed amount a borrower pays each month to repay a loan. It typically includes principal and interest (P&I) and may also cover property taxes, insurance, HOA fees, and PMI if escrowed. Monthly payment:
| $4,599 |
Operating Income
| % Rent | Monthly | Yearly | |
|---|---|---|---|
Gross RentThe total rental income received from tenants before deducting any expenses. Includes base rent, late fees, pet fees, parking fees, and other recurring charges.
Gross rent:
| $4,400 | $52,800 | |
Vacancy LossExpected loss of rent due to vacancies.
Vacancy loss:
(6%)
| 6% | -$264 | -$3,168 |
Operating IncomeGross rental income minus vacancy loss. Calculation:Gross rent - Vacancy loss
Operating income:
| $4,136 | $49,632 |
Operating Expenses
| % Rent | Monthly | Yearly | |
|---|---|---|---|
Property TaxesAnnual taxes levied by local governments on real estate properties. These taxes fund public services like schools, roads, and emergency services. | 17% | -$756 | -$9,070 |
InsuranceThe costs for insurance coverage to protect against financial losses due to risks like fire, natural disasters, theft, liability, or tenant-related damages. Calculation:Assumes 7% of gross rental income, unless insurance rates are specified. | 7% | -$308 | -$3,696 |
Property ManagementThe costs associated with hiring a property manager to handle the day-to-day operations of a rental property. Includes management fees, leasing fes, eviction fees, etc. Calculation:Assumes 8% of gross rental income. | 8% | -$352 | -$4,224 |
Repairs & MaintenanceOngoing costs for routine upkeep and minor fixes needed to keep a property in good working condition. Calculation:Assumes 5% of gross rental income. Varies by property age and condition. | 5% | -$220 | -$2,640 |
Capital ExpensesLarge, infrequent costs for major improvements or replacements, like a new roof, HVAC system, or appliances. Calculation:Assumes 5% of gross rental income. Varies by property age. | 5% | -$220 | -$2,640 |
HOA FeesRegular dues paid to a Homeowners Association for community maintenance, amenities, and management. Similar fees include: Condo Association Fees, Co-op Maintenance Fees, etc. | n/a | n/a | n/a |
Operating ExpensesRecurring costs required to maintain and manage a rental property, including property taxes, insurance, maintenance, repairs, utilities (if paid by the owner), property management fees, and other day-to-day expenses. Calculation:Insurance + Property Taxes + Property Management + Repairs & Maintenance + Capital Expenditures + HOA Fees | 42% | -$1,856 | -$22,270 |
Cash Flow
| Monthly | Yearly | |
|---|---|---|
Net Operating Income (NOI)The income generated from a property after deducting all operating expenses but before deducting mortgage payments, taxes, and capital expenditures. Calculation:Gross Operating Income - Operating Expenses
Net operating income:
| $2,280 | $27,360 |
Mortgage PaymentThe fixed amount a borrower pays each month to repay a loan. It typically includes principal and interest (P&I) and may also cover property taxes, insurance, HOA fees, and PMI if escrowed. | -$3,535 | -$42,420 |
Cash FlowNet Operating Income (NOI) minus mortgage payments. Calculation:NOI - Mortgage Payments | $1,255 | $15,060 |