
$450,000
Investment Summary
- Monthly Cash Flow
- -$30
- Cap Rate
- 6.2%
- Cash-on-Cash Return
- -0.3%
- Debt Coverage Ratio
- 0.99
- Internal Rate of Return (5 years)
- 3.7%
Cash Flow
Net Operating Income (NOI) minus mortgage payments.
Calculation:
NOI - Mortgage Payments
Cap Rate (Market Value)
Capitalization Rate is a rate of return that compares the yearly Net Operating Income (NOI) to the market value.
Calculation:
NOI / Market Value
Cash-on-Cash Return (CoC)
Annual Cash Flow / Cash Invested
Calculation:
Annual cash flow divided by initial cash invested.
Debt Coverage Ratio (DCR)
Net Operating Income (NOI) divided by total debt payments.
Calculation:
NOI / Total Debt Payments
Internal Rate of Return (IRR)
A metric for assessing profitability over time. IRR is the discount rate at which the net present value (NPV) of all future cash flows (positive and negative) from an investment equals zero — including both periodic cash flow (such as rent) and a projected sale at the end of the holding period. It represents the expected annualized return, accounting for income, expenses, and the recovery of capital through a future sale.
Property Description
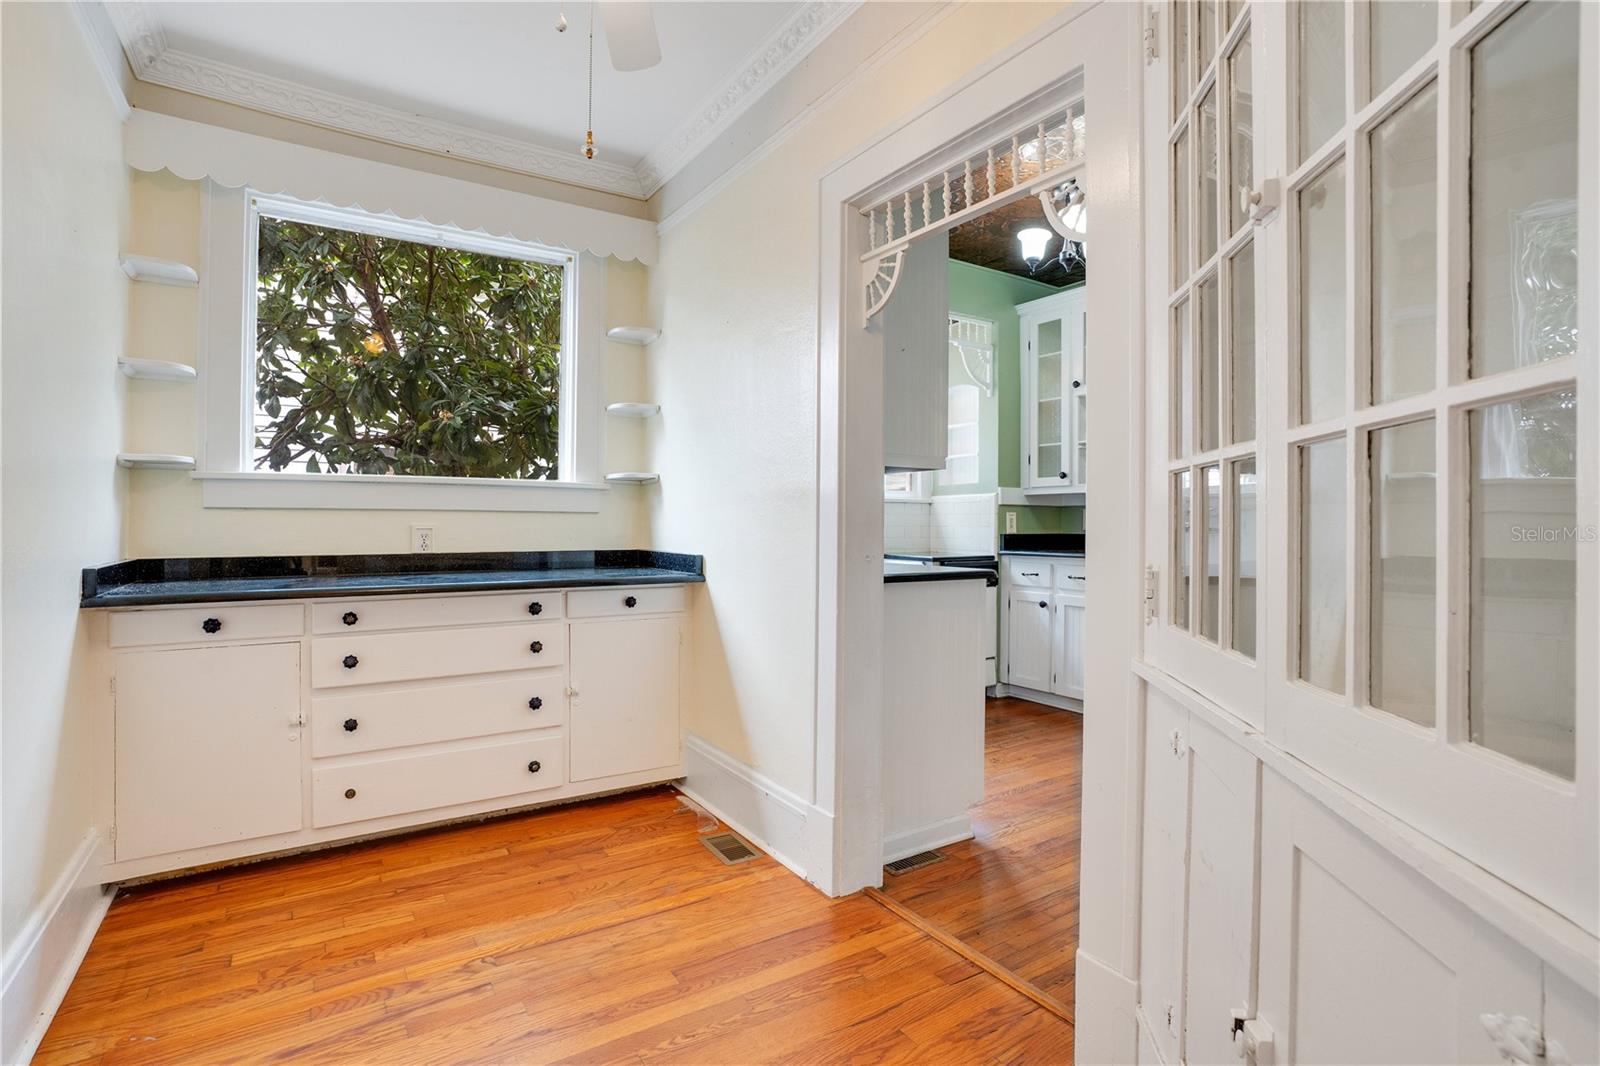
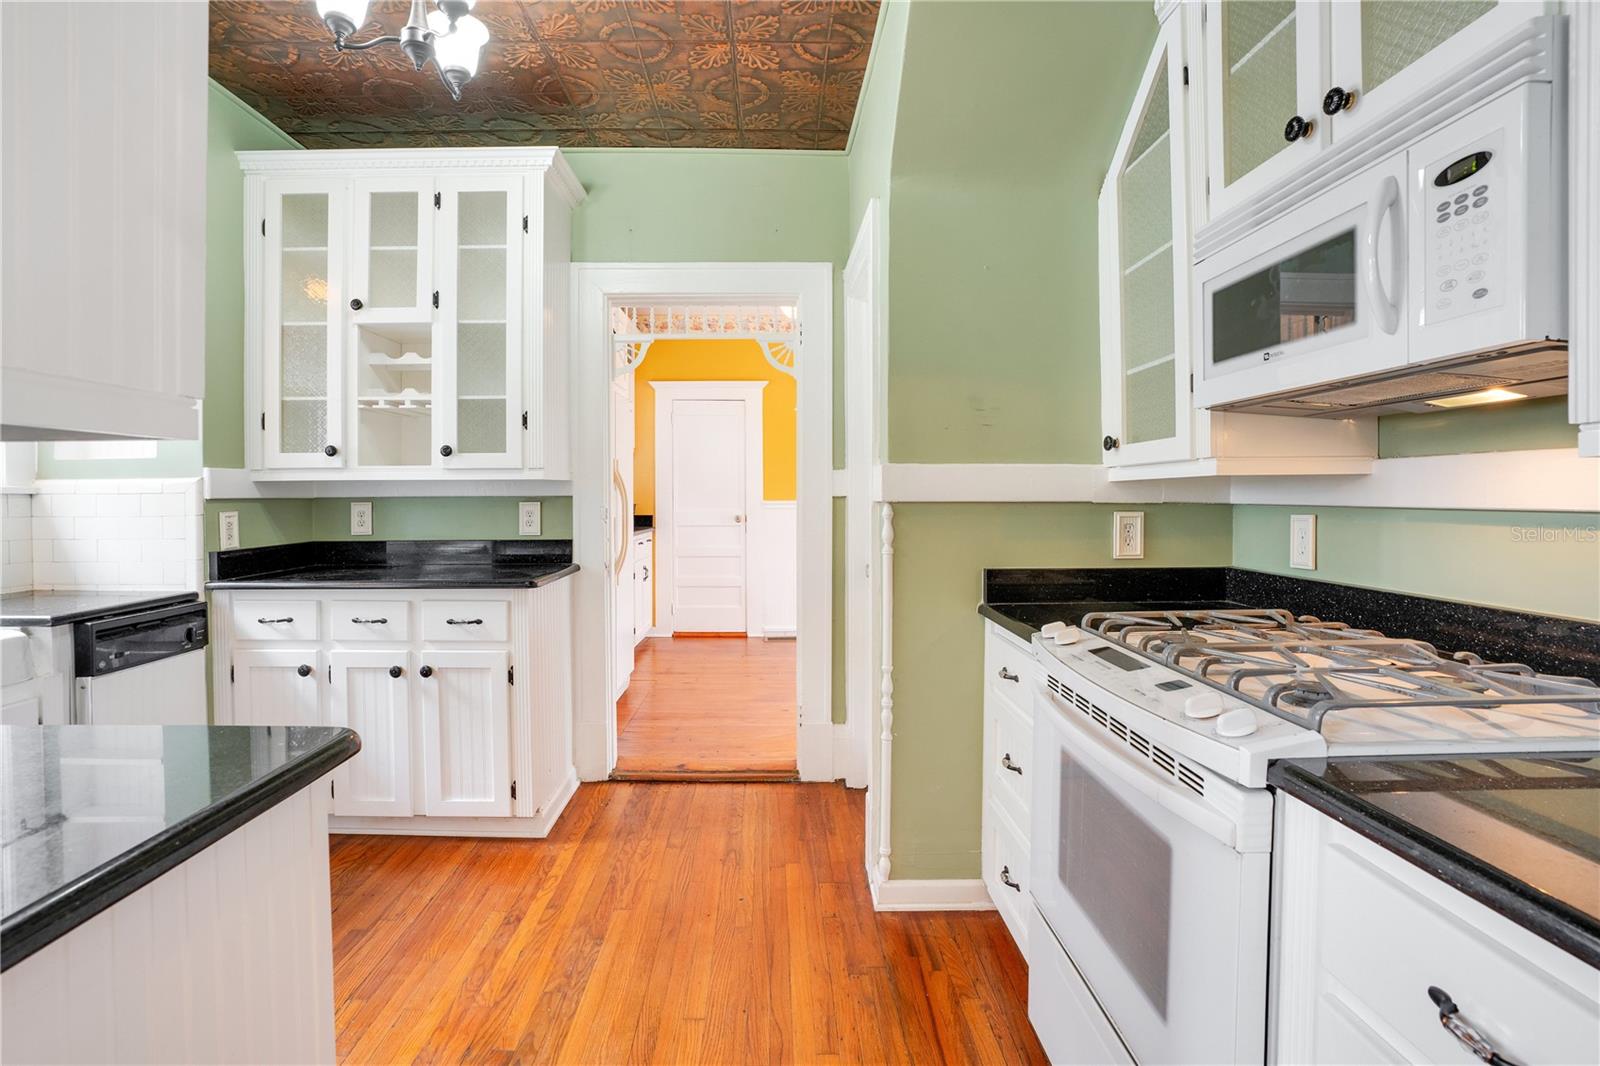
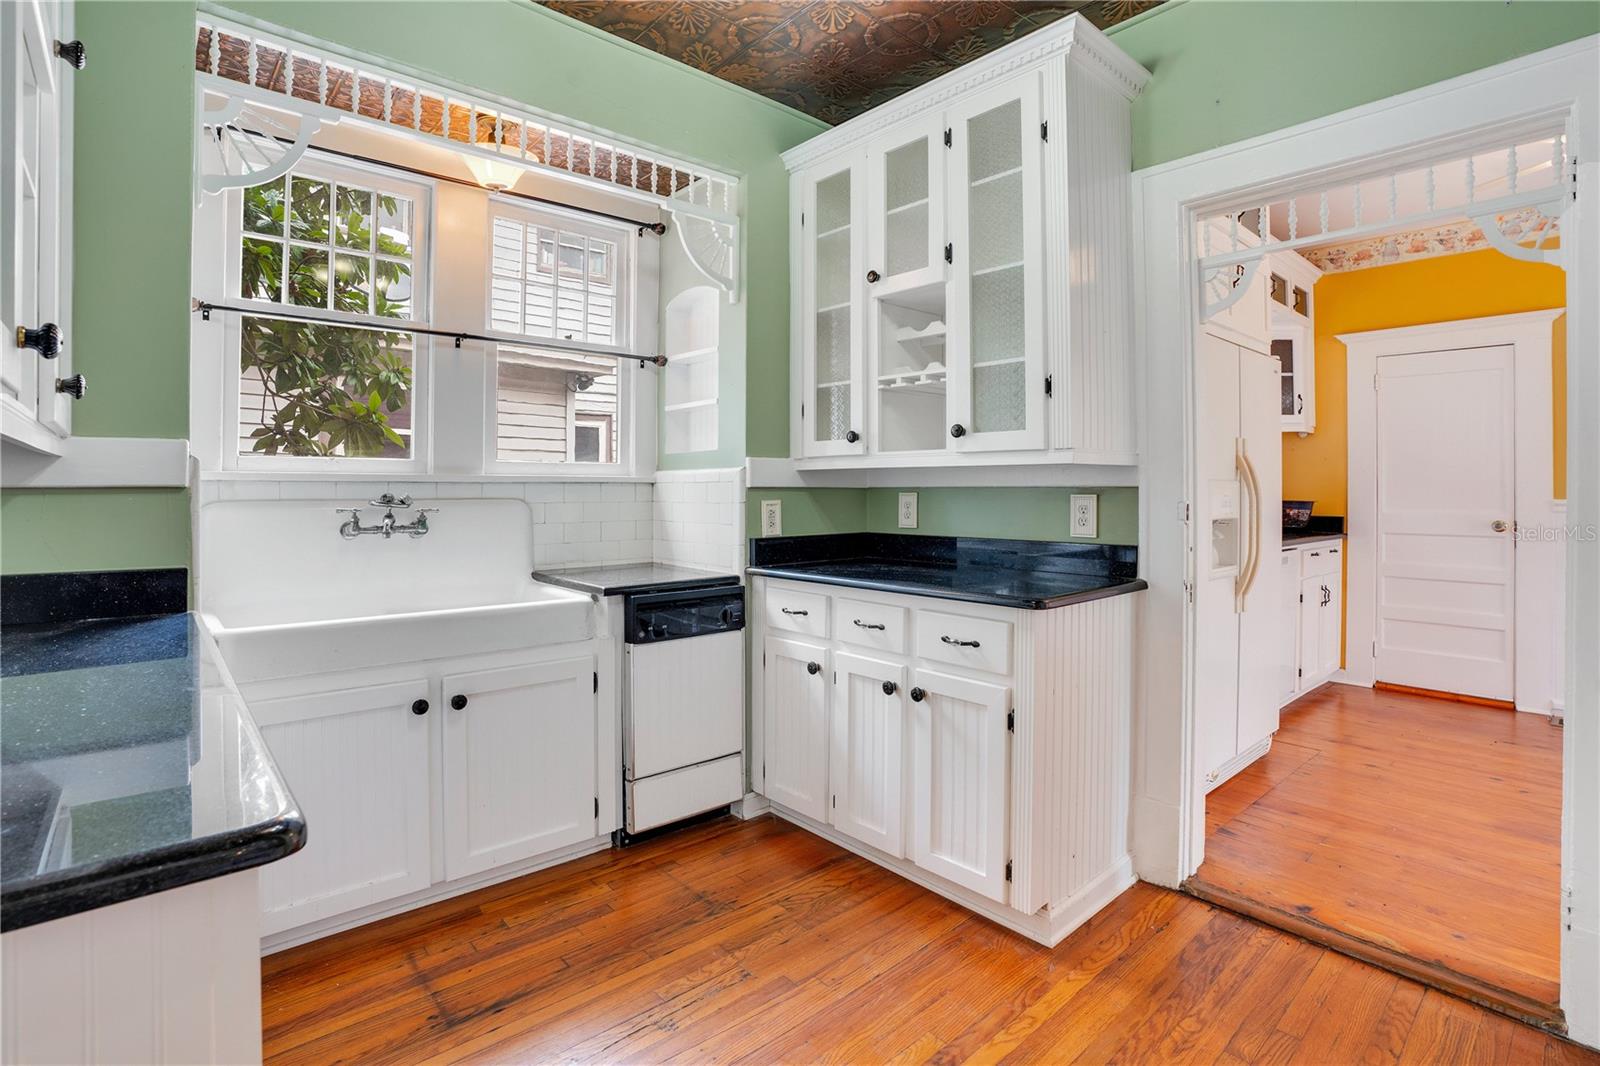
Introducing 1217 Magnolia Avenue! A remarkable Colonial Revival residence located in the highly desirable Sanford Historic District within Sanford's vibrant, lively downtown. Built-in 1923 by MS Wiggins, this residence was designed to enhance natural light. It showcases a significant number of windows throughout, ensuring each room feels bright and airy. The current owner's deep affection for this home is evident, having preserved its original features over the last 18 years, which highlights its lasting beauty and charm. . . . . The inviting brick front porch leads you inside, where a spacious living room awaits, with elegant hardwood floors, a cozy fireplace, and built-in shelving. The office, separated by the original 35-lite pocket door, is an ideal space for productivity. Adjacent to the office, the sunroom/studio provides a serene environment for quiet moments while enjoying views of the gardens through the many windows. . . . . The bright, sunny formal dining room features beautiful wood flooring and original built-ins. A convenient swinging door connects to the butler's pantry. It leads into the kitchen, equipped with custom wood cabinets, granite countertops, the original kitchen sink, two sizable pantries, a delightful breakfast nook, and a full bathroom. Imagine sipping your morning coffee while taking in views of the patio and gardens, accessible through both the sunroom and breakfast area. . . . . On the second floor, you'll find three ample-sized bedrooms, an additional full bathroom, and an attractive in-law suite featuring a sitting area, kitchen, full bath, and generous living space—perfect for guests or potential rental income. The private entrance to the apartment could also be restored as per the owner's preference, making this an option for additional income. . . . . The fully fenced yard ensures privacy and security, providing a welcoming and tranquil environment. The gardens are just waiting for you to enhance and make them your own. The laundry area, which is under air, and the workshop are conveniently placed within the one-car garage. This property presents incredible opportunities for customization. . . . As this exceptional home is also located in the Golf Cart District, you can easily hop on your golf cart and head downtown to explore all that Sanford has to offer, including restaurants, breweries, art galleries, shopping, and a variety of local events. . . . . Key points to note include: the roof was replaced in 2018, air conditioning was updated in 2018, the water heater was installed in 2022, the first floor electric panel replaced, and any plumbing updates were done in the kitchen and laundry areas as they were being updated. Additionally, a termite bond is in place, giving prospective buyers peace of mind. Sanford is conveniently located to shopping, the Sanford International Airport, the 417 and I-4 which will take you to the Theme Parks, Orlando International Airport and the beaches. . . . . This is an outstanding opportunity to own a fabulous home that truly captures the essence of the Sanford Historic District. Contact me for a showing today!
Build Your Team
Quickly find investor-friendly professionals who can help you succeed in real estate investing at any stage of the investing journey.


Agents
Match with investor-friendly agents who can help you find, analyze, and close your next deal


Lenders
Get the best funding…find investor-friendly lenders who specialize in your deal strategy


Property Managers
Transition to passive investing. Find a trusted property management partnership that lasts.


Tax Pros & Accountants
Taxes and financial reporting made easy—find experts to create tax savings strategies, file taxes, and more
Location
Property Details
Parking
- Description: Alley Access, Garage Faces Rear, On Street, Workshop in Garage
- Details: Alley Access, Garage Faces Rear, On Street, Workshop in Garage, Attached
- Garage Spaces: 1
- Spaces Total: 0
Bedroom Information
- # of Bedrooms: 4
Bathroom Information
- # of Baths (Full): 3
- # of Baths (Total): 3.0
Interior Features
- # of Rooms: 15
- # of Stories: 2
- Basement Description: Crawl Space
- Fireplace: Yes
Exterior Features
- Exterior Walls Materials: Siding (not specified)
- Foundation: Slab
- Roof Type: Gable
- Roof Material: Shingle
Land Information
- Land Use: Residential
- Land Use Subtype: Single Family Residential
Lot Information
- Parcel ID: 2519305AG1402009A
- Lot Size: 7020 sqft
Property Information
- Property Type: Single Family Residence
- Style: Colonial, Historic
- Year Built: 1925
Tax Information
- Annual Tax: $1,983
Utilities
- Water & Sewer: Public
- Heating: Natural Gas
- Cooling: Central Air
Location
- County: Seminole
Listing Details
Investment Summary
- Monthly Cash Flow
- -$30
- Cap Rate
- 6.2%
- Cash-on-Cash Return
- -0.3%
- Debt Coverage Ratio
- 0.99
- Internal Rate of Return (5 years)
- 3.7%
Cash Flow
Net Operating Income (NOI) minus mortgage payments.
Calculation:
NOI - Mortgage Payments
Cap Rate (Market Value)
Capitalization Rate is a rate of return that compares the yearly Net Operating Income (NOI) to the market value.
Calculation:
NOI / Market Value
Cash-on-Cash Return (CoC)
Annual Cash Flow / Cash Invested
Calculation:
Annual cash flow divided by initial cash invested.
Debt Coverage Ratio (DCR)
Net Operating Income (NOI) divided by total debt payments.
Calculation:
NOI / Total Debt Payments
Internal Rate of Return (IRR)
A metric for assessing profitability over time. IRR is the discount rate at which the net present value (NPV) of all future cash flows (positive and negative) from an investment equals zero — including both periodic cash flow (such as rent) and a projected sale at the end of the holding period. It represents the expected annualized return, accounting for income, expenses, and the recovery of capital through a future sale.
Purchase Details
Purchase PriceThe price paid for the property. Purchase price:
| $450,000 |
|---|---|
Amount FinancedThe amount of the purchase financed through a loan. Amount financed:
| -$360,000 |
Down paymentThe initial payment made towards the purchase. Down payment:
| $90,000 |
Closing CostsFees and expenses associated with purchasing a property, typically ranging from 2% to 5% of the home’s purchase price, paid at the end of a home purchase to cover services like lending, title transfer, and taxes. Closing costs:
| $13,500 |
Rehab CostsCosts incurred to repair or improve the property, including: roof, flooring, exterior siding, kitchen, exterior paint, bathrooms, etc. Rehab costs:
| $0 |
Initial Cash InvestedThe total initial cash invested in the property. Calculation:Down payment + Buying costs + Rehab costs Initial cash invested:
| $103,500 |
Square Feet (SQFT)The total square footage of the property. Square feet:
| 2,904 |
Cost Per Square FootCost per square foot of the property. Calculation:Purchase Price / Square Feet Cost per square foot:
| $155 |
Monthly Rent Per Square FootMonthly rent divided by the number of square feet. This ratio helps investors compare rental income efficiency across properties, markets, and unit sizes Calculation:Monthly Rent / Square Feet Monthly rent per square foot:
| $1.24 |
Financing Details
Loan AmountThe total sum of money borrowed from a lender to finance a property purchase. Calculation:Purchase Price - Down Payment
Loan amount:
| $360,000 |
|---|---|
Loan to Value Ratio (LTV)Loan amount divided by the market value of the property. Calculation:Loan Amount / Market Value
Loan to value ratio:
| 80.0% |
Loan TypeThe type of loan (e.g., fixed, adjustable).
Loan type:
| Amortizing |
TermThe loan repayment period in years.
Term:
| 30 years |
Interest RateThe percentage a lender charges on the borrowed amount of a loan, determining the cost of borrowing money.
Interest rate:
| 6.810% |
Principal & Interest (PI)The principal is the portion of the loan payment that reduces the loan balance. The interest is the lender's charge for borrowing money. Calculation:(P * r * (1 + r) ** n) / ((1 + r) ** n - 1) Where:
P = Loan amount (principal)
Principal & interest:
| $2,349 |
Property TaxesAnnual taxes levied by local governments on real estate properties. These taxes fund public services like schools, roads, and emergency services.
Property tax:
| $165 |
InsuranceThe costs for insurance coverage to protect against financial losses due to risks like fire, natural disasters, theft, liability, or tenant-related damages. Calculation:Assumes 7% of gross rental income, unless insurance rates are specified.
Insurance:
| $252 |
Private Mortgage Insurance (PMI)A fee that borrowers pay when they take out a conventional loan with a loan-to-value (LTV) ratio above 80%.
Private mortgage insurance (PMI):
| $0 |
Monthly PaymentThe fixed amount a borrower pays each month to repay a loan. It typically includes principal and interest (P&I) and may also cover property taxes, insurance, HOA fees, and PMI if escrowed. Monthly payment:
| $2,766 |
Operating Income
| % Rent | Monthly | Yearly | |
|---|---|---|---|
Gross RentThe total rental income received from tenants before deducting any expenses. Includes base rent, late fees, pet fees, parking fees, and other recurring charges.
Gross rent:
| $3,600 | $43,200 | |
Vacancy LossExpected loss of rent due to vacancies.
Vacancy loss:
(6%)
| 6% | -$216 | -$2,592 |
Operating IncomeGross rental income minus vacancy loss. Calculation:Gross rent - Vacancy loss
Operating income:
| $3,384 | $40,608 |
Operating Expenses
| % Rent | Monthly | Yearly | |
|---|---|---|---|
Property TaxesAnnual taxes levied by local governments on real estate properties. These taxes fund public services like schools, roads, and emergency services. | 5% | -$165 | -$1,983 |
InsuranceThe costs for insurance coverage to protect against financial losses due to risks like fire, natural disasters, theft, liability, or tenant-related damages. Calculation:Assumes 7% of gross rental income, unless insurance rates are specified. | 7% | -$252 | -$3,024 |
Property ManagementThe costs associated with hiring a property manager to handle the day-to-day operations of a rental property. Includes management fees, leasing fes, eviction fees, etc. Calculation:Assumes 8% of gross rental income. | 8% | -$288 | -$3,456 |
Repairs & MaintenanceOngoing costs for routine upkeep and minor fixes needed to keep a property in good working condition. Calculation:Assumes 5% of gross rental income. Varies by property age and condition. | 5% | -$180 | -$2,160 |
Capital ExpensesLarge, infrequent costs for major improvements or replacements, like a new roof, HVAC system, or appliances. Calculation:Assumes 5% of gross rental income. Varies by property age. | 5% | -$180 | -$2,160 |
HOA FeesRegular dues paid to a Homeowners Association for community maintenance, amenities, and management. Similar fees include: Condo Association Fees, Co-op Maintenance Fees, etc. | n/a | n/a | n/a |
Operating ExpensesRecurring costs required to maintain and manage a rental property, including property taxes, insurance, maintenance, repairs, utilities (if paid by the owner), property management fees, and other day-to-day expenses. Calculation:Insurance + Property Taxes + Property Management + Repairs & Maintenance + Capital Expenditures + HOA Fees | 30% | -$1,065 | -$12,783 |
Cash Flow
| Monthly | Yearly | |
|---|---|---|
Net Operating Income (NOI)The income generated from a property after deducting all operating expenses but before deducting mortgage payments, taxes, and capital expenditures. Calculation:Gross Operating Income - Operating Expenses
Net operating income:
| $2,319 | $27,828 |
Mortgage PaymentThe fixed amount a borrower pays each month to repay a loan. It typically includes principal and interest (P&I) and may also cover property taxes, insurance, HOA fees, and PMI if escrowed. | -$2,349 | -$28,188 |
Cash FlowNet Operating Income (NOI) minus mortgage payments. Calculation:NOI - Mortgage Payments | $30 | $360 |