
$990,000
Investment Summary
- Monthly Cash Flow
- -$1,877
- Cap Rate
- 3.9%
- Cash-on-Cash Return
- -9.9%
- Debt Coverage Ratio
- 0.63
- Internal Rate of Return (5 years)
- -5.6%
Cash Flow
Net Operating Income (NOI) minus mortgage payments.
Calculation:
NOI - Mortgage Payments
Cap Rate (Market Value)
Capitalization Rate is a rate of return that compares the yearly Net Operating Income (NOI) to the market value.
Calculation:
NOI / Market Value
Cash-on-Cash Return (CoC)
Annual Cash Flow / Cash Invested
Calculation:
Annual cash flow divided by initial cash invested.
Debt Coverage Ratio (DCR)
Net Operating Income (NOI) divided by total debt payments.
Calculation:
NOI / Total Debt Payments
Internal Rate of Return (IRR)
A metric for assessing profitability over time. IRR is the discount rate at which the net present value (NPV) of all future cash flows (positive and negative) from an investment equals zero — including both periodic cash flow (such as rent) and a projected sale at the end of the holding period. It represents the expected annualized return, accounting for income, expenses, and the recovery of capital through a future sale.
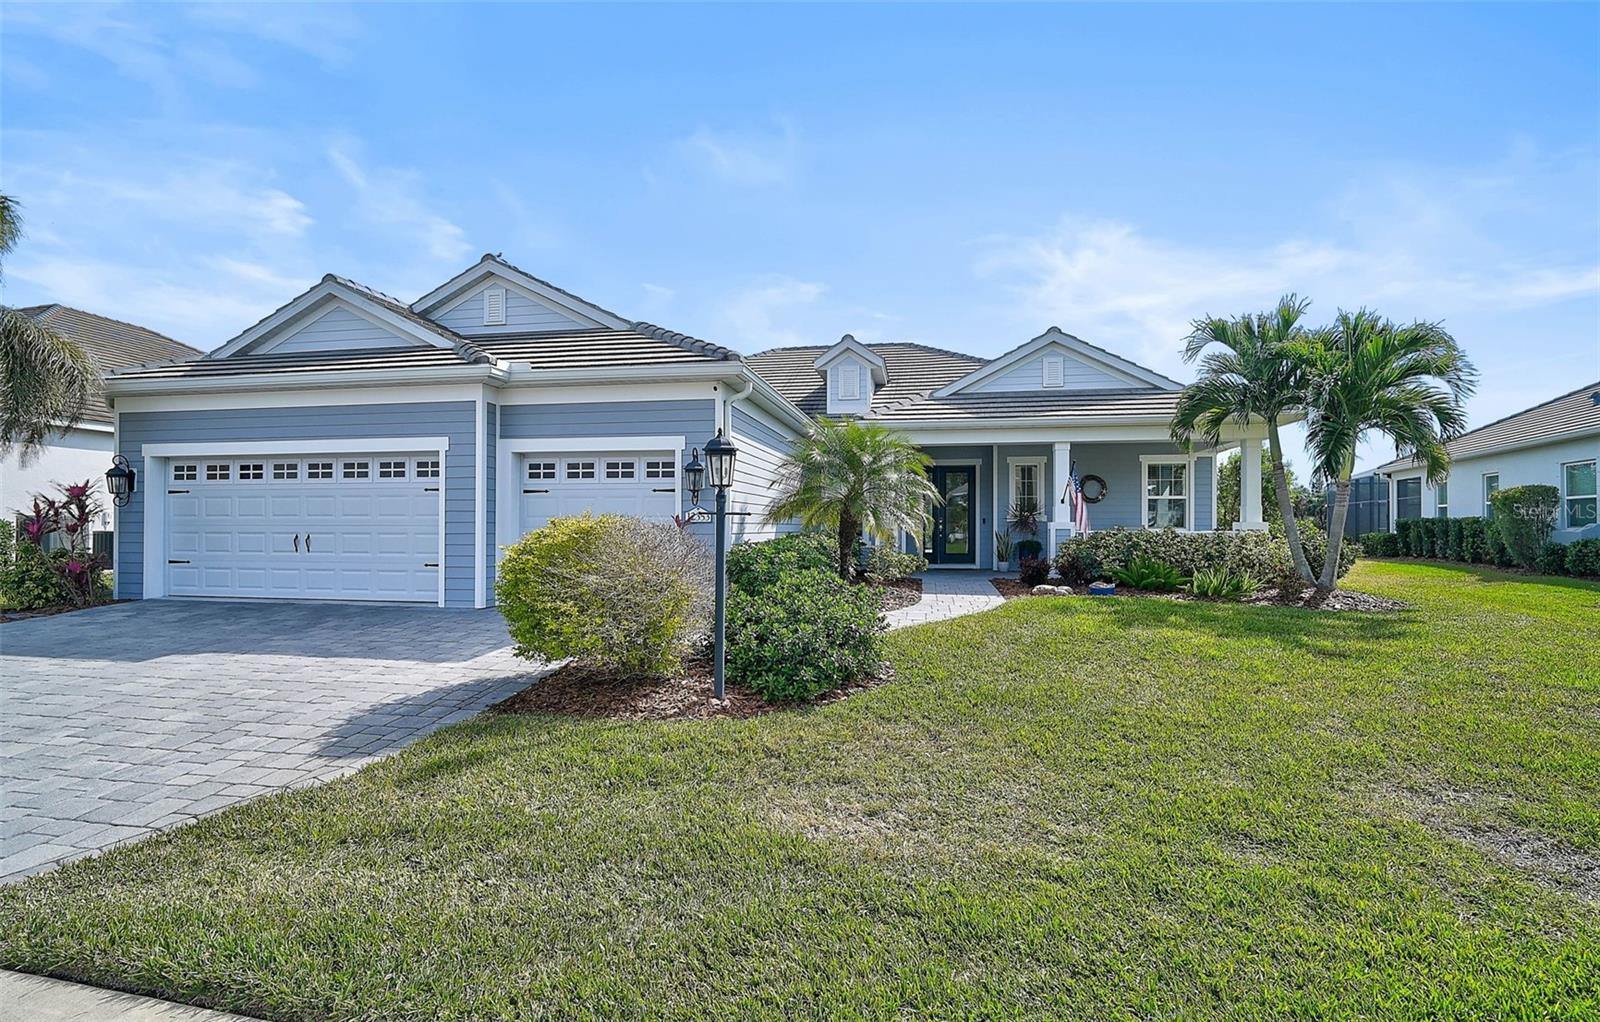
Property Description
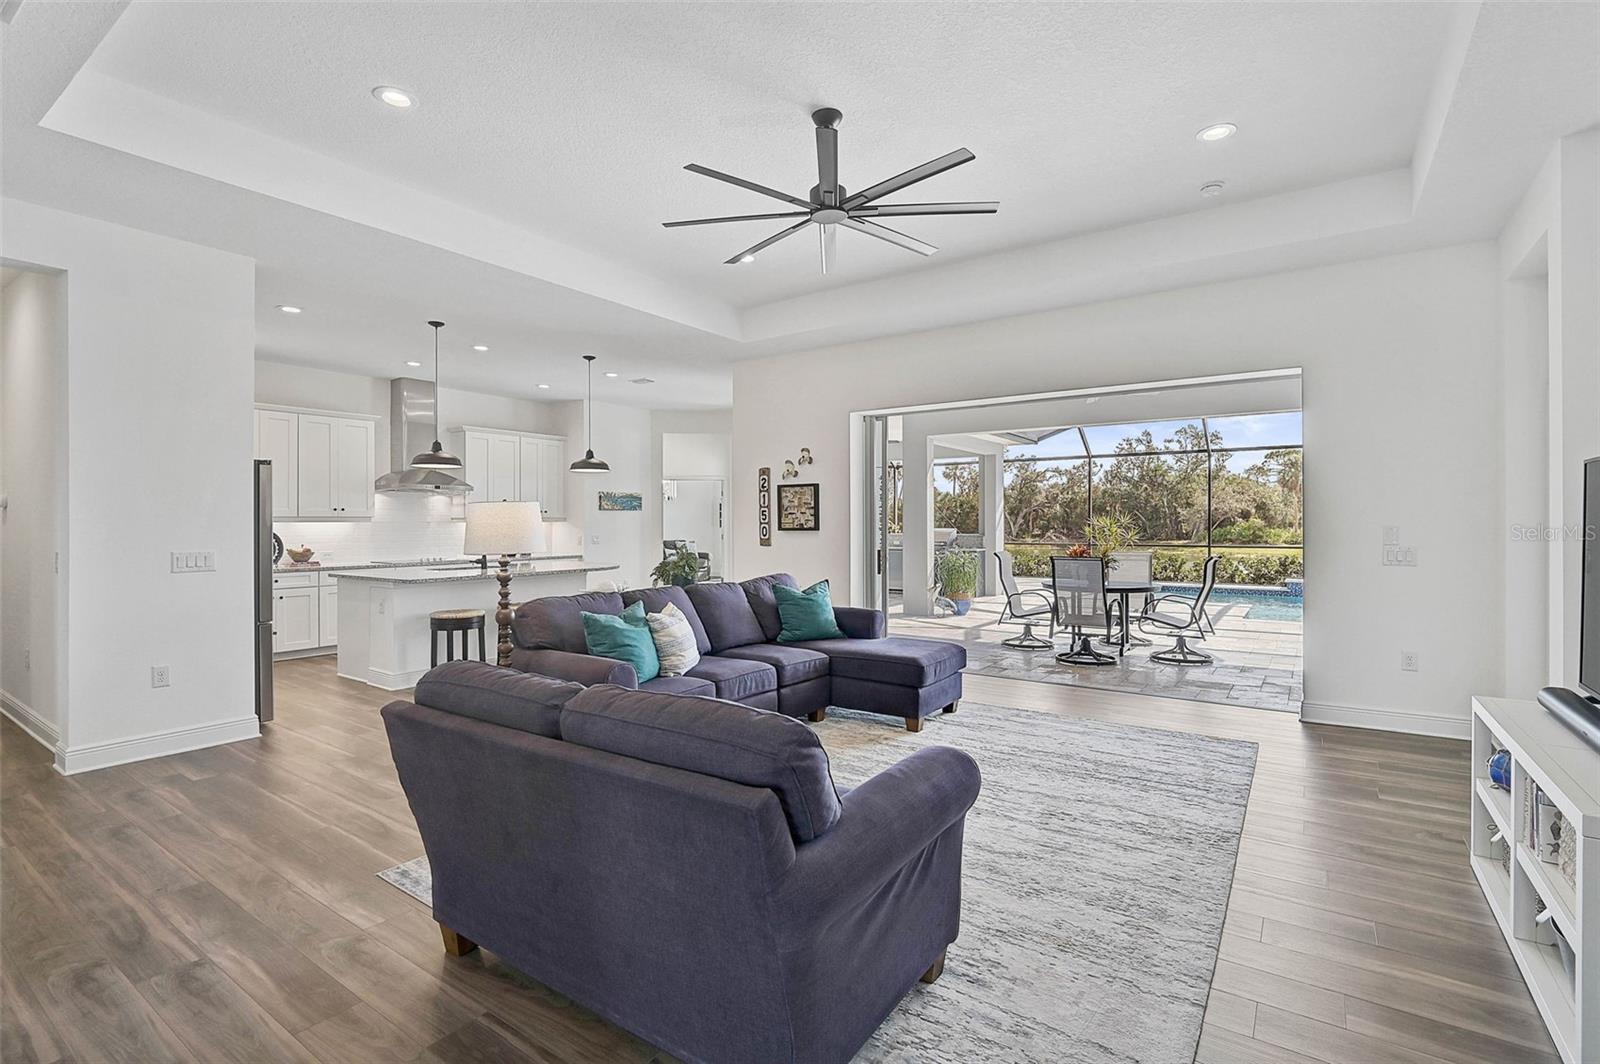
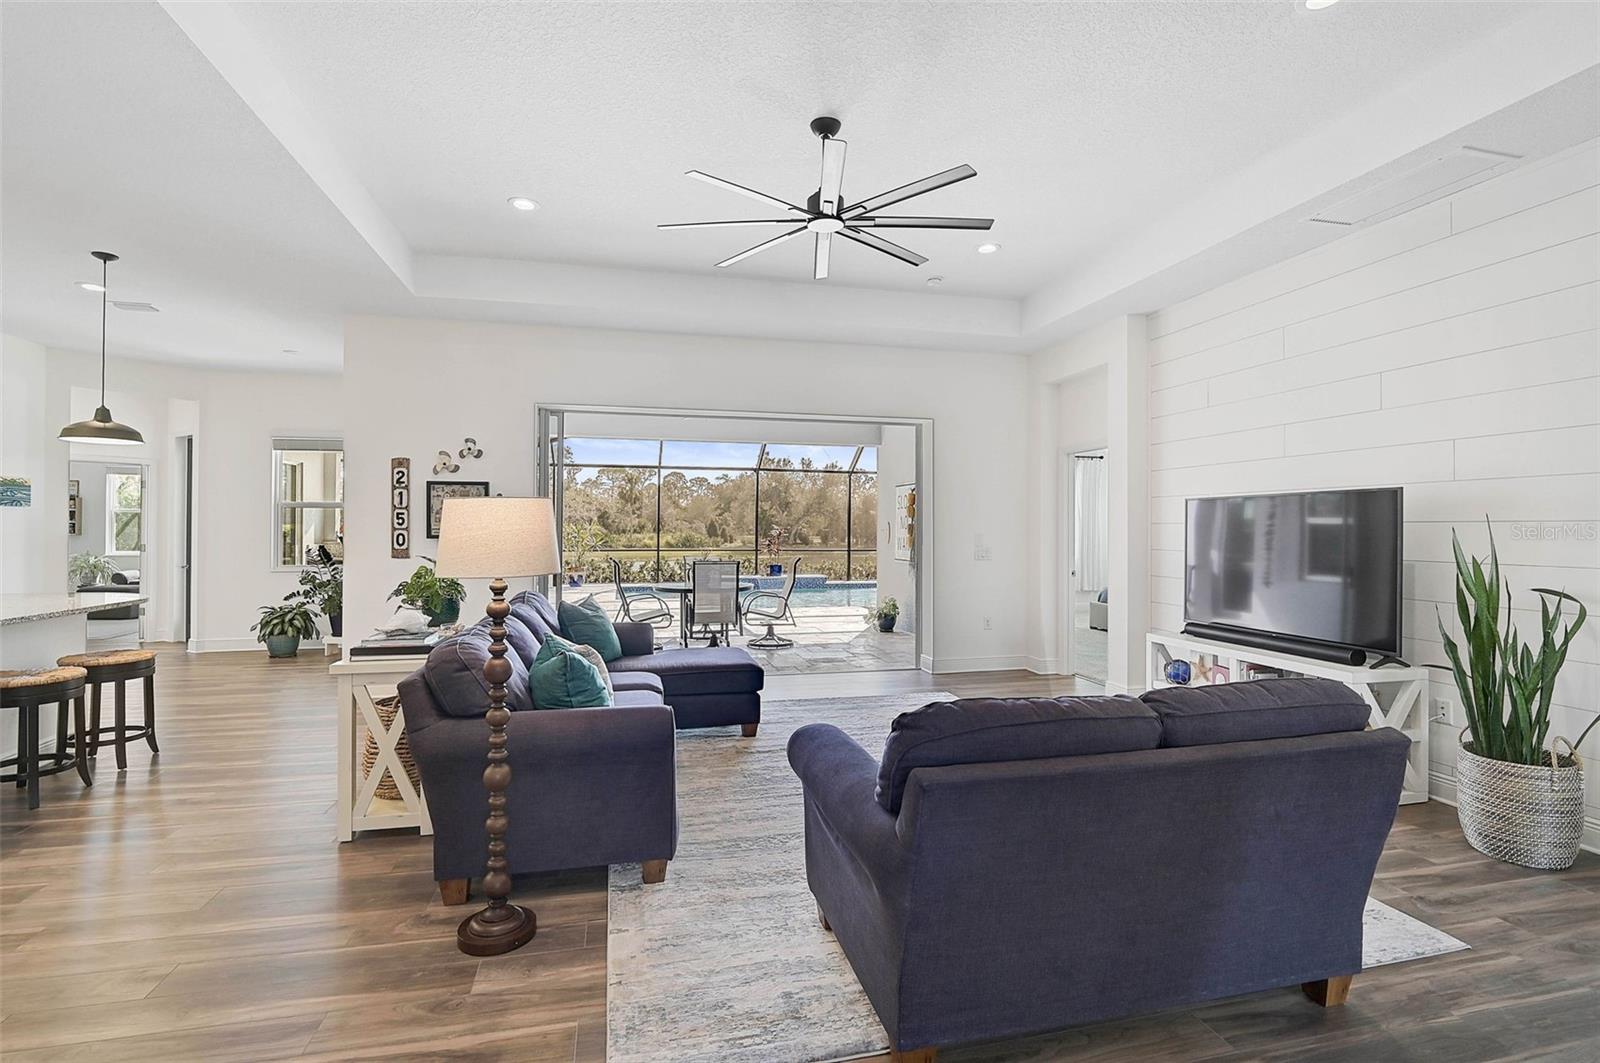
Located in the private, separately gated section of Grand Palm in Venice, Florida, 12353 Auburndale Ct. sits on a premium lot on a quiet cul-de-sac, offering serene water and preserve views with desirable southern pool exposure. This highly sought-after Neal Communities Sanibel floor plan features 3 bedrooms, 3 full bathrooms, a club room, and a spacious 3-car garage with 4’ extension, encompassing 2,563 square feet of interior living space and over 4,000 total square feet. It does not back up to River Road. Designed with both style and functionality in mind, this original-owner home boasts tasteful upgrades throughout, including white shaker 42” upper cabinets, under-cabinet lighting, granite countertops with an extended island, subway tile backsplash, stainless steel appliances with a vent hood, electric cooktop, a dinette space, and a walk-in corner pantry. The open-concept great room showcases a triple pocket slider, seamlessly blending indoor and outdoor living spaces, and flows into the dining room, the perfect space for entertaining. Elegant finishes include luxury vinyl flooring in the main areas, designer tile, plush carpeting in the bedrooms, recessed lighting, custom fixtures, ceiling fans, and a wood accent wall in the living area with tray ceilings. This home is clean, airy, and bright. The primary suite is a true retreat, featuring a spacious bathroom with dual vanities, a large soaking tub, and an expansive walk-in shower with Euro glass. The secondary bedrooms share a bathroom, providing convenience and privacy. A club room in the back of the home offers versatility as a den or office, with a slider leading to the lanai and adjacent to a full bath for easy use from the pool. Step outside to your heated, custom saltwater pool, complete with a sun shelf, water feature, LED lighting, and travertine pavers. The expansive lanai also features a natural gas outdoor kitchen and a rough-in for a hot tub. The garage is built for functionality, with a sought-after 4’ extension, and insulated garage doors. As a bonus, there is a sidewalk that leads you directly to the social club, resort-style pool, spa, and pickleball courts at the end of the cul-de-sac. This energy-efficient home is powered by solar panels and has foam insulated exterior walls, ensuring low monthly electric bills. Located in a natural gas, maintenance-free community, residents enjoy world-class amenities, including a full-time activity director, 28 miles of recreational and walking paths, two clubhouses, three pools, two spas, two dog parks, a splash pad, pickleball, tennis, sand volleyball, bocce ball, state-of-the-art fitness center, playground, kayaking, and fishing piers. With easy access to Wellen Park and I-75, this home is perfectly situated to enjoy all that Venice has to offer.
Build Your Team
Quickly find investor-friendly professionals who can help you succeed in real estate investing at any stage of the investing journey.


Agents
Match with investor-friendly agents who can help you find, analyze, and close your next deal


Lenders
Get the best funding…find investor-friendly lenders who specialize in your deal strategy


Property Managers
Transition to passive investing. Find a trusted property management partnership that lasts.


Tax Pros & Accountants
Taxes and financial reporting made easy—find experts to create tax savings strategies, file taxes, and more
Location
Property Details
Parking
- Description: Garage
- Details: Attached
- Garage Spaces: 3
- Spaces Total: 0
Bedroom Information
- # of Bedrooms: 3
Bathroom Information
- # of Baths (Full): 3
- # of Baths (Total): 3.0
Interior Features
- # of Rooms: 15
- # of Stories: 1
Exterior Features
- Exterior Walls Materials: Stucco
- Foundation: Slab
- Roof Type: Hip
- Roof Material: Tile
- Pool: Yes
- Solar Panels: Yes
HOA
- Has HOA: Yes
- Association: Becky Joy
- HOA Fee: $617/quarterly
- Additional Association: Grand Palm Master Association
- Additional HOA Fee: $952/quarterly
Land Information
- Land Use: Residential
- Land Use Subtype: Single Family Residential
Lot Information
- Parcel ID: 0760130023
- Lot Size: 10525 sqft
Property Information
- Property Type: Single Family Residence
- Style: Florida
- Year Built: 2019
Tax Information
- Annual Tax: $8,386
Utilities
- Water & Sewer: Public
- Heating: Central, Natural Gas
- Cooling: Central Air
Location
- County: Sarasota
Listing Details
Investment Summary
- Monthly Cash Flow
- -$1,877
- Cap Rate
- 3.9%
- Cash-on-Cash Return
- -9.9%
- Debt Coverage Ratio
- 0.63
- Internal Rate of Return (5 years)
- -5.6%
Cash Flow
Net Operating Income (NOI) minus mortgage payments.
Calculation:
NOI - Mortgage Payments
Cap Rate (Market Value)
Capitalization Rate is a rate of return that compares the yearly Net Operating Income (NOI) to the market value.
Calculation:
NOI / Market Value
Cash-on-Cash Return (CoC)
Annual Cash Flow / Cash Invested
Calculation:
Annual cash flow divided by initial cash invested.
Debt Coverage Ratio (DCR)
Net Operating Income (NOI) divided by total debt payments.
Calculation:
NOI / Total Debt Payments
Internal Rate of Return (IRR)
A metric for assessing profitability over time. IRR is the discount rate at which the net present value (NPV) of all future cash flows (positive and negative) from an investment equals zero — including both periodic cash flow (such as rent) and a projected sale at the end of the holding period. It represents the expected annualized return, accounting for income, expenses, and the recovery of capital through a future sale.
Purchase Details
Purchase PriceThe price paid for the property. Purchase price:
| $990,000 |
|---|---|
Amount FinancedThe amount of the purchase financed through a loan. Amount financed:
| -$792,000 |
Down paymentThe initial payment made towards the purchase. Down payment:
| $198,000 |
Closing CostsFees and expenses associated with purchasing a property, typically ranging from 2% to 5% of the home’s purchase price, paid at the end of a home purchase to cover services like lending, title transfer, and taxes. Closing costs:
| $29,700 |
Rehab CostsCosts incurred to repair or improve the property, including: roof, flooring, exterior siding, kitchen, exterior paint, bathrooms, etc. Rehab costs:
| $0 |
Initial Cash InvestedThe total initial cash invested in the property. Calculation:Down payment + Buying costs + Rehab costs Initial cash invested:
| $227,700 |
Square Feet (SQFT)The total square footage of the property. Square feet:
| 2,563 |
Cost Per Square FootCost per square foot of the property. Calculation:Purchase Price / Square Feet Cost per square foot:
| $386 |
Monthly Rent Per Square FootMonthly rent divided by the number of square feet. This ratio helps investors compare rental income efficiency across properties, markets, and unit sizes Calculation:Monthly Rent / Square Feet Monthly rent per square foot:
| $2.50 |
Financing Details
Loan AmountThe total sum of money borrowed from a lender to finance a property purchase. Calculation:Purchase Price - Down Payment
Loan amount:
| $792,000 |
|---|---|
Loan to Value Ratio (LTV)Loan amount divided by the market value of the property. Calculation:Loan Amount / Market Value
Loan to value ratio:
| 80.0% |
Loan TypeThe type of loan (e.g., fixed, adjustable).
Loan type:
| Amortizing |
TermThe loan repayment period in years.
Term:
| 30 years |
Interest RateThe percentage a lender charges on the borrowed amount of a loan, determining the cost of borrowing money.
Interest rate:
| 6.625% |
Principal & Interest (PI)The principal is the portion of the loan payment that reduces the loan balance. The interest is the lender's charge for borrowing money. Calculation:(P * r * (1 + r) ** n) / ((1 + r) ** n - 1) Where:
P = Loan amount (principal)
Principal & interest:
| $5,071 |
Property TaxesAnnual taxes levied by local governments on real estate properties. These taxes fund public services like schools, roads, and emergency services.
Property tax:
| $699 |
InsuranceThe costs for insurance coverage to protect against financial losses due to risks like fire, natural disasters, theft, liability, or tenant-related damages. Calculation:Assumes 7% of gross rental income, unless insurance rates are specified.
Insurance:
| $448 |
Private Mortgage Insurance (PMI)A fee that borrowers pay when they take out a conventional loan with a loan-to-value (LTV) ratio above 80%.
Private mortgage insurance (PMI):
| $0 |
Monthly PaymentThe fixed amount a borrower pays each month to repay a loan. It typically includes principal and interest (P&I) and may also cover property taxes, insurance, HOA fees, and PMI if escrowed. Monthly payment:
| $6,218 |
Operating Income
| % Rent | Monthly | Yearly | |
|---|---|---|---|
Gross RentThe total rental income received from tenants before deducting any expenses. Includes base rent, late fees, pet fees, parking fees, and other recurring charges.
Gross rent:
| $6,400 | $76,800 | |
Vacancy LossExpected loss of rent due to vacancies.
Vacancy loss:
(6%)
| 6% | -$384 | -$4,608 |
Operating IncomeGross rental income minus vacancy loss. Calculation:Gross rent - Vacancy loss
Operating income:
| $6,016 | $72,192 |
Operating Expenses
| % Rent | Monthly | Yearly | |
|---|---|---|---|
Property TaxesAnnual taxes levied by local governments on real estate properties. These taxes fund public services like schools, roads, and emergency services. | 11% | -$699 | -$8,386 |
InsuranceThe costs for insurance coverage to protect against financial losses due to risks like fire, natural disasters, theft, liability, or tenant-related damages. Calculation:Assumes 7% of gross rental income, unless insurance rates are specified. | 7% | -$448 | -$5,376 |
Property ManagementThe costs associated with hiring a property manager to handle the day-to-day operations of a rental property. Includes management fees, leasing fes, eviction fees, etc. Calculation:Assumes 8% of gross rental income. | 8% | -$512 | -$6,144 |
Repairs & MaintenanceOngoing costs for routine upkeep and minor fixes needed to keep a property in good working condition. Calculation:Assumes 5% of gross rental income. Varies by property age and condition. | 5% | -$320 | -$3,840 |
Capital ExpensesLarge, infrequent costs for major improvements or replacements, like a new roof, HVAC system, or appliances. Calculation:Assumes 5% of gross rental income. Varies by property age. | 5% | -$320 | -$3,840 |
HOA FeesRegular dues paid to a Homeowners Association for community maintenance, amenities, and management. Similar fees include: Condo Association Fees, Co-op Maintenance Fees, etc. | 8% | -$523 | -$6,276 |
Operating ExpensesRecurring costs required to maintain and manage a rental property, including property taxes, insurance, maintenance, repairs, utilities (if paid by the owner), property management fees, and other day-to-day expenses. Calculation:Insurance + Property Taxes + Property Management + Repairs & Maintenance + Capital Expenditures + HOA Fees | 44% | -$2,822 | -$33,862 |
Cash Flow
| Monthly | Yearly | |
|---|---|---|
Net Operating Income (NOI)The income generated from a property after deducting all operating expenses but before deducting mortgage payments, taxes, and capital expenditures. Calculation:Gross Operating Income - Operating Expenses
Net operating income:
| $3,194 | $38,328 |
Mortgage PaymentThe fixed amount a borrower pays each month to repay a loan. It typically includes principal and interest (P&I) and may also cover property taxes, insurance, HOA fees, and PMI if escrowed. | -$5,071 | -$60,852 |
Cash FlowNet Operating Income (NOI) minus mortgage payments. Calculation:NOI - Mortgage Payments | $1,877 | $22,524 |