$2,799,000
Investment Summary
- Monthly Cash Flow
- -$8,817
- Cap Rate
- 2.3%
- Cash-on-Cash Return
- -16.4%
- Debt Coverage Ratio
- 0.38
- Internal Rate of Return (5 years)
- -11.9%
Cash Flow
Net Operating Income (NOI) minus mortgage payments.
Calculation:
NOI - Mortgage Payments
Cap Rate (Market Value)
Capitalization Rate is a rate of return that compares the yearly Net Operating Income (NOI) to the market value.
Calculation:
NOI / Market Value
Cash-on-Cash Return (CoC)
Annual Cash Flow / Cash Invested
Calculation:
Annual cash flow divided by initial cash invested.
Debt Coverage Ratio (DCR)
Net Operating Income (NOI) divided by total debt payments.
Calculation:
NOI / Total Debt Payments
Internal Rate of Return (IRR)
A metric for assessing profitability over time. IRR is the discount rate at which the net present value (NPV) of all future cash flows (positive and negative) from an investment equals zero — including both periodic cash flow (such as rent) and a projected sale at the end of the holding period. It represents the expected annualized return, accounting for income, expenses, and the recovery of capital through a future sale.
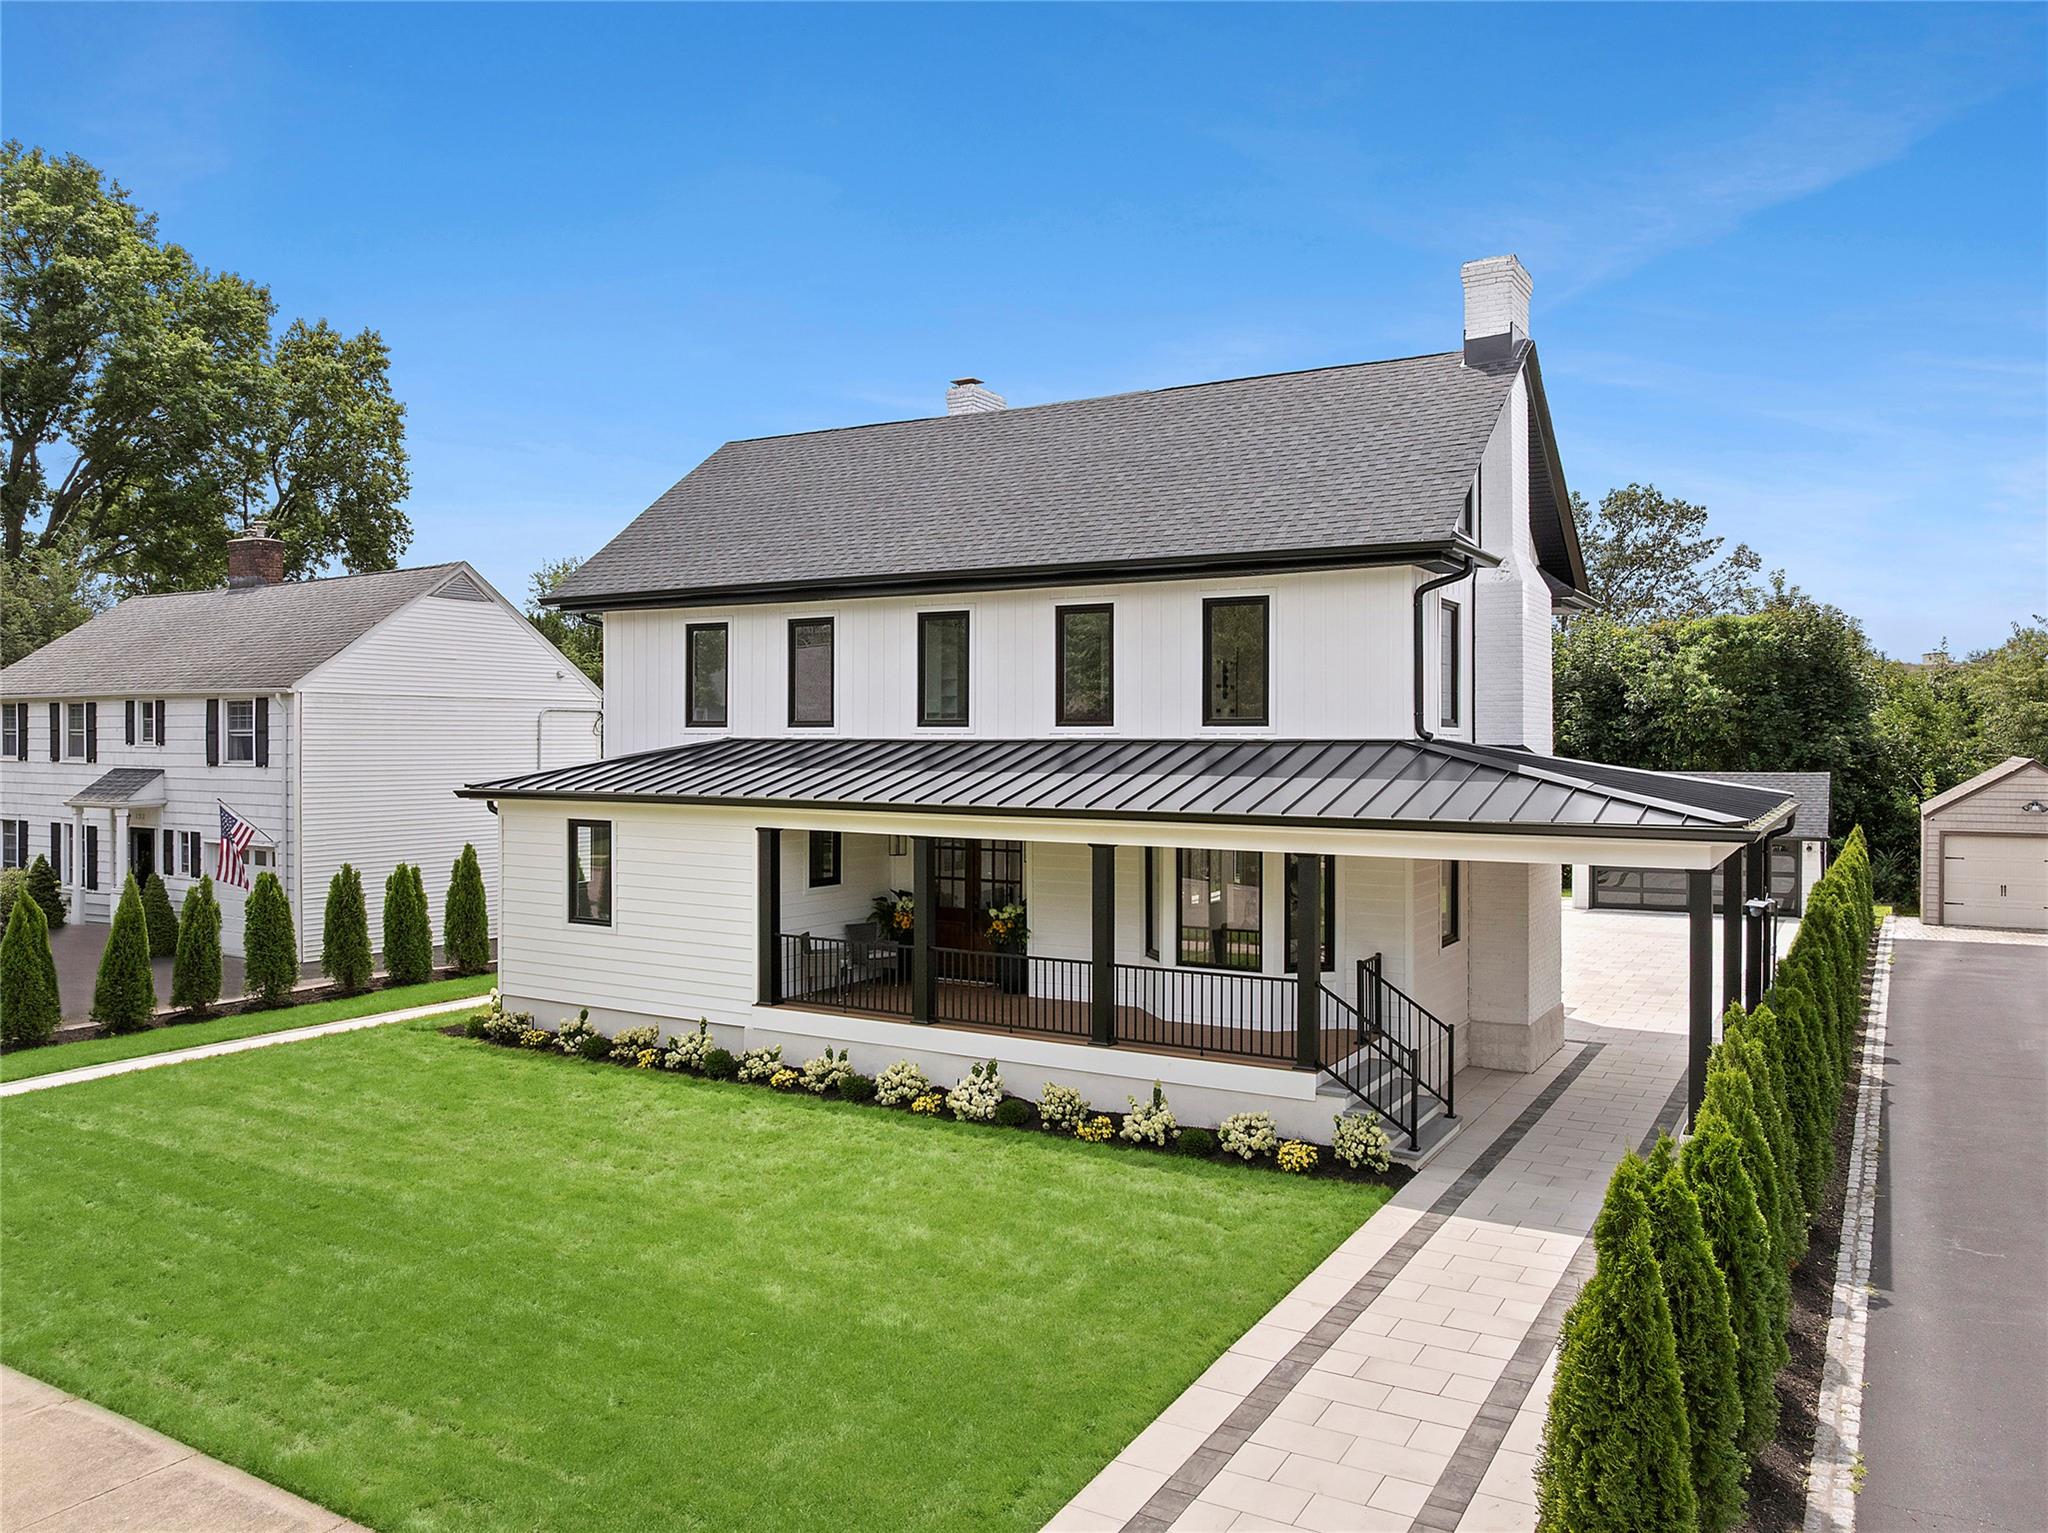
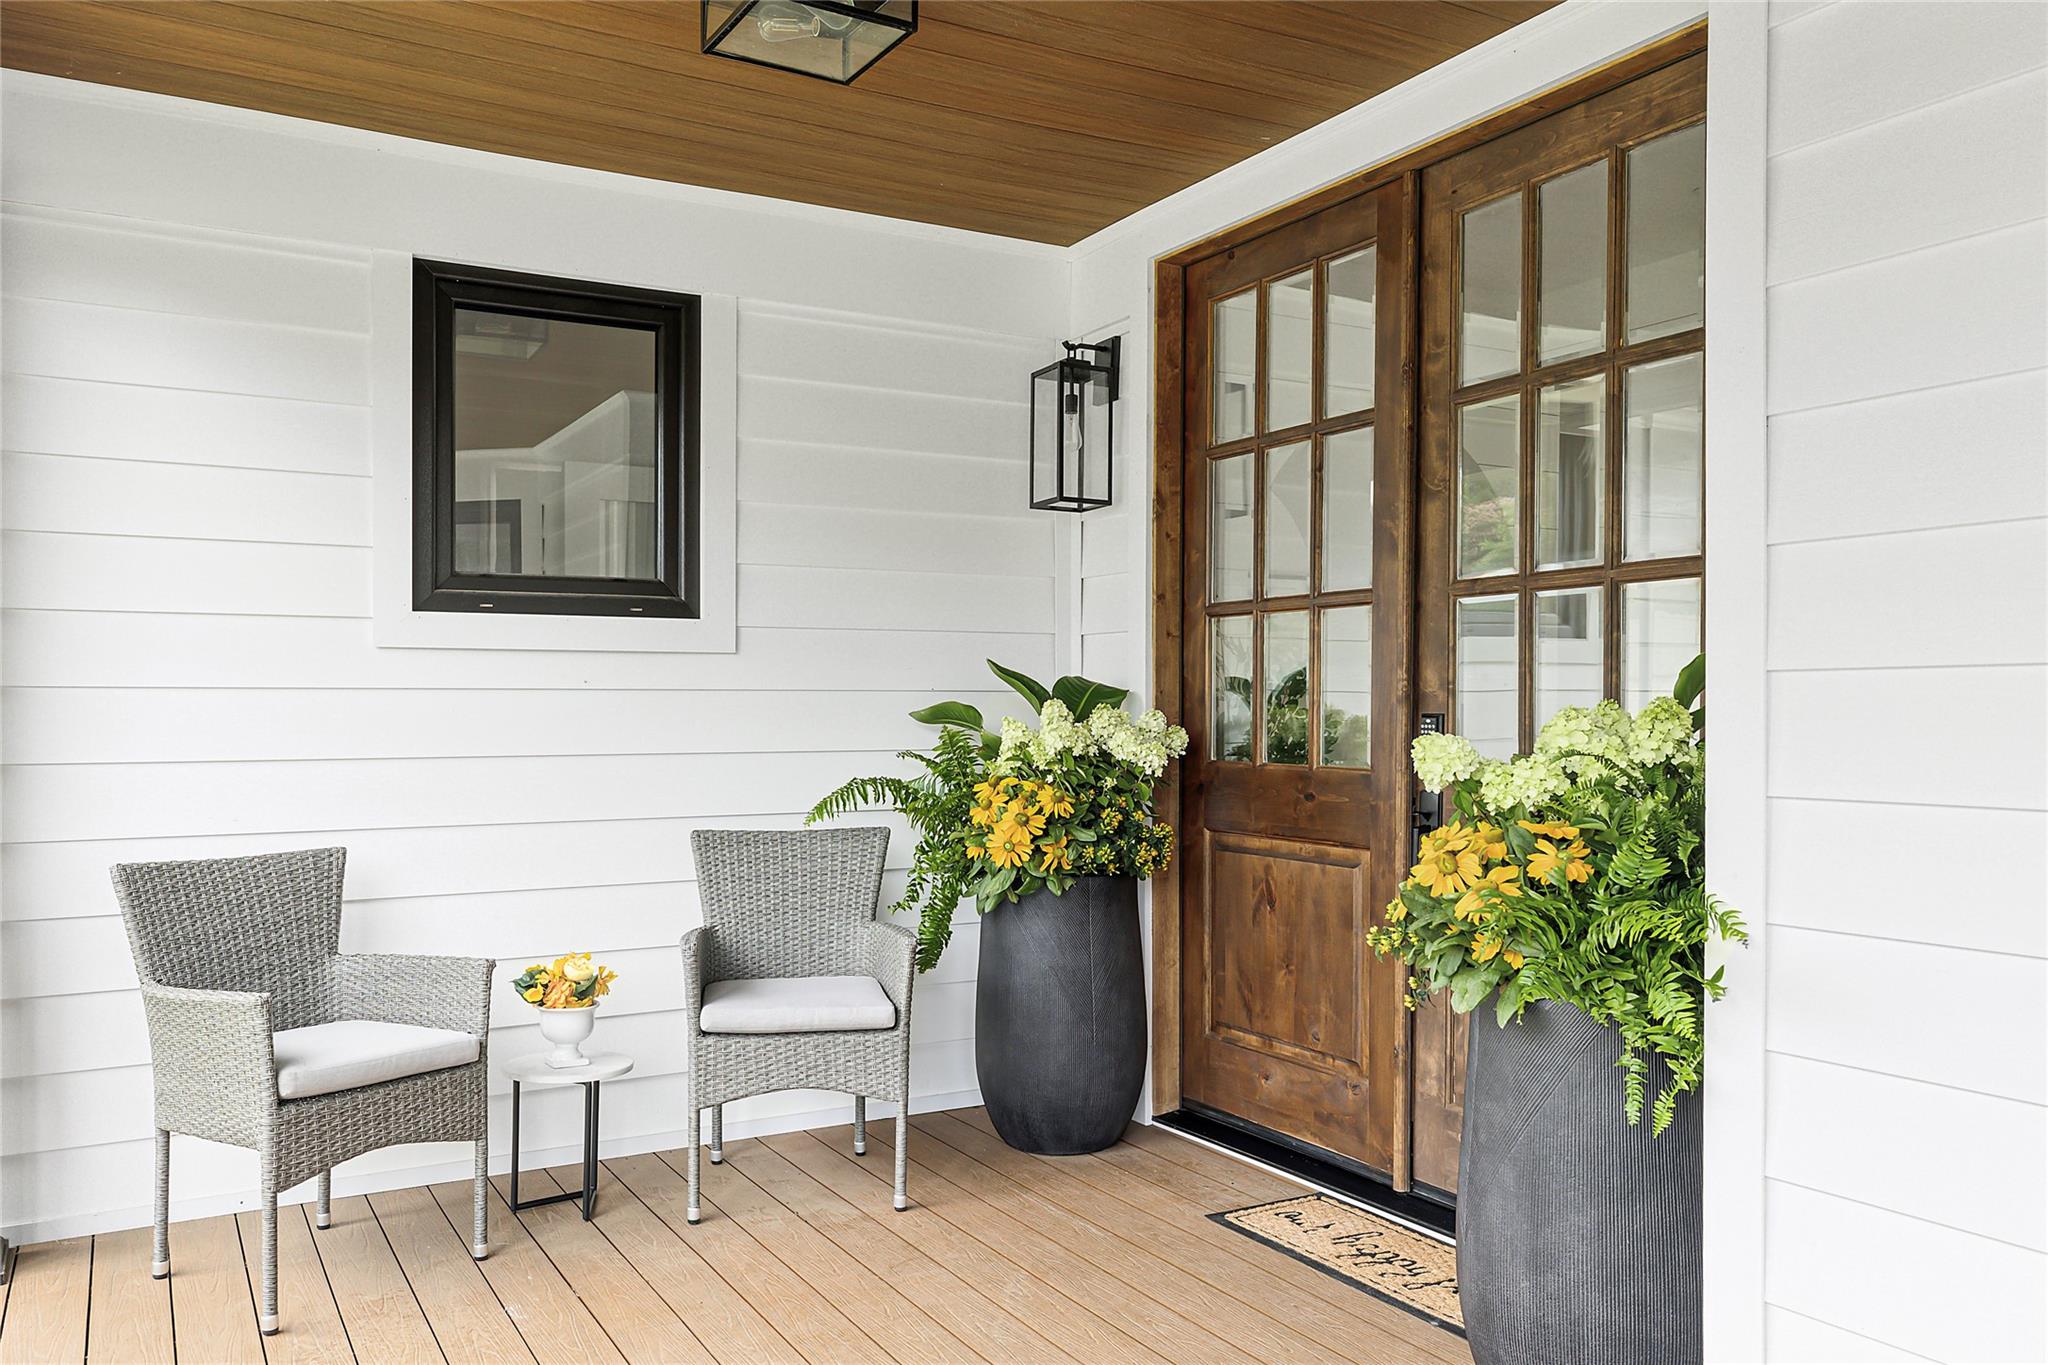
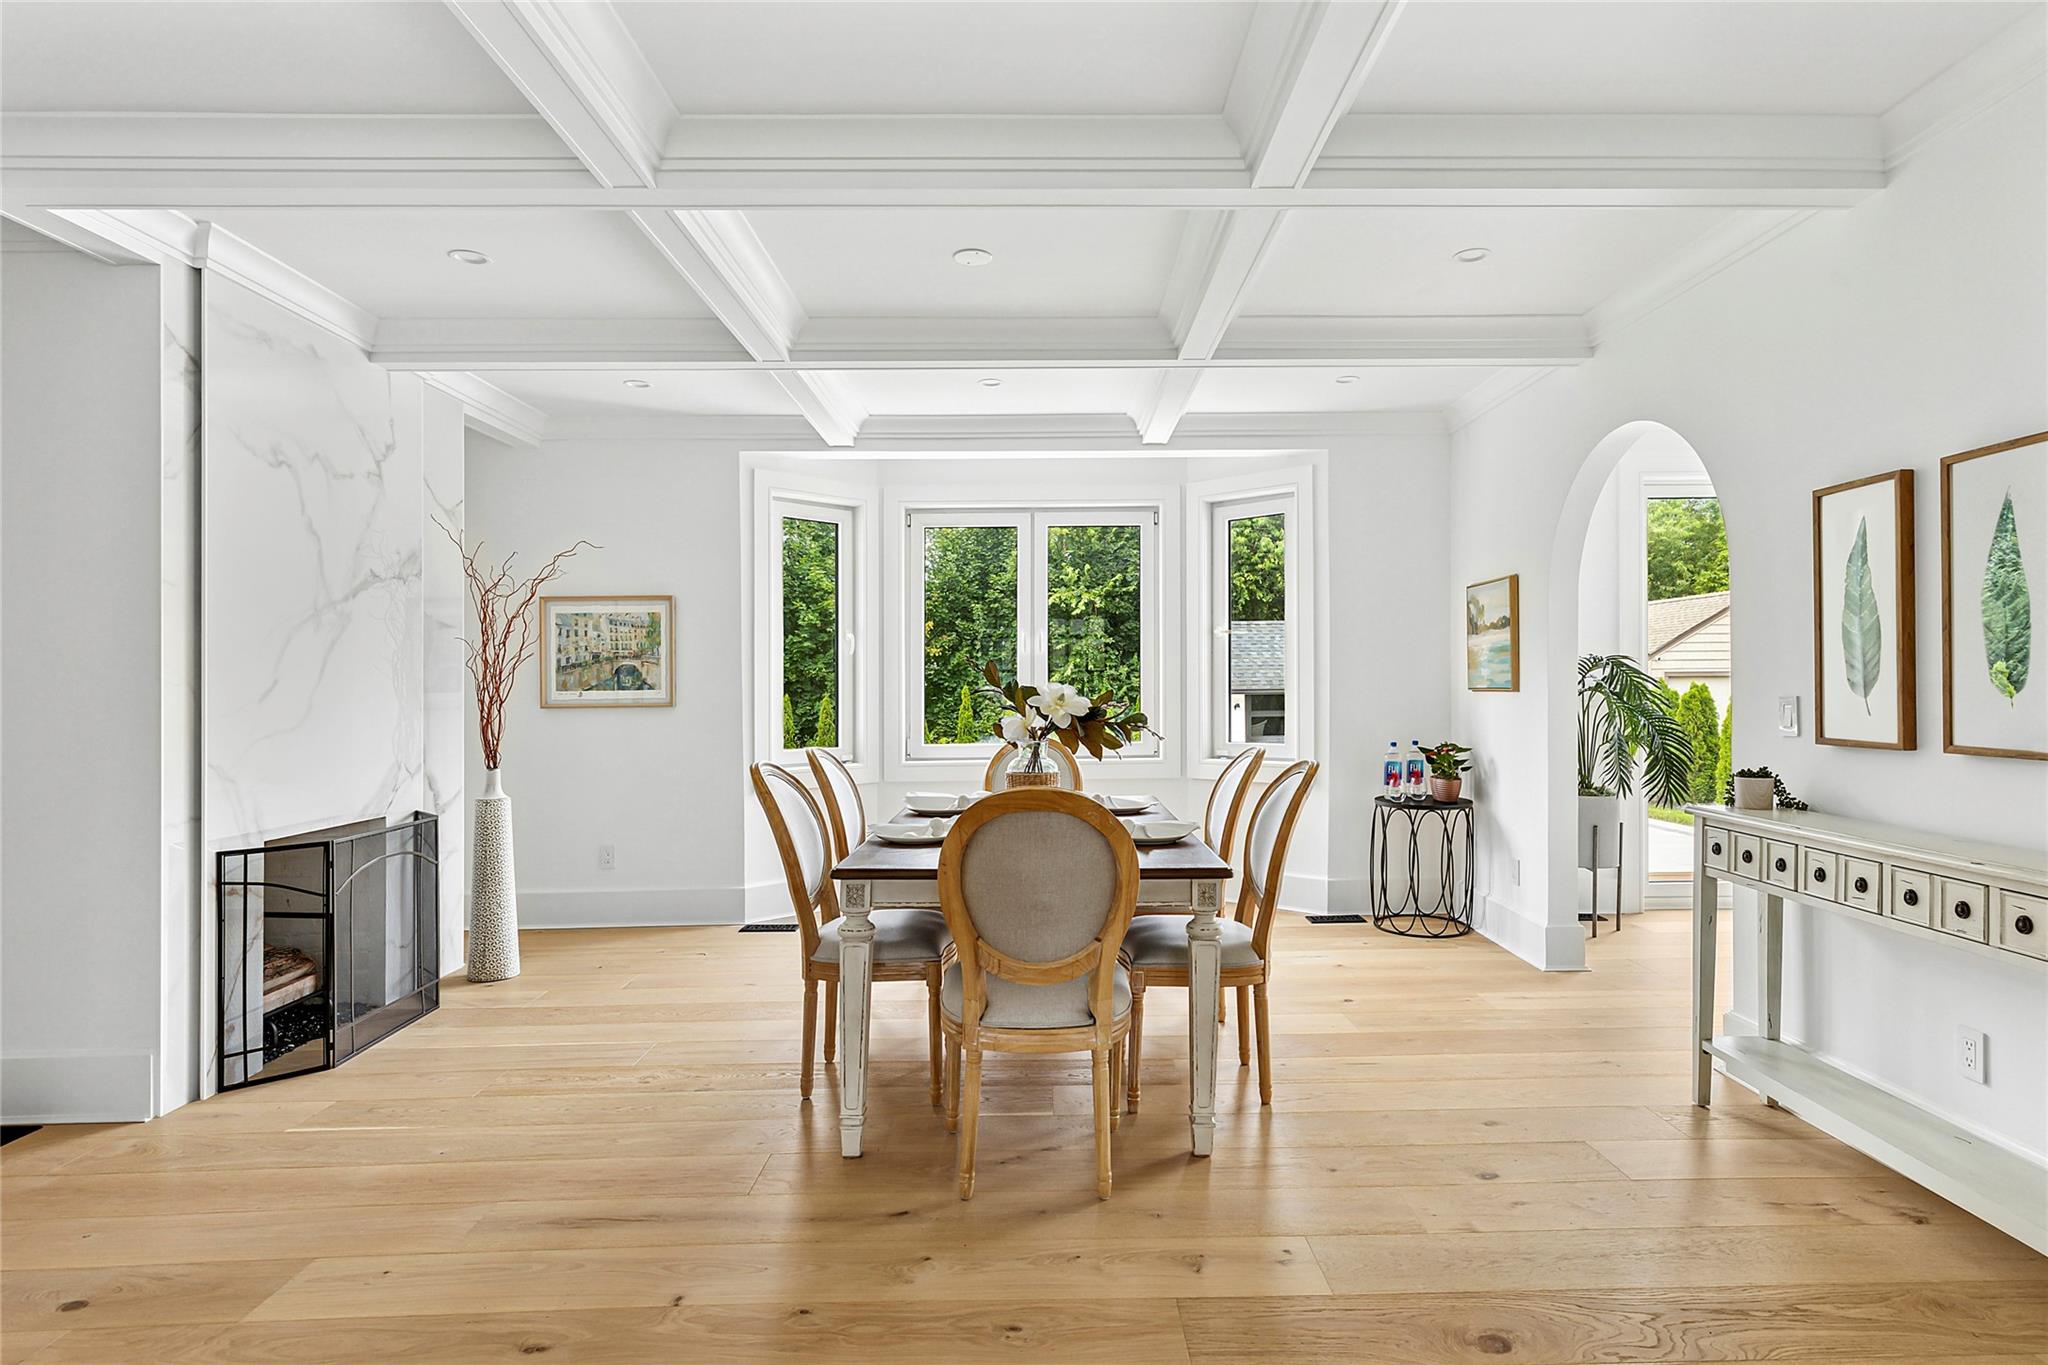
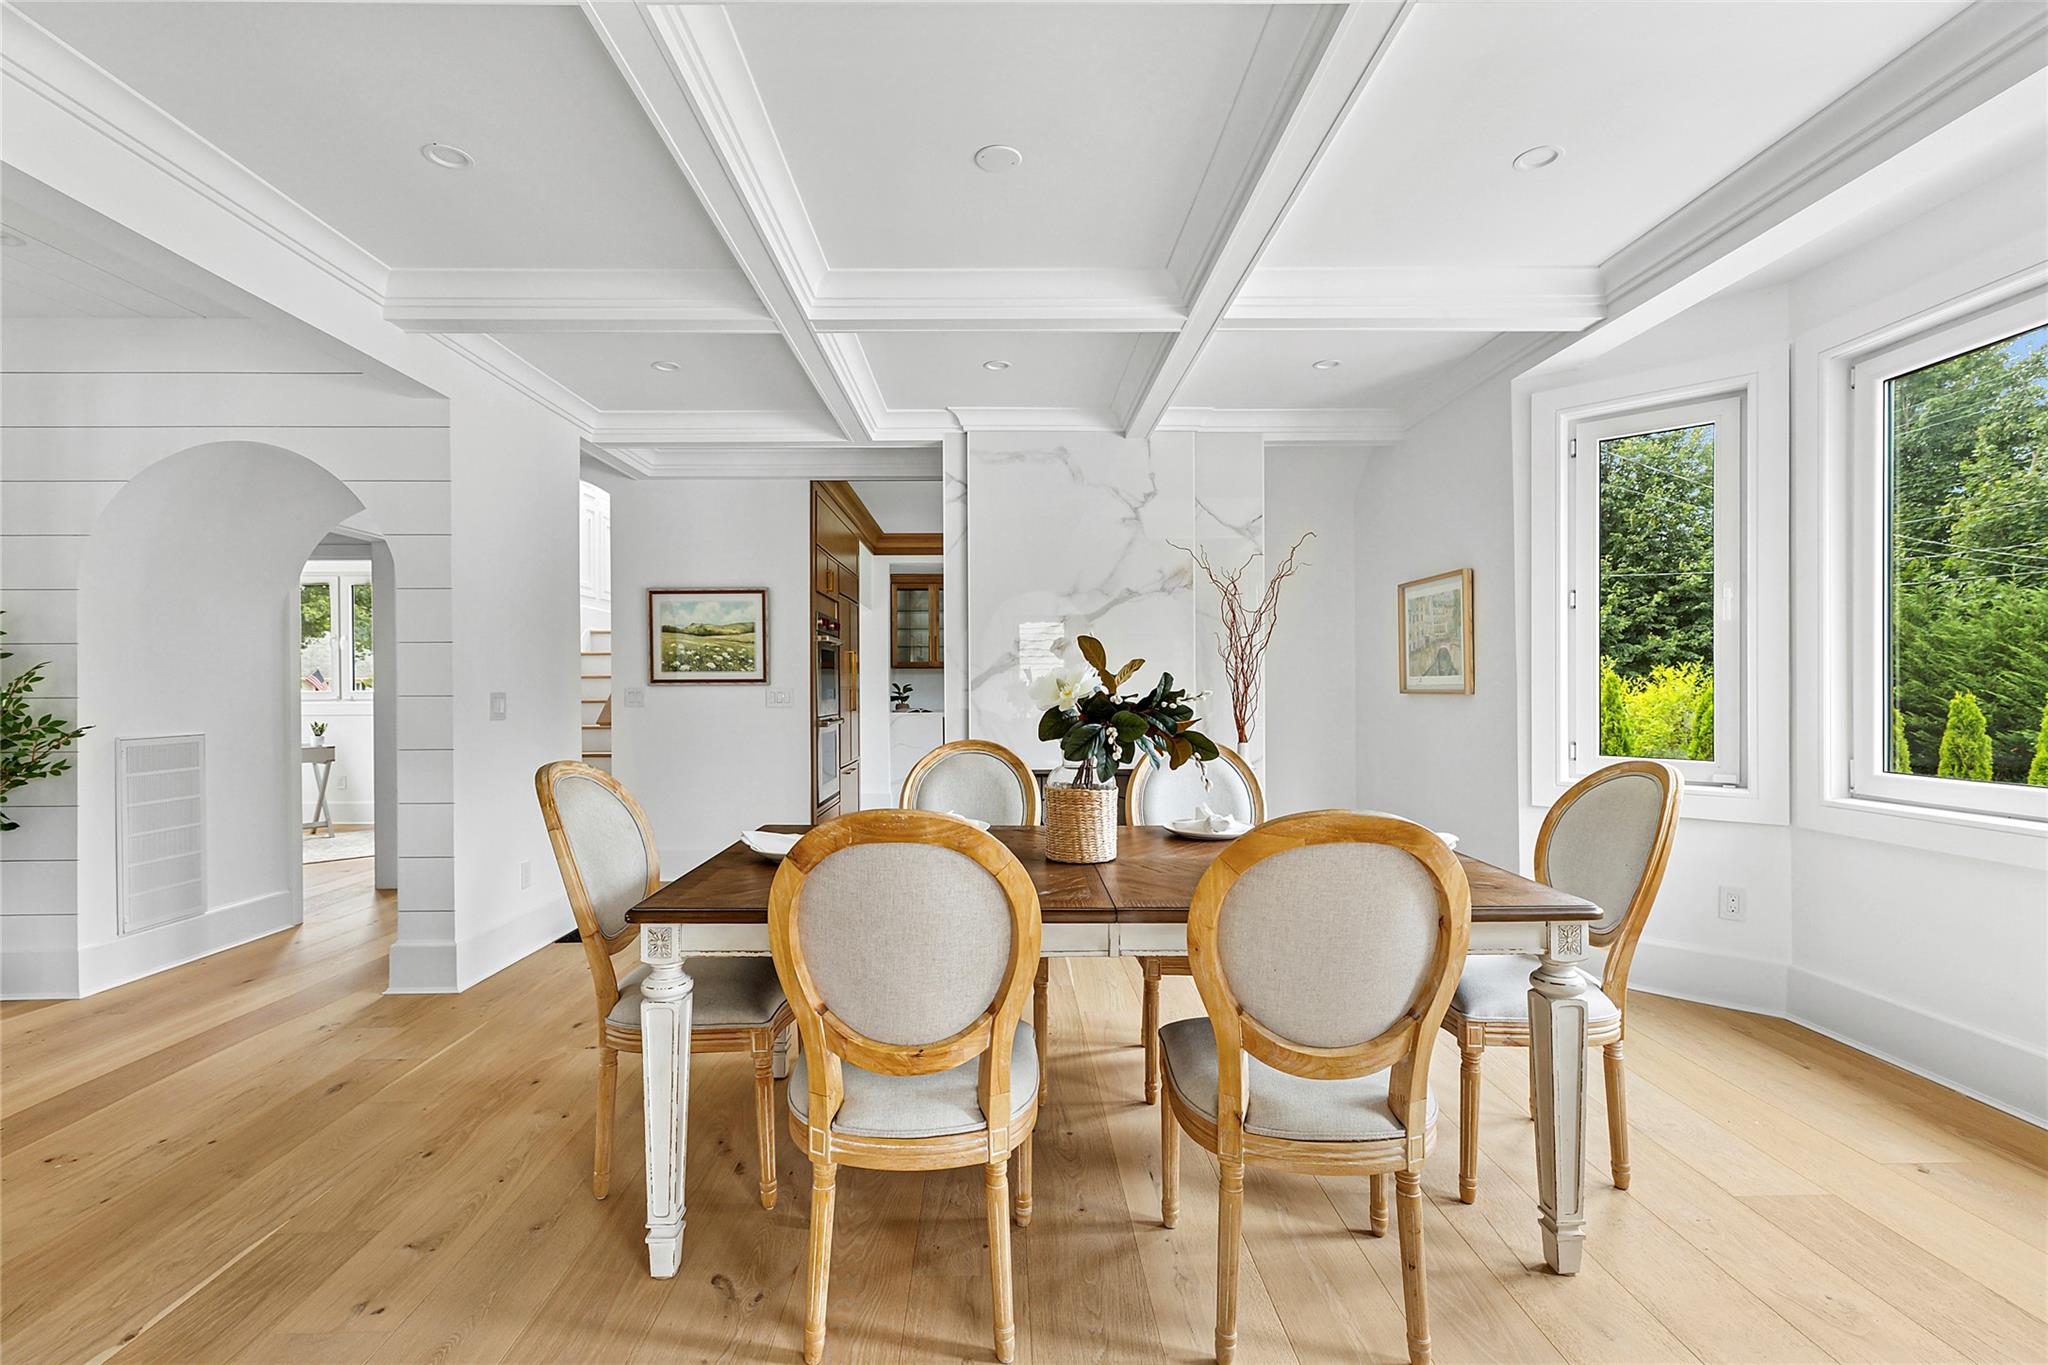
Property Description
This magnificent six-bedroom, four-bathroom Garden City Colonial was completely rebuilt in 2024. Situated on a picturesque tree-lined street in the heart of Garden City's Central Section, this stunning new construction has been thoughtfully and thoroughly designed with the highest quality finishes and an unwavering attention to detail—offering refined living with modern functionality. A covered front porch with clean architectural lines opens to a grand entry foyer, where 10-foot ceilings and 10-inch wide-plank white oak hardwood floors set the tone for elevated design and extraordinary craftsmanship throughout. On the first floor, the formal living and dining rooms are adorned with coffered ceilings and elegant wood-burning fireplaces, creating warm and inviting spaces that blend sophistication with the comfort of everyday use. The beautifully appointed kitchen features custom cabinetry, quartz countertops and backsplash, a custom stone range hood and farmhouse sink, and top-tier appliances including a 48" Wolf range with double ovens, Wolf microwave, Sub-Zero refrigerator, and wine fridge—offering a luxurious space that seamlessly balances style and performance. A versatile first-floor bedroom sits adjacent to a full bathroom, providing a perfect guest room or home office and adding to the home’s exceptional functionality. The second-floor primary suite serves as a private retreat, with custom-built closets, a striking floor-to-ceiling marble fireplace, and a beautifully appointed en suite bathroom. Three additional bedrooms, a full hallway bathroom, and a laundry room complete the second floor. On the third floor, an oversized second primary suite showcases vaulted ceilings, a stone fireplace, and a spa-inspired bathroom complete with a free-standing soaking tub, dual rainfall showers, and a private steam room. Additional features include four stone floor-to-ceiling fireplaces, exquisite custom millwork and shiplap wainscoting, crown molding, ambient recessed lighting, radiant heated floors and spa-quality finishes in all four impeccably designed full bathrooms. Imported European windows, a full-house water filtration system, a security system, in-ground sprinklers, and a full basement with ample storage and space for a recreation room and/or home gym further enhance the home’s appeal. Outdoors, the large, professionally landscaped backyard offers an expansive stone patio ideal for entertaining. An oversized two-car garage and additional two-car front carport provide ample parking. Conveniently located just minutes from Franklin Avenue and 7th Street shopping and dining, close to schools and universities, and two LIRR train stations, this home effortlessly combines timeless design with today’s most sought-after amenities—all just 35 minutes from Manhattan.
Build Your Team
Quickly find investor-friendly professionals who can help you succeed in real estate investing at any stage of the investing journey.


Agents
Match with investor-friendly agents who can help you find, analyze, and close your next deal


Lenders
Get the best funding…find investor-friendly lenders who specialize in your deal strategy


Property Managers
Transition to passive investing. Find a trusted property management partnership that lasts.


Tax Pros & Accountants
Taxes and financial reporting made easy—find experts to create tax savings strategies, file taxes, and more
Location
Property Details
Parking
- Description: Carport, Garage
- Details: Carport, Driveway, Garage, Private
- Garage Spaces: 2
- Spaces Total: 0
Bedroom Information
- # of Bedrooms: 6
Bathroom Information
- # of Baths (Full): 4
- # of Baths (Total): 4.0
Interior Features
- # of Rooms: 10
- Attic: Yes
- Basement: Yes
- Basement Description: Full, Partially Finished
- Fireplace: Yes
Exterior Features
- Exterior Walls Materials: Wood
Land Information
- Land Use: Residential
- Land Use Subtype: Single Family Residential
Lot Information
- Parcel ID: 34046000115
- Lot Size: 10725 sqft
Property Information
- Property Type: Single Family Residence
- Style: Colonial
- Year Built: 2024
Tax Information
- Annual Tax: $28,708
Utilities
- Water & Sewer: Public
- Heating: Forced Air, Radiant, Radiant Floor
- Cooling: Central Air
Location
- County: Nassau
Listing Details
Investment Summary
- Monthly Cash Flow
- -$8,817
- Cap Rate
- 2.3%
- Cash-on-Cash Return
- -16.4%
- Debt Coverage Ratio
- 0.38
- Internal Rate of Return (5 years)
- -11.9%
Cash Flow
Net Operating Income (NOI) minus mortgage payments.
Calculation:
NOI - Mortgage Payments
Cap Rate (Market Value)
Capitalization Rate is a rate of return that compares the yearly Net Operating Income (NOI) to the market value.
Calculation:
NOI / Market Value
Cash-on-Cash Return (CoC)
Annual Cash Flow / Cash Invested
Calculation:
Annual cash flow divided by initial cash invested.
Debt Coverage Ratio (DCR)
Net Operating Income (NOI) divided by total debt payments.
Calculation:
NOI / Total Debt Payments
Internal Rate of Return (IRR)
A metric for assessing profitability over time. IRR is the discount rate at which the net present value (NPV) of all future cash flows (positive and negative) from an investment equals zero — including both periodic cash flow (such as rent) and a projected sale at the end of the holding period. It represents the expected annualized return, accounting for income, expenses, and the recovery of capital through a future sale.
Purchase Details
Purchase PriceThe price paid for the property. Purchase price:
| $2,799,000 |
|---|---|
Amount FinancedThe amount of the purchase financed through a loan. Amount financed:
| -$2,239,200 |
Down paymentThe initial payment made towards the purchase. Down payment:
| $559,800 |
Closing CostsFees and expenses associated with purchasing a property, typically ranging from 2% to 5% of the home’s purchase price, paid at the end of a home purchase to cover services like lending, title transfer, and taxes. Closing costs:
| $83,970 |
Rehab CostsCosts incurred to repair or improve the property, including: roof, flooring, exterior siding, kitchen, exterior paint, bathrooms, etc. Rehab costs:
| $0 |
Initial Cash InvestedThe total initial cash invested in the property. Calculation:Down payment + Buying costs + Rehab costs Initial cash invested:
| $643,770 |
Square Feet (SQFT)The total square footage of the property. Square feet:
| 3,480 |
Cost Per Square FootCost per square foot of the property. Calculation:Purchase Price / Square Feet Cost per square foot:
| $804 |
Monthly Rent Per Square FootMonthly rent divided by the number of square feet. This ratio helps investors compare rental income efficiency across properties, markets, and unit sizes Calculation:Monthly Rent / Square Feet Monthly rent per square foot:
| $3.22 |
Financing Details
Loan AmountThe total sum of money borrowed from a lender to finance a property purchase. Calculation:Purchase Price - Down Payment
Loan amount:
| $2,239,200 |
|---|---|
Loan to Value Ratio (LTV)Loan amount divided by the market value of the property. Calculation:Loan Amount / Market Value
Loan to value ratio:
| 80.0% |
Loan TypeThe type of loan (e.g., fixed, adjustable).
Loan type:
| Amortizing |
TermThe loan repayment period in years.
Term:
| 30 years |
Interest RateThe percentage a lender charges on the borrowed amount of a loan, determining the cost of borrowing money.
Interest rate:
| 6.500% |
Principal & Interest (PI)The principal is the portion of the loan payment that reduces the loan balance. The interest is the lender's charge for borrowing money. Calculation:(P * r * (1 + r) ** n) / ((1 + r) ** n - 1) Where:
P = Loan amount (principal)
Principal & interest:
| $14,153 |
Property TaxesAnnual taxes levied by local governments on real estate properties. These taxes fund public services like schools, roads, and emergency services.
Property tax:
| $2,392 |
InsuranceThe costs for insurance coverage to protect against financial losses due to risks like fire, natural disasters, theft, liability, or tenant-related damages. Calculation:Assumes 7% of gross rental income, unless insurance rates are specified.
Insurance:
| $784 |
Private Mortgage Insurance (PMI)A fee that borrowers pay when they take out a conventional loan with a loan-to-value (LTV) ratio above 80%.
Private mortgage insurance (PMI):
| $0 |
Monthly PaymentThe fixed amount a borrower pays each month to repay a loan. It typically includes principal and interest (P&I) and may also cover property taxes, insurance, HOA fees, and PMI if escrowed. Monthly payment:
| $17,329 |
Operating Income
| % Rent | Monthly | Yearly | |
|---|---|---|---|
Gross RentThe total rental income received from tenants before deducting any expenses. Includes base rent, late fees, pet fees, parking fees, and other recurring charges.
Gross rent:
| $11,200 | $134,400 | |
Vacancy LossExpected loss of rent due to vacancies.
Vacancy loss:
(6%)
| 6% | -$672 | -$8,064 |
Operating IncomeGross rental income minus vacancy loss. Calculation:Gross rent - Vacancy loss
Operating income:
| $10,528 | $126,336 |
Operating Expenses
| % Rent | Monthly | Yearly | |
|---|---|---|---|
Property TaxesAnnual taxes levied by local governments on real estate properties. These taxes fund public services like schools, roads, and emergency services. | 21% | -$2,392 | -$28,709 |
InsuranceThe costs for insurance coverage to protect against financial losses due to risks like fire, natural disasters, theft, liability, or tenant-related damages. Calculation:Assumes 7% of gross rental income, unless insurance rates are specified. | 7% | -$784 | -$9,408 |
Property ManagementThe costs associated with hiring a property manager to handle the day-to-day operations of a rental property. Includes management fees, leasing fes, eviction fees, etc. Calculation:Assumes 8% of gross rental income. | 8% | -$896 | -$10,752 |
Repairs & MaintenanceOngoing costs for routine upkeep and minor fixes needed to keep a property in good working condition. Calculation:Assumes 5% of gross rental income. Varies by property age and condition. | 5% | -$560 | -$6,720 |
Capital ExpensesLarge, infrequent costs for major improvements or replacements, like a new roof, HVAC system, or appliances. Calculation:Assumes 5% of gross rental income. Varies by property age. | 5% | -$560 | -$6,720 |
HOA FeesRegular dues paid to a Homeowners Association for community maintenance, amenities, and management. Similar fees include: Condo Association Fees, Co-op Maintenance Fees, etc. | n/a | n/a | n/a |
Operating ExpensesRecurring costs required to maintain and manage a rental property, including property taxes, insurance, maintenance, repairs, utilities (if paid by the owner), property management fees, and other day-to-day expenses. Calculation:Insurance + Property Taxes + Property Management + Repairs & Maintenance + Capital Expenditures + HOA Fees | 46% | -$5,192 | -$62,309 |
Cash Flow
| Monthly | Yearly | |
|---|---|---|
Net Operating Income (NOI)The income generated from a property after deducting all operating expenses but before deducting mortgage payments, taxes, and capital expenditures. Calculation:Gross Operating Income - Operating Expenses
Net operating income:
| $5,336 | $64,032 |
Mortgage PaymentThe fixed amount a borrower pays each month to repay a loan. It typically includes principal and interest (P&I) and may also cover property taxes, insurance, HOA fees, and PMI if escrowed. | -$14,153 | -$169,836 |
Cash FlowNet Operating Income (NOI) minus mortgage payments. Calculation:NOI - Mortgage Payments | -$8,817 | -$105,804 |