$795,000
Investment Summary
- Monthly Cash Flow
- -$2,260
- Cap Rate
- 2.7%
- Cash-on-Cash Return
- -14.8%
- Debt Coverage Ratio
- 0.44
- Internal Rate of Return (5 years)
- -10.3%
Cash Flow
Net Operating Income (NOI) minus mortgage payments.
Calculation:
NOI - Mortgage Payments
Cap Rate (Market Value)
Capitalization Rate is a rate of return that compares the yearly Net Operating Income (NOI) to the market value.
Calculation:
NOI / Market Value
Cash-on-Cash Return (CoC)
Annual Cash Flow / Cash Invested
Calculation:
Annual cash flow divided by initial cash invested.
Debt Coverage Ratio (DCR)
Net Operating Income (NOI) divided by total debt payments.
Calculation:
NOI / Total Debt Payments
Internal Rate of Return (IRR)
A metric for assessing profitability over time. IRR is the discount rate at which the net present value (NPV) of all future cash flows (positive and negative) from an investment equals zero — including both periodic cash flow (such as rent) and a projected sale at the end of the holding period. It represents the expected annualized return, accounting for income, expenses, and the recovery of capital through a future sale.
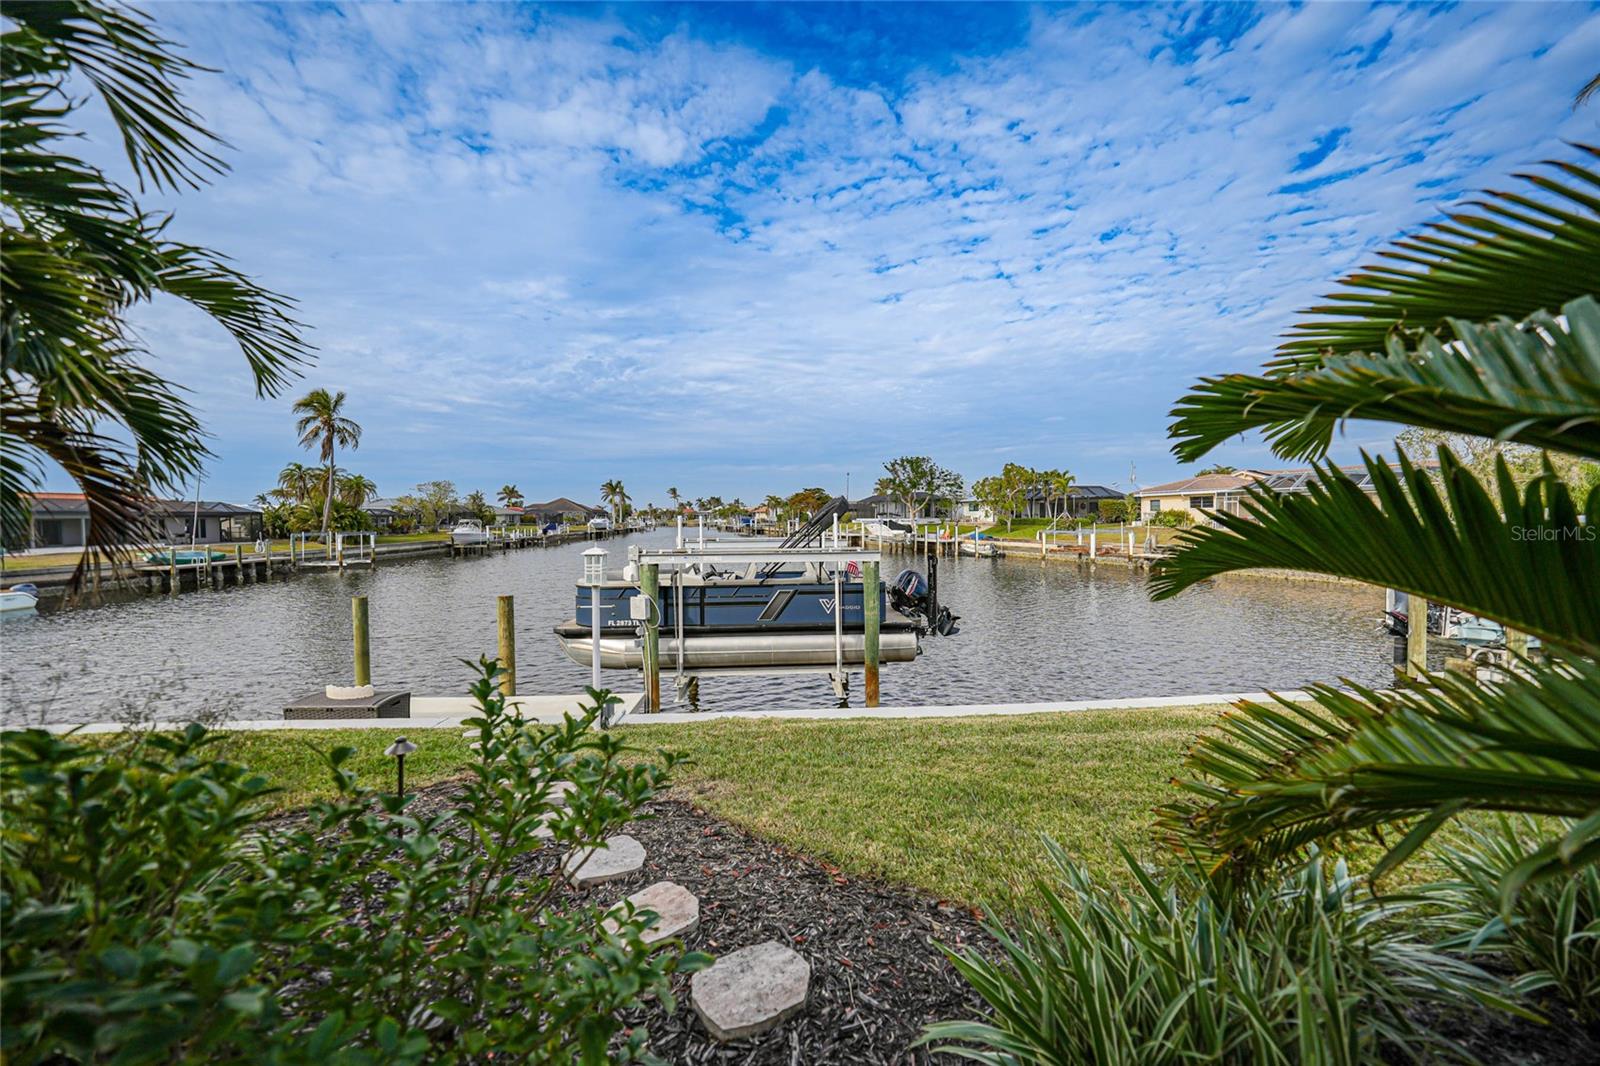
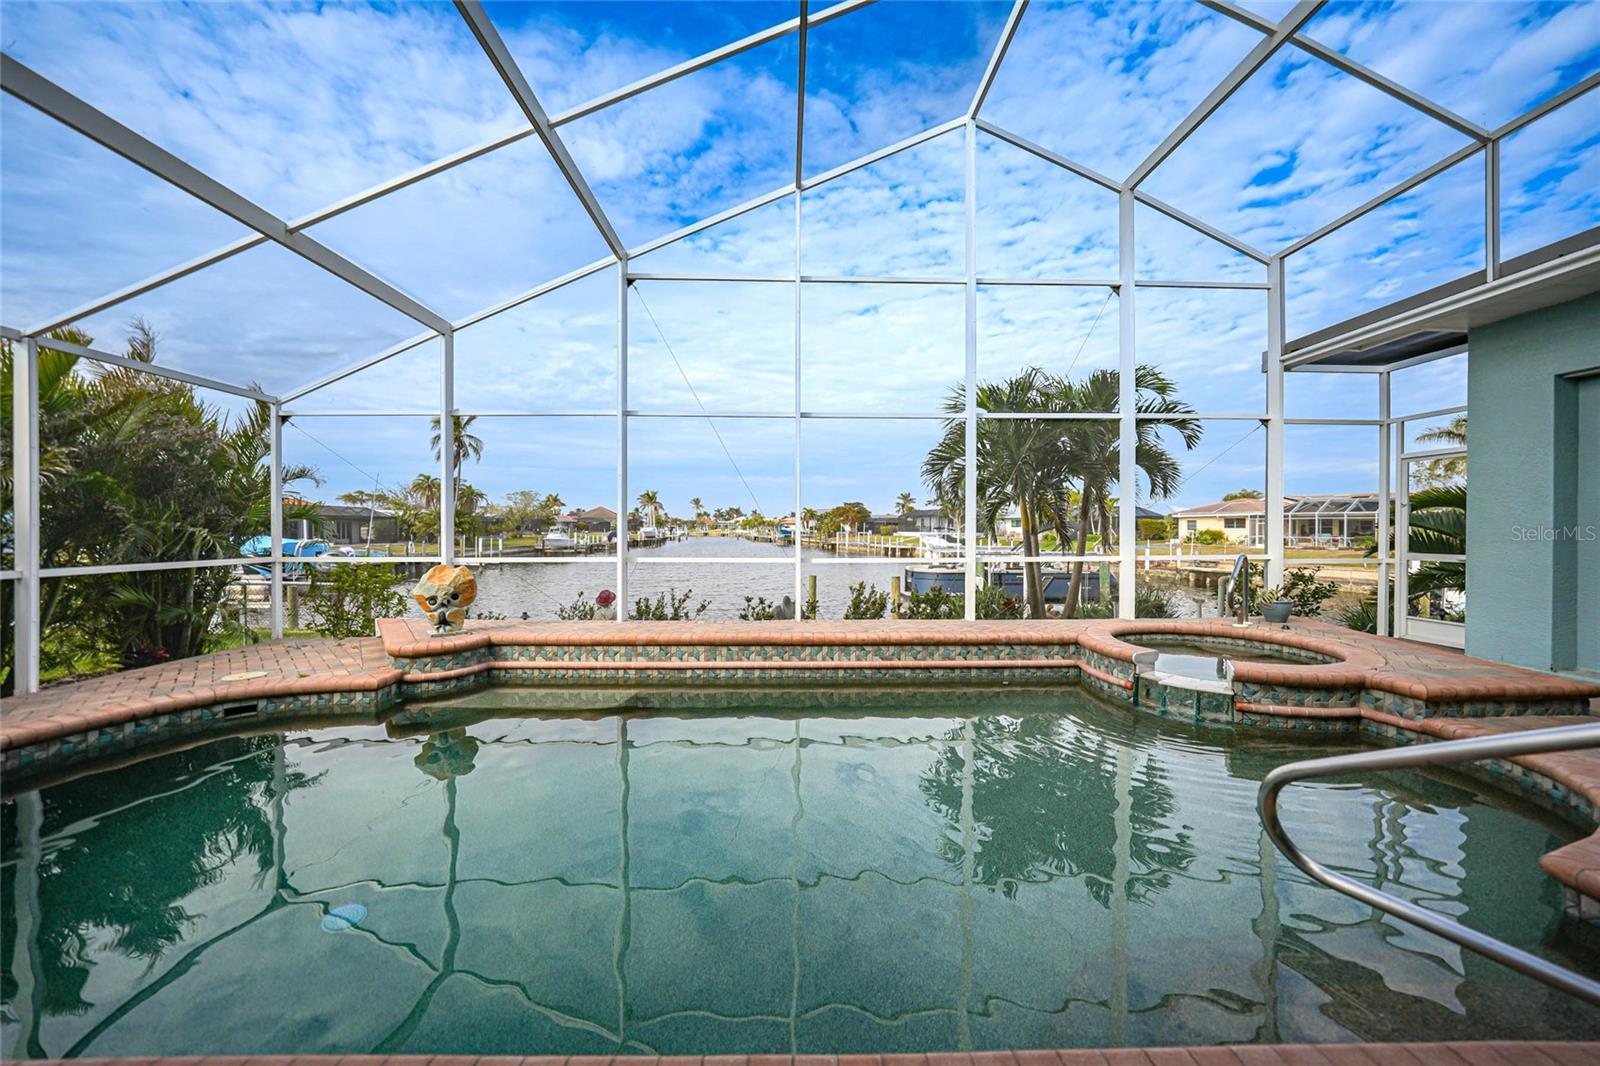
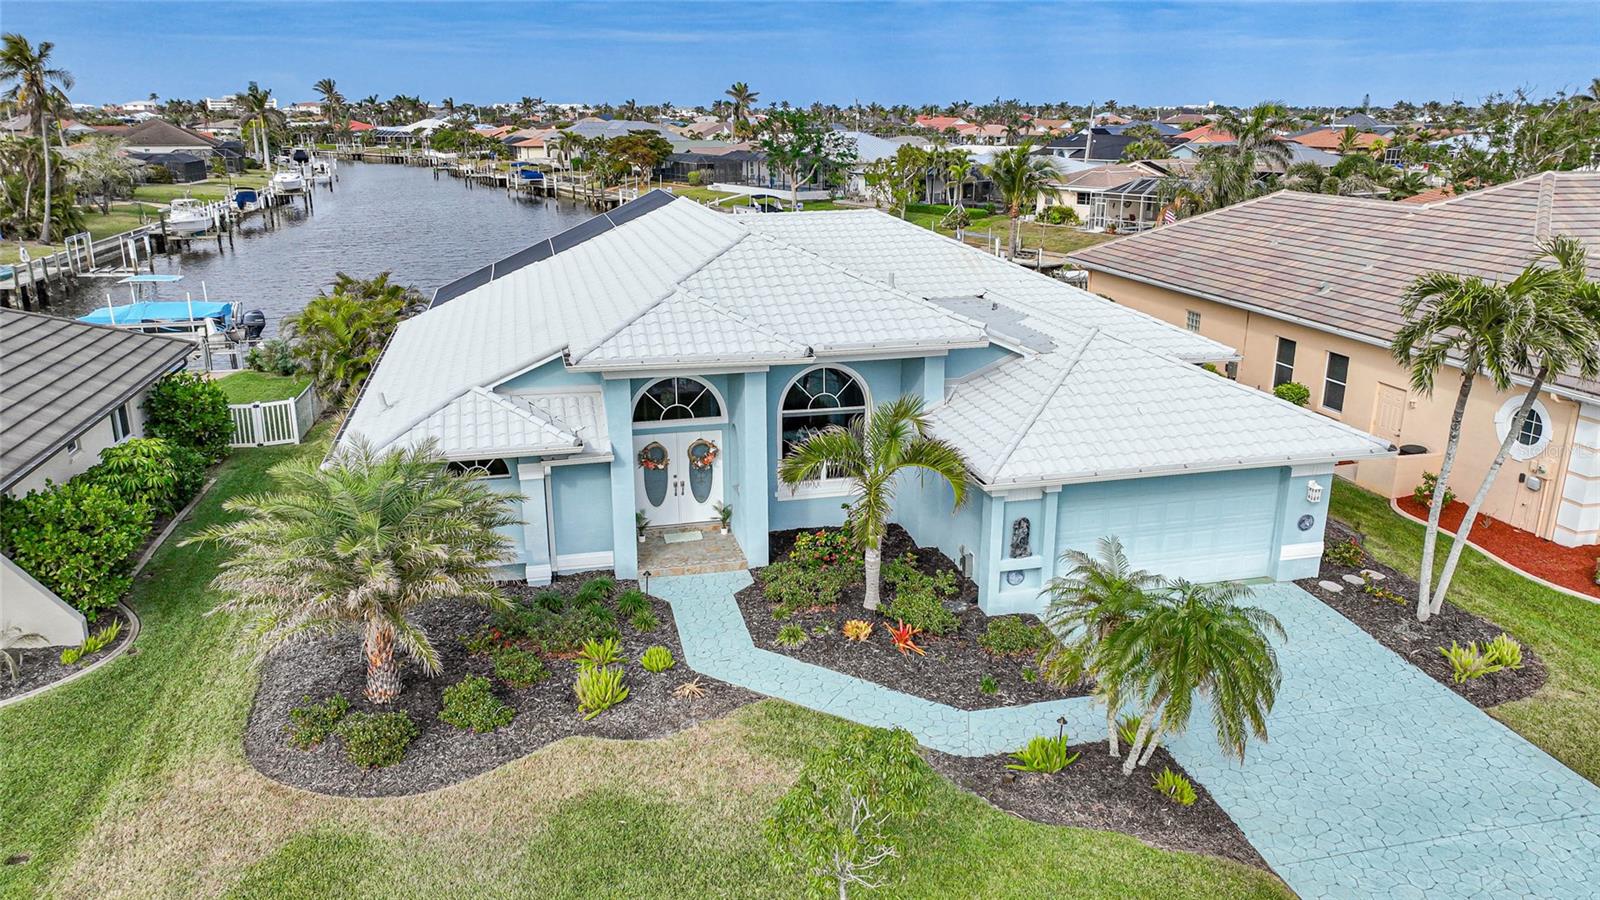
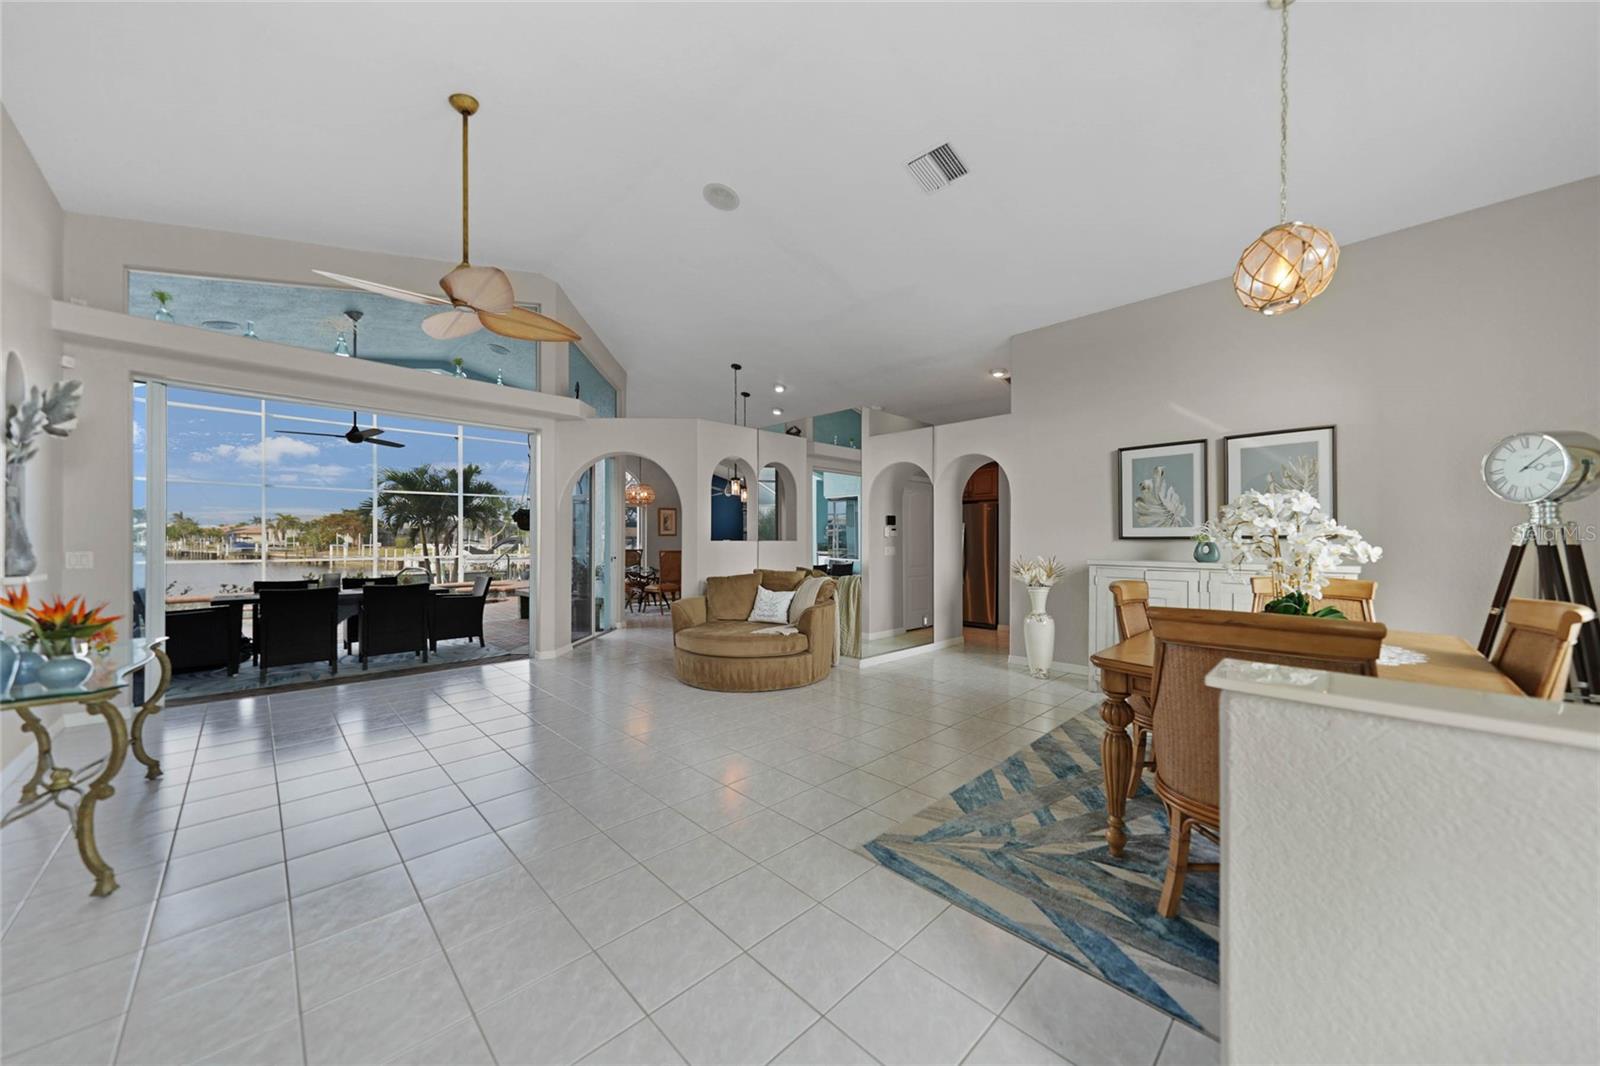
Property Description
Welcome to your ultimate waterfront retreat in Punta Gorda Isles, where stunning long-water views and just 12-minute powerboat access to Charlotte Harbor and the Gulf of Mexico await! This exquisite 3-bedroom, 3-bath pool home offers 2,367 square feet of luxurious open/split living space. As you step through the living and dining areas, you’ll be immediately struck by the open floor plan, soaring ceilings, and elegant built-in features. Arched entryways and contemporary lighting enhance the home’s stylish ambiance. Disappearing sliders seamlessly connect the interior to the pool and lanai area, creating a perfect flow for indoor-outdoor living. The gourmet kitchen is truly a chef’s paradise, boasting a breakfast bar, stainless steel appliances—including a new dishwasher—a wine cooler, and an abundance of raised-panel cabinetry with elegant crown molding. A spacious pantry provides ample storage, while the kitchen overlooks the inviting casual dining nook with views. From here, continue into the beautifully updated family room, where an electric fireplace serves as a stunning focal point. Luxury vinyl tile flooring throughout the family room and bedrooms adds a modern, sleek touch to the home’s overall appeal. The split floor plan ensures privacy, with the primary suite offering direct access to the lanai through sliding doors and an aquarium window that floods the room with natural light. The spa-inspired master bath is a true sanctuary, featuring custom tile work, dual sinks, a garden tub, and a Roman shower. Two generously sized guest bedrooms, each featuring built-in closets and plantation shutters, share a beautifully appointed bathroom complete with a Roman shower. With all systems replaced within the past 5 years—including HVAC, tankless hot water heater and water filtration system—this home provides peace of mind for its new owner. Step outside to enjoy the new stone-coated metal roof, a spacious covered lanai ideal for outdoor entertaining, a convenient pool bath, a screened and heated pool with new variable speed pump/heater, and an in-ground spa with new motor, all surrounded by updated lush landscaping with updated irrigation. A walkway leads to the new cement dock and 80’ of seawall (maintained by the city) and features a water/electric and a 16,000 lb boat lift for your convenience. M&S full house audio and intercom system, laundry room and 2-car garage complete the package. Situated in a sought-after golf and boating community, this home is just minutes from the Punta Gorda Yacht Club, Fishermen's Village, and historic downtown Punta Gorda. Indulge in world-class fishing, boating, arts, fine dining, and entertainment, or explore the nearby parks and pristine SWFL beaches. This meticulously maintained, single-owner home radiates pride of ownership and offers a lifestyle that’s truly unmatched.
Build Your Team
Quickly find investor-friendly professionals who can help you succeed in real estate investing at any stage of the investing journey.


Agents
Match with investor-friendly agents who can help you find, analyze, and close your next deal


Lenders
Get the best funding…find investor-friendly lenders who specialize in your deal strategy


Property Managers
Transition to passive investing. Find a trusted property management partnership that lasts.


Tax Pros & Accountants
Taxes and financial reporting made easy—find experts to create tax savings strategies, file taxes, and more
Location
Property Details
Parking
- Description: Driveway, Garage Door Opener
- Details: Driveway, Garage Door Opener, Attached
- Garage Spaces: 2
- Spaces Total: 0
Bedroom Information
- # of Bedrooms: 3
Bathroom Information
- # of Baths (Full): 3
- # of Baths (Total): 3.0
Interior Features
- # of Rooms: 9
- # of Stories: 1
- Fireplace: Yes
Exterior Features
- Exterior Walls Materials: Concrete Block
- Foundation: Slab
- Roof Material: Metal
- Pool: Yes
Land Information
- Land Use: Residential
- Land Use Subtype: Single Family Residential
Lot Information
- Parcel ID: 412213127018
- Lot Size: 9600 sqft
Property Information
- Property Type: Single Family Residence
- Style: Florida
- Year Built: 1996
Tax Information
- Annual Tax: $12,206
Utilities
- Water & Sewer: Public
- Heating: Central, Electric
- Cooling: Central Air
Location
- County: Charlotte
Listing Details
Investment Summary
- Monthly Cash Flow
- -$2,260
- Cap Rate
- 2.7%
- Cash-on-Cash Return
- -14.8%
- Debt Coverage Ratio
- 0.44
- Internal Rate of Return (5 years)
- -10.3%
Cash Flow
Net Operating Income (NOI) minus mortgage payments.
Calculation:
NOI - Mortgage Payments
Cap Rate (Market Value)
Capitalization Rate is a rate of return that compares the yearly Net Operating Income (NOI) to the market value.
Calculation:
NOI / Market Value
Cash-on-Cash Return (CoC)
Annual Cash Flow / Cash Invested
Calculation:
Annual cash flow divided by initial cash invested.
Debt Coverage Ratio (DCR)
Net Operating Income (NOI) divided by total debt payments.
Calculation:
NOI / Total Debt Payments
Internal Rate of Return (IRR)
A metric for assessing profitability over time. IRR is the discount rate at which the net present value (NPV) of all future cash flows (positive and negative) from an investment equals zero — including both periodic cash flow (such as rent) and a projected sale at the end of the holding period. It represents the expected annualized return, accounting for income, expenses, and the recovery of capital through a future sale.
Purchase Details
Purchase PriceThe price paid for the property. Purchase price:
| $795,000 |
|---|---|
Amount FinancedThe amount of the purchase financed through a loan. Amount financed:
| -$636,000 |
Down paymentThe initial payment made towards the purchase. Down payment:
| $159,000 |
Closing CostsFees and expenses associated with purchasing a property, typically ranging from 2% to 5% of the home’s purchase price, paid at the end of a home purchase to cover services like lending, title transfer, and taxes. Closing costs:
| $23,850 |
Rehab CostsCosts incurred to repair or improve the property, including: roof, flooring, exterior siding, kitchen, exterior paint, bathrooms, etc. Rehab costs:
| $0 |
Initial Cash InvestedThe total initial cash invested in the property. Calculation:Down payment + Buying costs + Rehab costs Initial cash invested:
| $182,850 |
Square Feet (SQFT)The total square footage of the property. Square feet:
| 2,367 |
Cost Per Square FootCost per square foot of the property. Calculation:Purchase Price / Square Feet Cost per square foot:
| $336 |
Monthly Rent Per Square FootMonthly rent divided by the number of square feet. This ratio helps investors compare rental income efficiency across properties, markets, and unit sizes Calculation:Monthly Rent / Square Feet Monthly rent per square foot:
| $1.73 |
Financing Details
Loan AmountThe total sum of money borrowed from a lender to finance a property purchase. Calculation:Purchase Price - Down Payment
Loan amount:
| $636,000 |
|---|---|
Loan to Value Ratio (LTV)Loan amount divided by the market value of the property. Calculation:Loan Amount / Market Value
Loan to value ratio:
| 80.0% |
Loan TypeThe type of loan (e.g., fixed, adjustable).
Loan type:
| Amortizing |
TermThe loan repayment period in years.
Term:
| 30 years |
Interest RateThe percentage a lender charges on the borrowed amount of a loan, determining the cost of borrowing money.
Interest rate:
| 6.625% |
Principal & Interest (PI)The principal is the portion of the loan payment that reduces the loan balance. The interest is the lender's charge for borrowing money. Calculation:(P * r * (1 + r) ** n) / ((1 + r) ** n - 1) Where:
P = Loan amount (principal)
Principal & interest:
| $4,072 |
Property TaxesAnnual taxes levied by local governments on real estate properties. These taxes fund public services like schools, roads, and emergency services.
Property tax:
| $1,017 |
InsuranceThe costs for insurance coverage to protect against financial losses due to risks like fire, natural disasters, theft, liability, or tenant-related damages. Calculation:Assumes 7% of gross rental income, unless insurance rates are specified.
Insurance:
| $287 |
Private Mortgage Insurance (PMI)A fee that borrowers pay when they take out a conventional loan with a loan-to-value (LTV) ratio above 80%.
Private mortgage insurance (PMI):
| $0 |
Monthly PaymentThe fixed amount a borrower pays each month to repay a loan. It typically includes principal and interest (P&I) and may also cover property taxes, insurance, HOA fees, and PMI if escrowed. Monthly payment:
| $5,376 |
Operating Income
| % Rent | Monthly | Yearly | |
|---|---|---|---|
Gross RentThe total rental income received from tenants before deducting any expenses. Includes base rent, late fees, pet fees, parking fees, and other recurring charges.
Gross rent:
| $4,100 | $49,200 | |
Vacancy LossExpected loss of rent due to vacancies.
Vacancy loss:
(6%)
| 6% | -$246 | -$2,952 |
Operating IncomeGross rental income minus vacancy loss. Calculation:Gross rent - Vacancy loss
Operating income:
| $3,854 | $46,248 |
Operating Expenses
| % Rent | Monthly | Yearly | |
|---|---|---|---|
Property TaxesAnnual taxes levied by local governments on real estate properties. These taxes fund public services like schools, roads, and emergency services. | 25% | -$1,017 | -$12,206 |
InsuranceThe costs for insurance coverage to protect against financial losses due to risks like fire, natural disasters, theft, liability, or tenant-related damages. Calculation:Assumes 7% of gross rental income, unless insurance rates are specified. | 7% | -$287 | -$3,444 |
Property ManagementThe costs associated with hiring a property manager to handle the day-to-day operations of a rental property. Includes management fees, leasing fes, eviction fees, etc. Calculation:Assumes 8% of gross rental income. | 8% | -$328 | -$3,936 |
Repairs & MaintenanceOngoing costs for routine upkeep and minor fixes needed to keep a property in good working condition. Calculation:Assumes 5% of gross rental income. Varies by property age and condition. | 5% | -$205 | -$2,460 |
Capital ExpensesLarge, infrequent costs for major improvements or replacements, like a new roof, HVAC system, or appliances. Calculation:Assumes 5% of gross rental income. Varies by property age. | 5% | -$205 | -$2,460 |
HOA FeesRegular dues paid to a Homeowners Association for community maintenance, amenities, and management. Similar fees include: Condo Association Fees, Co-op Maintenance Fees, etc. | n/a | n/a | n/a |
Operating ExpensesRecurring costs required to maintain and manage a rental property, including property taxes, insurance, maintenance, repairs, utilities (if paid by the owner), property management fees, and other day-to-day expenses. Calculation:Insurance + Property Taxes + Property Management + Repairs & Maintenance + Capital Expenditures + HOA Fees | 50% | -$2,042 | -$24,506 |
Cash Flow
| Monthly | Yearly | |
|---|---|---|
Net Operating Income (NOI)The income generated from a property after deducting all operating expenses but before deducting mortgage payments, taxes, and capital expenditures. Calculation:Gross Operating Income - Operating Expenses
Net operating income:
| $1,812 | $21,744 |
Mortgage PaymentThe fixed amount a borrower pays each month to repay a loan. It typically includes principal and interest (P&I) and may also cover property taxes, insurance, HOA fees, and PMI if escrowed. | -$4,072 | -$48,864 |
Cash FlowNet Operating Income (NOI) minus mortgage payments. Calculation:NOI - Mortgage Payments | $2,260 | $27,120 |