
$2,269,000
Investment Summary
- Monthly Cash Flow
- -$9,497
- Cap Rate
- 1.2%
- Cash-on-Cash Return
- -21.8%
- Debt Coverage Ratio
- 0.20
- Internal Rate of Return (5 years)
- -17.1%
Cash Flow
Net Operating Income (NOI) minus mortgage payments.
Calculation:
NOI - Mortgage Payments
Cap Rate (Market Value)
Capitalization Rate is a rate of return that compares the yearly Net Operating Income (NOI) to the market value.
Calculation:
NOI / Market Value
Cash-on-Cash Return (CoC)
Annual Cash Flow / Cash Invested
Calculation:
Annual cash flow divided by initial cash invested.
Debt Coverage Ratio (DCR)
Net Operating Income (NOI) divided by total debt payments.
Calculation:
NOI / Total Debt Payments
Internal Rate of Return (IRR)
A metric for assessing profitability over time. IRR is the discount rate at which the net present value (NPV) of all future cash flows (positive and negative) from an investment equals zero — including both periodic cash flow (such as rent) and a projected sale at the end of the holding period. It represents the expected annualized return, accounting for income, expenses, and the recovery of capital through a future sale.
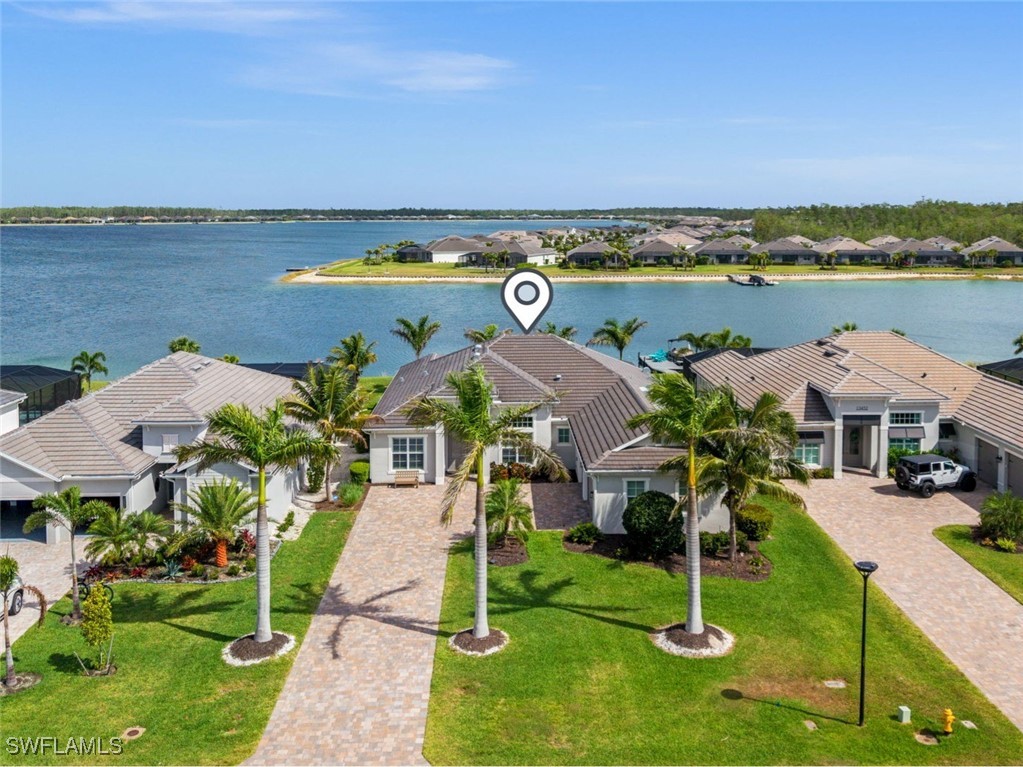
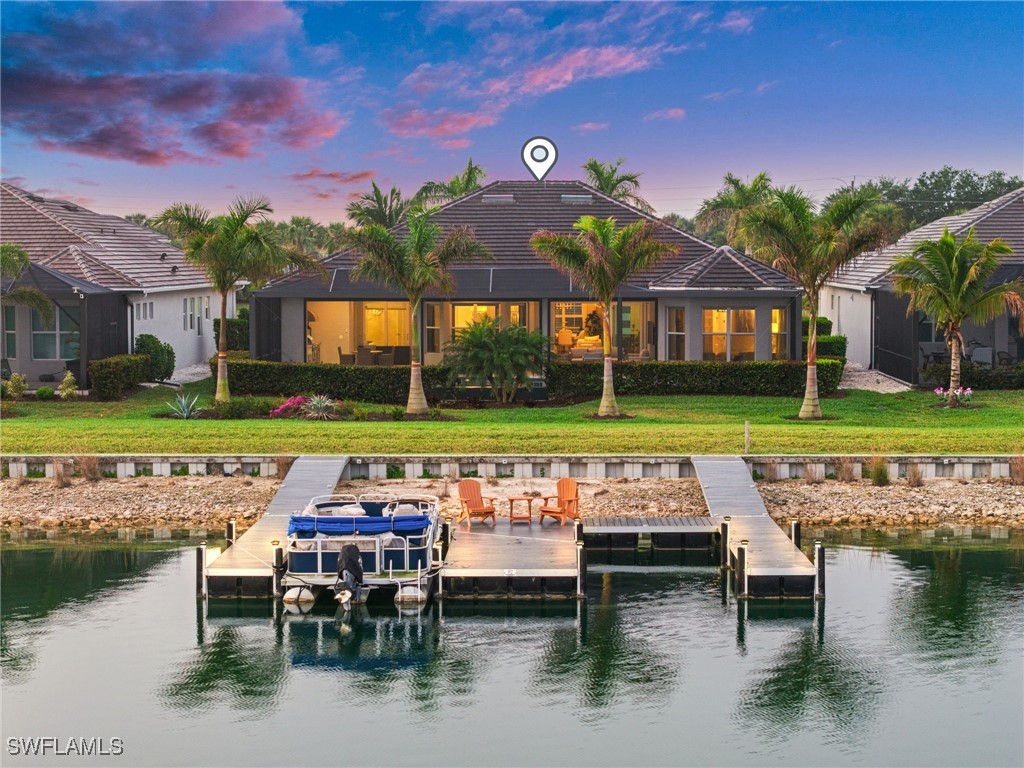
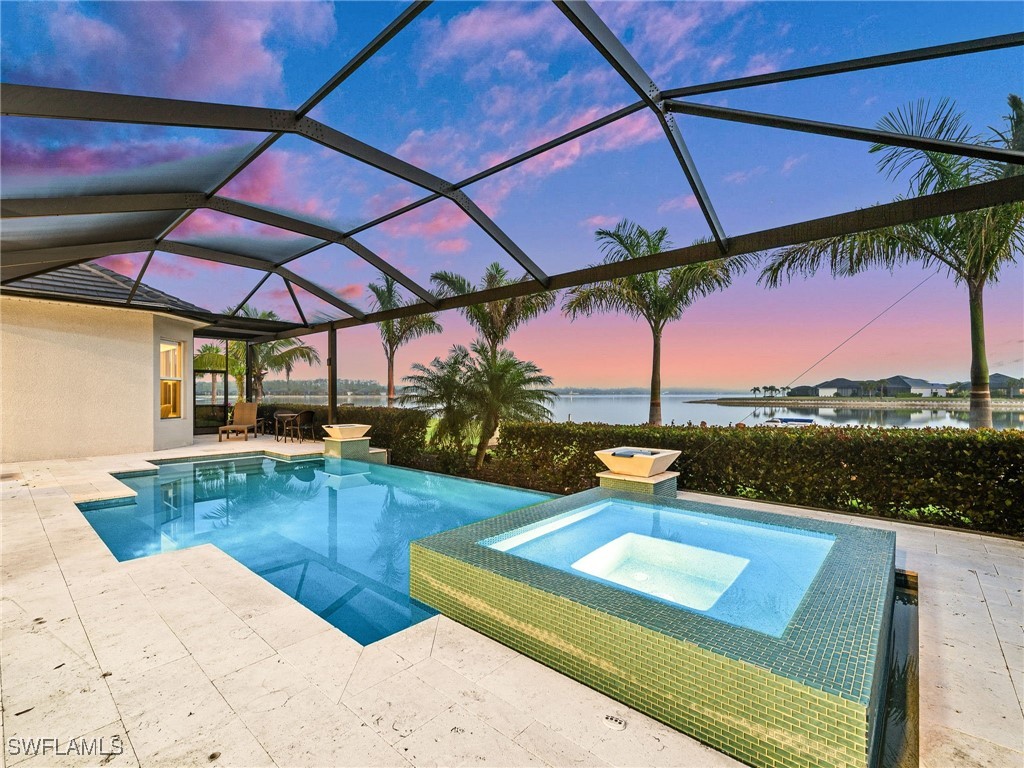
Property Description
Introducing the Premier Executive Estate – the famous showcase “Bougainvillea Model” – a Masterpiece with a double boat dock in the prestigious WildBlue community. As a former model, it features the highest builder upgrades. The owners elevated this waterfront estate further into a custom-designed residence, with upgrades over $549,000 - now boasting designer furnishings and structural enhancements far surpassing like-kind homes! This turnkey estate boasts the most amazing flooring and so many bespoke features – too many to list! It is a RARE MASTERPIECE and a must-see! The highly desirable floor plan offers 4 bedrooms, 3 bathrooms, an air-conditioned and insulated 3-car garage, a heated pool with spa, summer kitchen, and an extraordinary DOUBLE BOAT DOCK – offering the ultimate in outdoor living and boating luxury. EXCEPTIONAL UPGRADES added after purchase include top-tier luxury furniture and new outdoor patio sets (approx $150,000) and spectacular flooring throughout. The striking Italian Reves Blue Glossy Porcelain Tile (24” x 48”), accented by custom marble insets, flows elegantly through the entrance, living room, kitchen, formal dining, hallway, powder bath, laundry and office. A dramatic marble inlay at the entrance is mirrored by a 2nd marble feature at the fireplace, both providing stunning architectural detail. All 3 baths have been completely renovated, including new tile, shower floors and frameless glass enclosures. Additional upgrades include new baseboards, fresh paint, Hunter Douglas blinds, and matching Louver Hunter Douglas shutters in the dining room and office. Other luxury features include a central vac system, 3 AC units, a Kinetico water softener, and high-end appliances – including a GE refrigerator with built-in coffee maker! Exterior features include a DOUBLE BOAT DOCK with beautiful solar lighting, adding to the evening ambiance. The professionally designed landscaping showcases 3 majestic 28-foot King Palms and lush landscaping in both front and back.The outdoors is a true oasis – complete with a new firepit, exclusive outdoor furniture, and a 65" outdoor swivel TV – perfect for entertaining or relaxing in style. The ADT security system includes 4 exterior cameras and a doorbell camera. The insulated garage features steel ceiling-mounted garage storage racks providing added functionality and organization. WORLD-CLASS AMENITIES and a vibrant lifestyle await! With over 800 acres of freshwater lakes, WildBlue invites boaters and water sports enthusiasts from a boat launch to a 20-acre amenity campus boasts a fitness club, lap pool, day spa, pickleball, tennis, basketball, and more! The Clubhouse has a resort-style pool, restaurant, poolside bar, a private sand beach and cabanas. You will appreciate the convenience of nearby Gulf Coast Town Center, Coconut Point Mall, RSW International Airport, and more. ULTIMATE LUXURY. UNRIVALED LOCATION. Welcome to your dream home!
Build Your Team
Quickly find investor-friendly professionals who can help you succeed in real estate investing at any stage of the investing journey.


Agents
Match with investor-friendly agents who can help you find, analyze, and close your next deal


Lenders
Get the best funding…find investor-friendly lenders who specialize in your deal strategy


Property Managers
Transition to passive investing. Find a trusted property management partnership that lasts.


Tax Pros & Accountants
Taxes and financial reporting made easy—find experts to create tax savings strategies, file taxes, and more
Location
Property Details
Parking
- Description: Garage
- Details: Attached, Garage, Garage Door Opener
- Garage Spaces: 3
- Spaces Total: 0
Bedroom Information
- # of Bedrooms: 4
Bathroom Information
- # of Baths (Full): 3
- # of Baths (Total): 3.0
Interior Features
- # of Stories: 1
- Fireplace: Yes
Exterior Features
- Exterior Walls Materials: Stucco
- Foundation: Raised
- Roof Type: IRR/Cathedral
- Roof Material: Tile
- Pool: Yes
HOA
- Has HOA: Yes
- HOA Fee: $1,331/quarterly
Land Information
- Land Use: Residential
- Land Use Subtype: Single Family Residential
Lot Information
- Parcel ID: 204626L310000.0090
- Lot Size: 0 sqft
Property Information
- Property Type: Single Family Residence
- Style: Contemporary, Ranch, One Story
- Year Built: 2019
Tax Information
- Annual Tax: $19,469
Utilities
- Water & Sewer: Public
- Heating: Central, Electric, Zoned
- Cooling: Central Air, Ceiling Fan(s), Electric, Gas, Humidity Control, Zoned
Location
- County: Lee
Listing Details
Investment Summary
- Monthly Cash Flow
- -$9,497
- Cap Rate
- 1.2%
- Cash-on-Cash Return
- -21.8%
- Debt Coverage Ratio
- 0.20
- Internal Rate of Return (5 years)
- -17.1%
Cash Flow
Net Operating Income (NOI) minus mortgage payments.
Calculation:
NOI - Mortgage Payments
Cap Rate (Market Value)
Capitalization Rate is a rate of return that compares the yearly Net Operating Income (NOI) to the market value.
Calculation:
NOI / Market Value
Cash-on-Cash Return (CoC)
Annual Cash Flow / Cash Invested
Calculation:
Annual cash flow divided by initial cash invested.
Debt Coverage Ratio (DCR)
Net Operating Income (NOI) divided by total debt payments.
Calculation:
NOI / Total Debt Payments
Internal Rate of Return (IRR)
A metric for assessing profitability over time. IRR is the discount rate at which the net present value (NPV) of all future cash flows (positive and negative) from an investment equals zero — including both periodic cash flow (such as rent) and a projected sale at the end of the holding period. It represents the expected annualized return, accounting for income, expenses, and the recovery of capital through a future sale.
Purchase Details
Purchase PriceThe price paid for the property. Purchase price:
| $2,269,000 |
|---|---|
Amount FinancedThe amount of the purchase financed through a loan. Amount financed:
| -$1,815,200 |
Down paymentThe initial payment made towards the purchase. Down payment:
| $453,800 |
Closing CostsFees and expenses associated with purchasing a property, typically ranging from 2% to 5% of the home’s purchase price, paid at the end of a home purchase to cover services like lending, title transfer, and taxes. Closing costs:
| $68,070 |
Rehab CostsCosts incurred to repair or improve the property, including: roof, flooring, exterior siding, kitchen, exterior paint, bathrooms, etc. Rehab costs:
| $0 |
Initial Cash InvestedThe total initial cash invested in the property. Calculation:Down payment + Buying costs + Rehab costs Initial cash invested:
| $521,870 |
Square Feet (SQFT)The total square footage of the property. Square feet:
| 2,801 |
Cost Per Square FootCost per square foot of the property. Calculation:Purchase Price / Square Feet Cost per square foot:
| $810 |
Monthly Rent Per Square FootMonthly rent divided by the number of square feet. This ratio helps investors compare rental income efficiency across properties, markets, and unit sizes Calculation:Monthly Rent / Square Feet Monthly rent per square foot:
| $2.28 |
Financing Details
Loan AmountThe total sum of money borrowed from a lender to finance a property purchase. Calculation:Purchase Price - Down Payment
Loan amount:
| $1,815,200 |
|---|---|
Loan to Value Ratio (LTV)Loan amount divided by the market value of the property. Calculation:Loan Amount / Market Value
Loan to value ratio:
| 80.0% |
Loan TypeThe type of loan (e.g., fixed, adjustable).
Loan type:
| Amortizing |
TermThe loan repayment period in years.
Term:
| 30 years |
Interest RateThe percentage a lender charges on the borrowed amount of a loan, determining the cost of borrowing money.
Interest rate:
| 6.810% |
Principal & Interest (PI)The principal is the portion of the loan payment that reduces the loan balance. The interest is the lender's charge for borrowing money. Calculation:(P * r * (1 + r) ** n) / ((1 + r) ** n - 1) Where:
P = Loan amount (principal)
Principal & interest:
| $11,846 |
Property TaxesAnnual taxes levied by local governments on real estate properties. These taxes fund public services like schools, roads, and emergency services.
Property tax:
| $1,623 |
InsuranceThe costs for insurance coverage to protect against financial losses due to risks like fire, natural disasters, theft, liability, or tenant-related damages. Calculation:Assumes 7% of gross rental income, unless insurance rates are specified.
Insurance:
| $448 |
Private Mortgage Insurance (PMI)A fee that borrowers pay when they take out a conventional loan with a loan-to-value (LTV) ratio above 80%.
Private mortgage insurance (PMI):
| $0 |
Monthly PaymentThe fixed amount a borrower pays each month to repay a loan. It typically includes principal and interest (P&I) and may also cover property taxes, insurance, HOA fees, and PMI if escrowed. Monthly payment:
| $13,917 |
Operating Income
| % Rent | Monthly | Yearly | |
|---|---|---|---|
Gross RentThe total rental income received from tenants before deducting any expenses. Includes base rent, late fees, pet fees, parking fees, and other recurring charges.
Gross rent:
| $6,400 | $76,800 | |
Vacancy LossExpected loss of rent due to vacancies.
Vacancy loss:
(6%)
| 6% | -$384 | -$4,608 |
Operating IncomeGross rental income minus vacancy loss. Calculation:Gross rent - Vacancy loss
Operating income:
| $6,016 | $72,192 |
Operating Expenses
| % Rent | Monthly | Yearly | |
|---|---|---|---|
Property TaxesAnnual taxes levied by local governments on real estate properties. These taxes fund public services like schools, roads, and emergency services. | 25% | -$1,623 | -$19,470 |
InsuranceThe costs for insurance coverage to protect against financial losses due to risks like fire, natural disasters, theft, liability, or tenant-related damages. Calculation:Assumes 7% of gross rental income, unless insurance rates are specified. | 7% | -$448 | -$5,376 |
Property ManagementThe costs associated with hiring a property manager to handle the day-to-day operations of a rental property. Includes management fees, leasing fes, eviction fees, etc. Calculation:Assumes 8% of gross rental income. | 8% | -$512 | -$6,144 |
Repairs & MaintenanceOngoing costs for routine upkeep and minor fixes needed to keep a property in good working condition. Calculation:Assumes 5% of gross rental income. Varies by property age and condition. | 5% | -$320 | -$3,840 |
Capital ExpensesLarge, infrequent costs for major improvements or replacements, like a new roof, HVAC system, or appliances. Calculation:Assumes 5% of gross rental income. Varies by property age. | 5% | -$320 | -$3,840 |
HOA FeesRegular dues paid to a Homeowners Association for community maintenance, amenities, and management. Similar fees include: Condo Association Fees, Co-op Maintenance Fees, etc. | 7% | -$444 | -$5,328 |
Operating ExpensesRecurring costs required to maintain and manage a rental property, including property taxes, insurance, maintenance, repairs, utilities (if paid by the owner), property management fees, and other day-to-day expenses. Calculation:Insurance + Property Taxes + Property Management + Repairs & Maintenance + Capital Expenditures + HOA Fees | 57% | -$3,667 | -$43,998 |
Cash Flow
| Monthly | Yearly | |
|---|---|---|
Net Operating Income (NOI)The income generated from a property after deducting all operating expenses but before deducting mortgage payments, taxes, and capital expenditures. Calculation:Gross Operating Income - Operating Expenses
Net operating income:
| $2,349 | $28,188 |
Mortgage PaymentThe fixed amount a borrower pays each month to repay a loan. It typically includes principal and interest (P&I) and may also cover property taxes, insurance, HOA fees, and PMI if escrowed. | -$11,846 | -$142,152 |
Cash FlowNet Operating Income (NOI) minus mortgage payments. Calculation:NOI - Mortgage Payments | $9,497 | $113,964 |