$419,500
Investment Summary
- Monthly Cash Flow
- -$1,086
- Cap Rate
- 3.0%
- Cash-on-Cash Return
- -13.5%
- Debt Coverage Ratio
- 0.49
- Internal Rate of Return (5 years)
- -9.1%
Cash Flow
Net Operating Income (NOI) minus mortgage payments.
Calculation:
NOI - Mortgage Payments
Cap Rate (Market Value)
Capitalization Rate is a rate of return that compares the yearly Net Operating Income (NOI) to the market value.
Calculation:
NOI / Market Value
Cash-on-Cash Return (CoC)
Annual Cash Flow / Cash Invested
Calculation:
Annual cash flow divided by initial cash invested.
Debt Coverage Ratio (DCR)
Net Operating Income (NOI) divided by total debt payments.
Calculation:
NOI / Total Debt Payments
Internal Rate of Return (IRR)
A metric for assessing profitability over time. IRR is the discount rate at which the net present value (NPV) of all future cash flows (positive and negative) from an investment equals zero — including both periodic cash flow (such as rent) and a projected sale at the end of the holding period. It represents the expected annualized return, accounting for income, expenses, and the recovery of capital through a future sale.
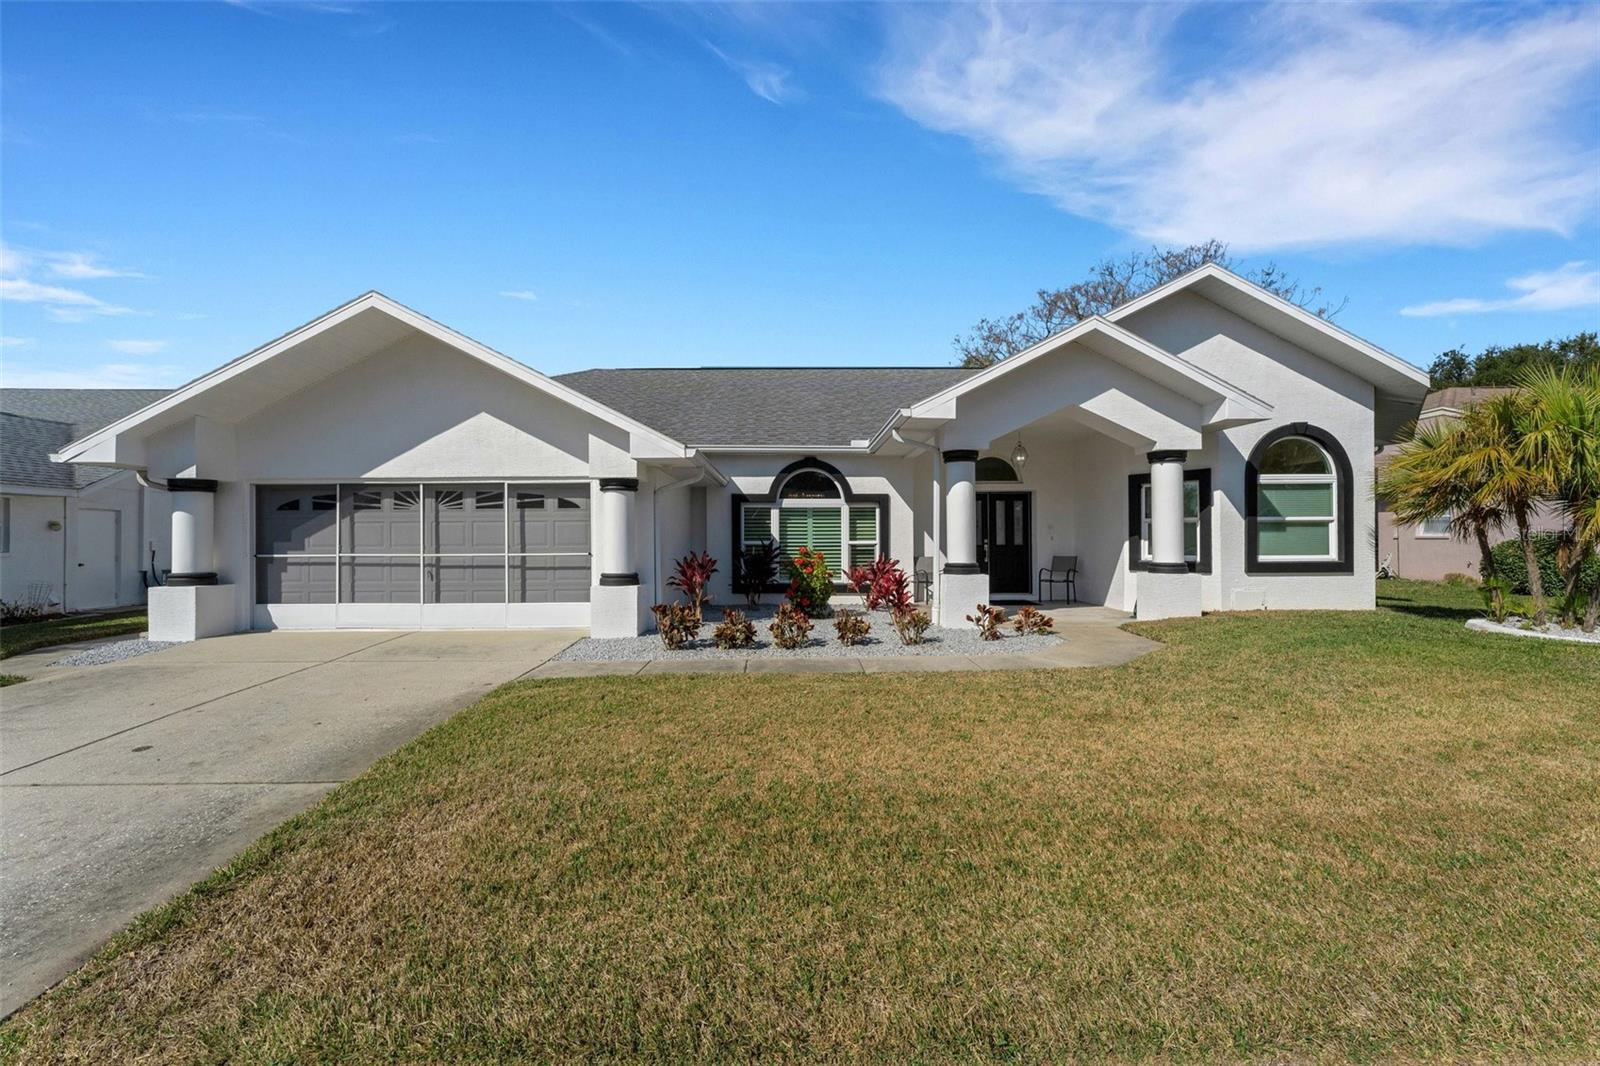
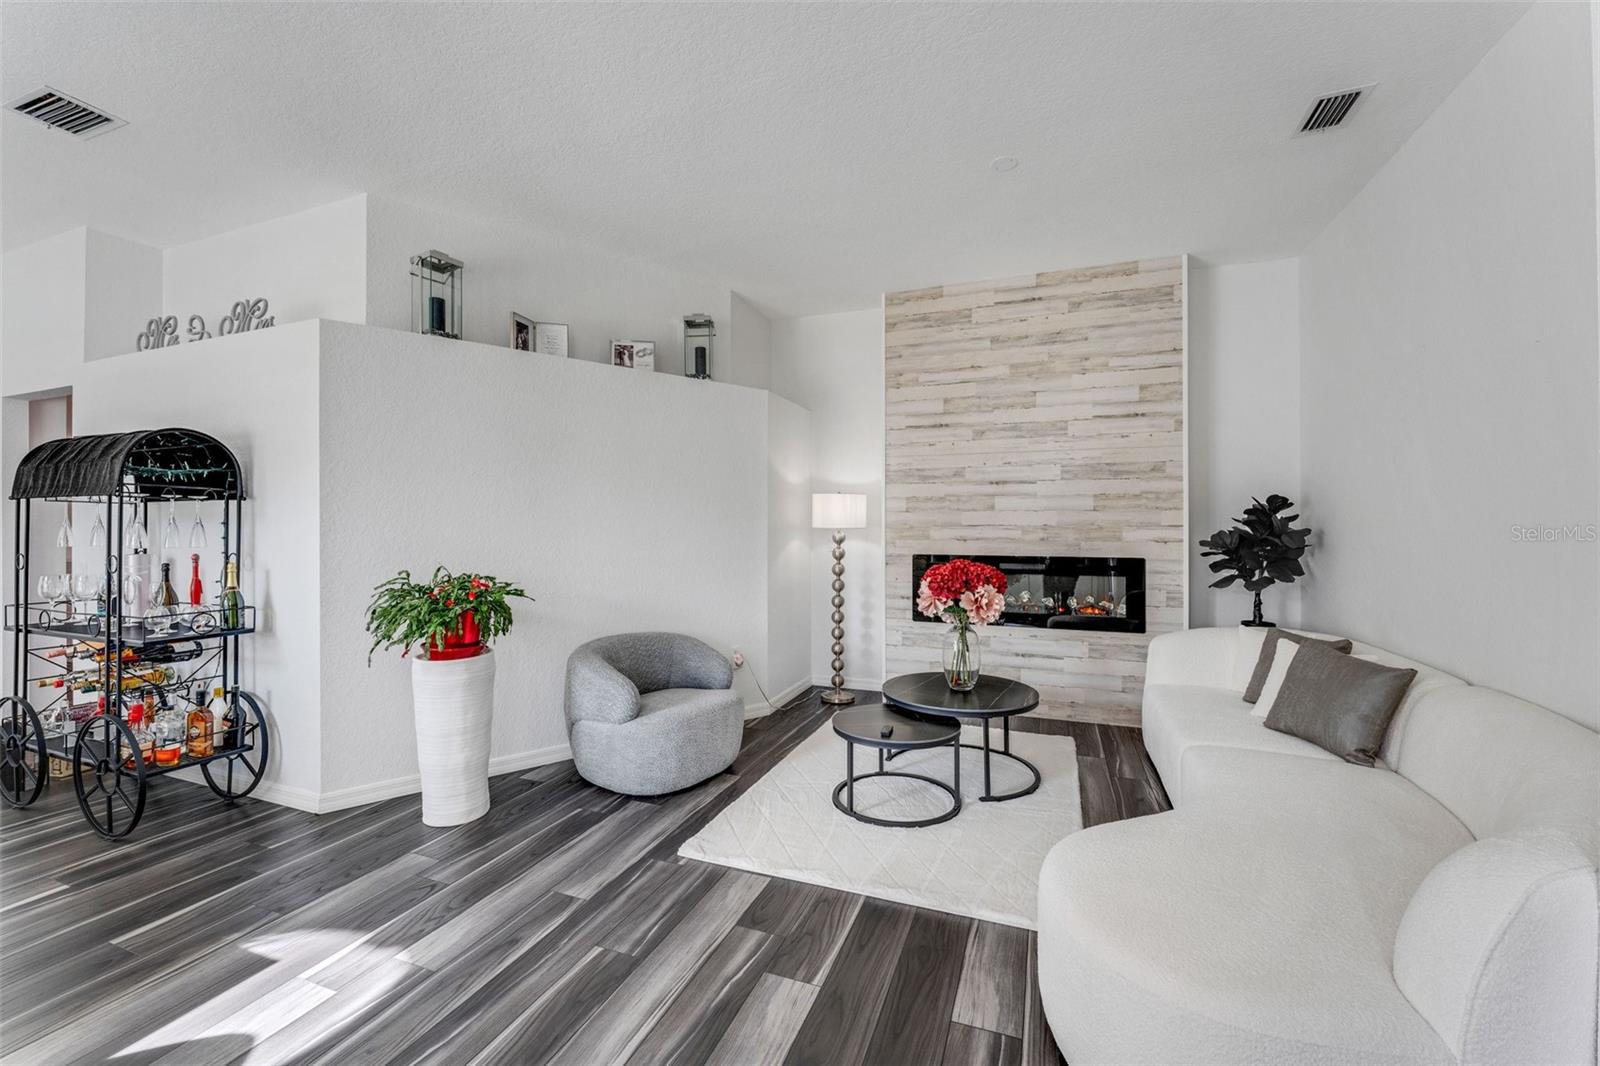
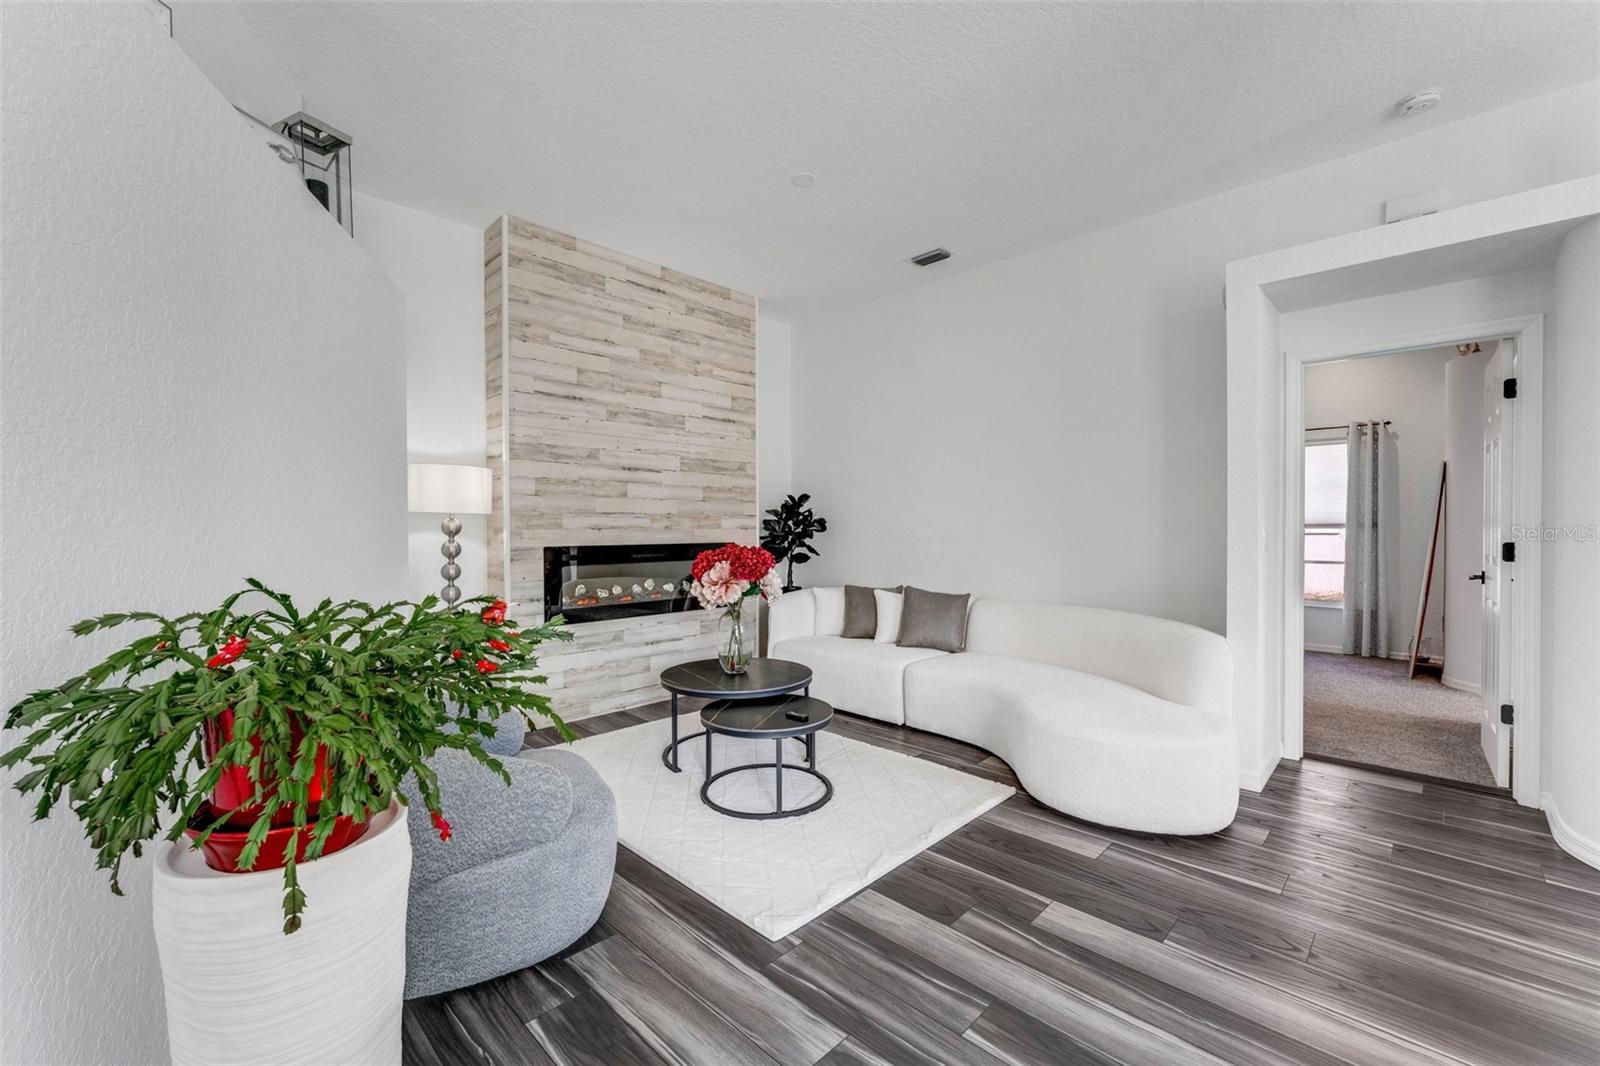
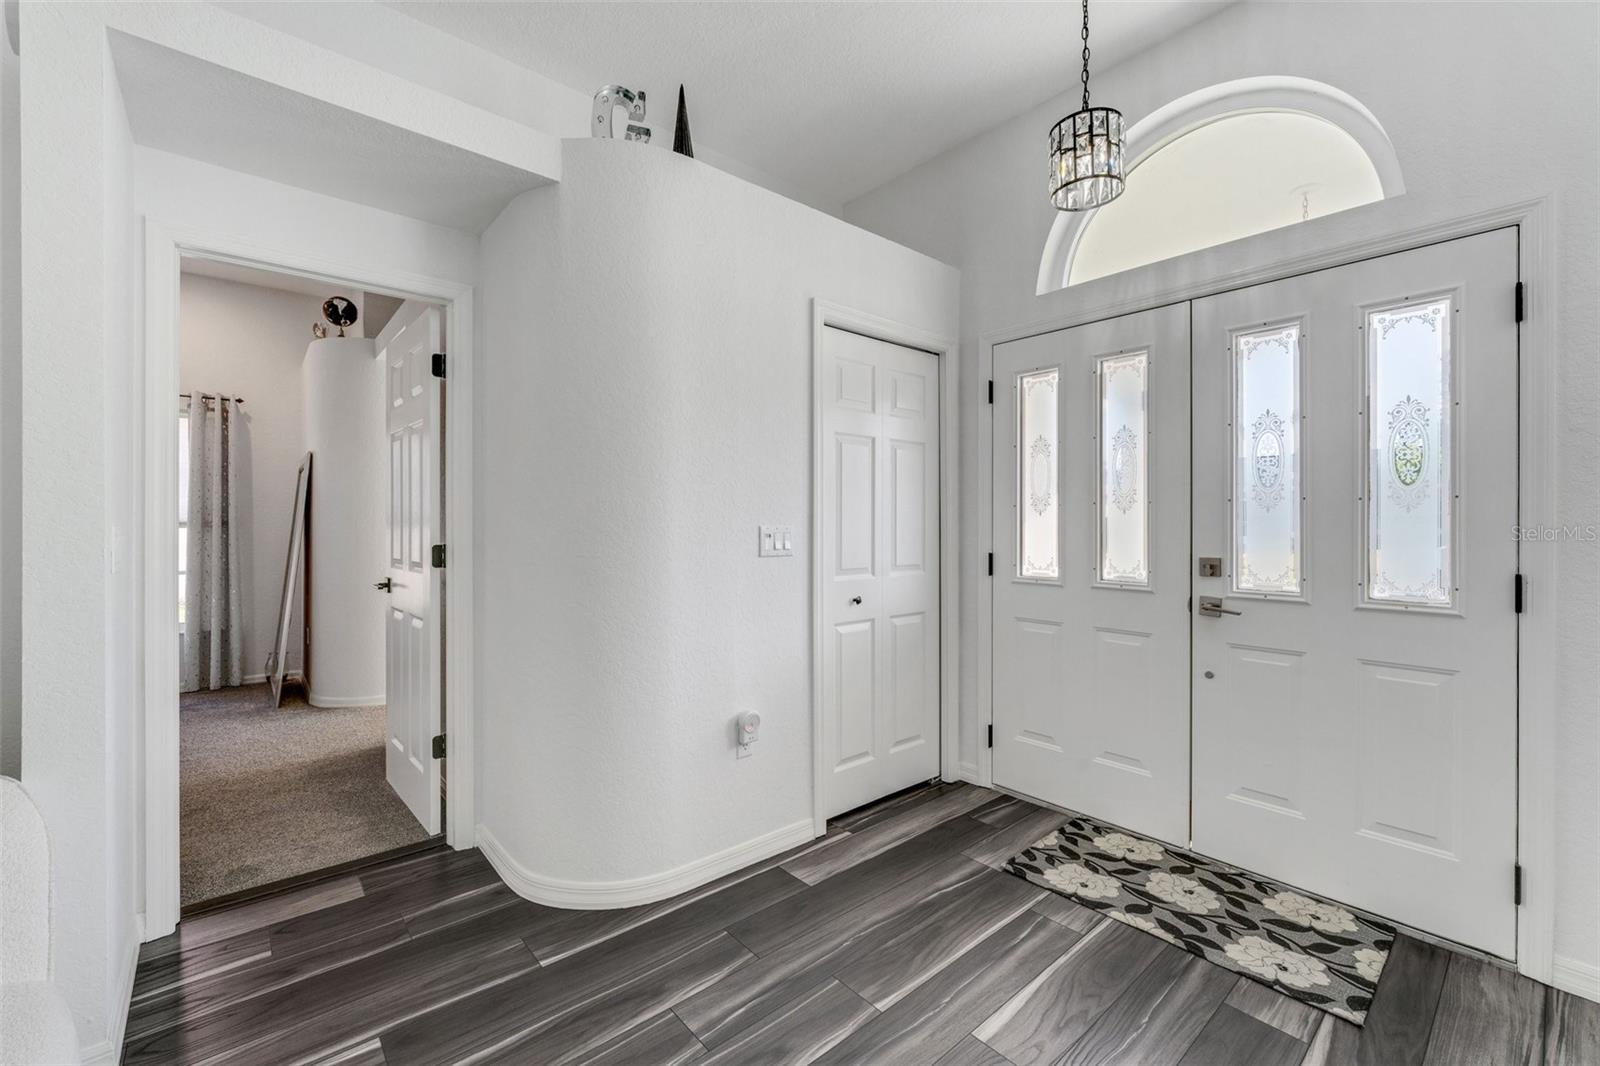
Property Description
Welcome to the home you've been waiting for! Located in the desirable Estates of Beacon Woods, this meticulously cared-for residence offers a spacious and functional layout, featuring 3 bedrooms with a split plan, a formal dining room, a living room, a great room, an eat-in kitchen, an office, and a 2-car air-conditioned garage with an additional workshop space. The garage is also equipped with a convenient screen door, allowing you to work in the space with the door open while being protected from bugs—perfect for enjoying the fresh air while keeping pests at bay! The home sits on a peaceful conservation lot, ensuring no rear neighbors and added privacy. Inside, you'll find new waterproof engineered hardwood floors throughout the main living areas, complemented by fresh carpeting in the bedrooms. The home has been updated with all new fixtures and recessed lighting in the living room, creating a bright and modern atmosphere. A new paver patio at the rear of the home provides an excellent space for outdoor relaxation, while an enclosed room off the kitchen/dining area features sliding glass doors on two sides, offering stunning views of both the main living space and the beautiful backyard. Additionally, an electric fireplace has been added to the sitting area off the primary suite, bringing a cozy touch to the space. Fresh interior and exterior paint, along with new landscaping and an irrigation system, enhance the home's curb appeal and functionality. A new HVAC system (installed in 2023) ensures comfort and efficiency year-round. The home also boasts several significant upgrades, including replacement impact windows installed in 2019 (valued at $25K) and a roof replacement in 2016. The kitchen has been thoughtfully designed with 27 extra shelves in the lower cabinets, providing ample storage. Heavy-duty roller bearing guides have been added to the two bathrooms and laundry room for smooth, easy access to stored items, while five enlarged kitchen and laundry room drawers feature self-closing roller bearing guides and dividers for added organization. The pantry has been upgraded with triple-decked shelving, allowing all canned goods to be visible and accessible. As part of the community, you'll enjoy access to a clubhouse that includes a community pool, lighted tennis courts, a fitness center, and a variety of organized activities ranging from exercise classes and dinner dances to games like cards, billiards, ping pong, and shuffleboard. The HOA takes care of lawn maintenance and exterior pest services, making upkeep a breeze! The location is convenient to hospitals, marinas, beaches, restaurants, shopping, major theme parks, highways, and both TPA and PIE international airports. Come see this incredible home today – with all these upgrades and features, you won’t be disappointed!
Build Your Team
Quickly find investor-friendly professionals who can help you succeed in real estate investing at any stage of the investing journey.


Agents
Match with investor-friendly agents who can help you find, analyze, and close your next deal


Lenders
Get the best funding…find investor-friendly lenders who specialize in your deal strategy


Property Managers
Transition to passive investing. Find a trusted property management partnership that lasts.


Tax Pros & Accountants
Taxes and financial reporting made easy—find experts to create tax savings strategies, file taxes, and more
Location
Property Details
Parking
- Description: Garage Door Opener, Workshop in Garage
- Details: Garage Door Opener, Workshop in Garage, Attached
- Garage Spaces: 2
- Spaces Total: 0
Bedroom Information
- # of Bedrooms: 3
Bathroom Information
- # of Baths (Full): 2
- # of Baths (Total): 2.0
Interior Features
- # of Rooms: 8
- # of Stories: 1
- Fireplace: Yes
Exterior Features
- Exterior Walls Materials: Concrete Block
- Foundation: Slab
- Roof Type: Gable
- Roof Material: Shingle
HOA
- Has HOA: Yes
- Association: Associate Golf Coast 727-577-2200
- HOA Fee: $525/quarterly
Land Information
- Land Use: Residential
- Land Use Subtype: Single Family Residential
Lot Information
- Parcel ID: 2624160050000000850
- Lot Size: 8893 sqft
Property Information
- Property Type: Single Family Residence
- Style: Florida
- Year Built: 1996
Tax Information
- Annual Tax: $5,847
Utilities
- Water & Sewer: Public
- Heating: Central
- Cooling: Central Air
Location
- County: Pasco
Listing Details
Investment Summary
- Monthly Cash Flow
- -$1,086
- Cap Rate
- 3.0%
- Cash-on-Cash Return
- -13.5%
- Debt Coverage Ratio
- 0.49
- Internal Rate of Return (5 years)
- -9.1%
Cash Flow
Net Operating Income (NOI) minus mortgage payments.
Calculation:
NOI - Mortgage Payments
Cap Rate (Market Value)
Capitalization Rate is a rate of return that compares the yearly Net Operating Income (NOI) to the market value.
Calculation:
NOI / Market Value
Cash-on-Cash Return (CoC)
Annual Cash Flow / Cash Invested
Calculation:
Annual cash flow divided by initial cash invested.
Debt Coverage Ratio (DCR)
Net Operating Income (NOI) divided by total debt payments.
Calculation:
NOI / Total Debt Payments
Internal Rate of Return (IRR)
A metric for assessing profitability over time. IRR is the discount rate at which the net present value (NPV) of all future cash flows (positive and negative) from an investment equals zero — including both periodic cash flow (such as rent) and a projected sale at the end of the holding period. It represents the expected annualized return, accounting for income, expenses, and the recovery of capital through a future sale.
Purchase Details
Purchase PriceThe price paid for the property. Purchase price:
| $419,500 |
|---|---|
Amount FinancedThe amount of the purchase financed through a loan. Amount financed:
| -$335,600 |
Down paymentThe initial payment made towards the purchase. Down payment:
| $83,900 |
Closing CostsFees and expenses associated with purchasing a property, typically ranging from 2% to 5% of the home’s purchase price, paid at the end of a home purchase to cover services like lending, title transfer, and taxes. Closing costs:
| $12,585 |
Rehab CostsCosts incurred to repair or improve the property, including: roof, flooring, exterior siding, kitchen, exterior paint, bathrooms, etc. Rehab costs:
| $0 |
Initial Cash InvestedThe total initial cash invested in the property. Calculation:Down payment + Buying costs + Rehab costs Initial cash invested:
| $96,485 |
Square Feet (SQFT)The total square footage of the property. Square feet:
| 2,197 |
Cost Per Square FootCost per square foot of the property. Calculation:Purchase Price / Square Feet Cost per square foot:
| $191 |
Monthly Rent Per Square FootMonthly rent divided by the number of square feet. This ratio helps investors compare rental income efficiency across properties, markets, and unit sizes Calculation:Monthly Rent / Square Feet Monthly rent per square foot:
| $1.14 |
Financing Details
Loan AmountThe total sum of money borrowed from a lender to finance a property purchase. Calculation:Purchase Price - Down Payment
Loan amount:
| $335,600 |
|---|---|
Loan to Value Ratio (LTV)Loan amount divided by the market value of the property. Calculation:Loan Amount / Market Value
Loan to value ratio:
| 80.0% |
Loan TypeThe type of loan (e.g., fixed, adjustable).
Loan type:
| Amortizing |
TermThe loan repayment period in years.
Term:
| 30 years |
Interest RateThe percentage a lender charges on the borrowed amount of a loan, determining the cost of borrowing money.
Interest rate:
| 6.625% |
Principal & Interest (PI)The principal is the portion of the loan payment that reduces the loan balance. The interest is the lender's charge for borrowing money. Calculation:(P * r * (1 + r) ** n) / ((1 + r) ** n - 1) Where:
P = Loan amount (principal)
Principal & interest:
| $2,149 |
Property TaxesAnnual taxes levied by local governments on real estate properties. These taxes fund public services like schools, roads, and emergency services.
Property tax:
| $487 |
InsuranceThe costs for insurance coverage to protect against financial losses due to risks like fire, natural disasters, theft, liability, or tenant-related damages. Calculation:Assumes 7% of gross rental income, unless insurance rates are specified.
Insurance:
| $175 |
Private Mortgage Insurance (PMI)A fee that borrowers pay when they take out a conventional loan with a loan-to-value (LTV) ratio above 80%.
Private mortgage insurance (PMI):
| $0 |
Monthly PaymentThe fixed amount a borrower pays each month to repay a loan. It typically includes principal and interest (P&I) and may also cover property taxes, insurance, HOA fees, and PMI if escrowed. Monthly payment:
| $2,811 |
Operating Income
| % Rent | Monthly | Yearly | |
|---|---|---|---|
Gross RentThe total rental income received from tenants before deducting any expenses. Includes base rent, late fees, pet fees, parking fees, and other recurring charges.
Gross rent:
| $2,500 | $30,000 | |
Vacancy LossExpected loss of rent due to vacancies.
Vacancy loss:
(6%)
| 6% | -$150 | -$1,800 |
Operating IncomeGross rental income minus vacancy loss. Calculation:Gross rent - Vacancy loss
Operating income:
| $2,350 | $28,200 |
Operating Expenses
| % Rent | Monthly | Yearly | |
|---|---|---|---|
Property TaxesAnnual taxes levied by local governments on real estate properties. These taxes fund public services like schools, roads, and emergency services. | 19% | -$487 | -$5,848 |
InsuranceThe costs for insurance coverage to protect against financial losses due to risks like fire, natural disasters, theft, liability, or tenant-related damages. Calculation:Assumes 7% of gross rental income, unless insurance rates are specified. | 7% | -$175 | -$2,100 |
Property ManagementThe costs associated with hiring a property manager to handle the day-to-day operations of a rental property. Includes management fees, leasing fes, eviction fees, etc. Calculation:Assumes 8% of gross rental income. | 8% | -$200 | -$2,400 |
Repairs & MaintenanceOngoing costs for routine upkeep and minor fixes needed to keep a property in good working condition. Calculation:Assumes 5% of gross rental income. Varies by property age and condition. | 5% | -$125 | -$1,500 |
Capital ExpensesLarge, infrequent costs for major improvements or replacements, like a new roof, HVAC system, or appliances. Calculation:Assumes 5% of gross rental income. Varies by property age. | 5% | -$125 | -$1,500 |
HOA FeesRegular dues paid to a Homeowners Association for community maintenance, amenities, and management. Similar fees include: Condo Association Fees, Co-op Maintenance Fees, etc. | 7% | -$175 | -$2,100 |
Operating ExpensesRecurring costs required to maintain and manage a rental property, including property taxes, insurance, maintenance, repairs, utilities (if paid by the owner), property management fees, and other day-to-day expenses. Calculation:Insurance + Property Taxes + Property Management + Repairs & Maintenance + Capital Expenditures + HOA Fees | 51% | -$1,287 | -$15,448 |
Cash Flow
| Monthly | Yearly | |
|---|---|---|
Net Operating Income (NOI)The income generated from a property after deducting all operating expenses but before deducting mortgage payments, taxes, and capital expenditures. Calculation:Gross Operating Income - Operating Expenses
Net operating income:
| $1,063 | $12,756 |
Mortgage PaymentThe fixed amount a borrower pays each month to repay a loan. It typically includes principal and interest (P&I) and may also cover property taxes, insurance, HOA fees, and PMI if escrowed. | -$2,149 | -$25,788 |
Cash FlowNet Operating Income (NOI) minus mortgage payments. Calculation:NOI - Mortgage Payments | $1,086 | $13,032 |