$274,988
Investment Summary
- Monthly Cash Flow
- -$464
- Cap Rate
- 4.1%
- Cash-on-Cash Return
- -8.8%
- Debt Coverage Ratio
- 0.67
- Internal Rate of Return (5 years)
- -4.5%
Cash Flow
Net Operating Income (NOI) minus mortgage payments.
Calculation:
NOI - Mortgage Payments
Cap Rate (Market Value)
Capitalization Rate is a rate of return that compares the yearly Net Operating Income (NOI) to the market value.
Calculation:
NOI / Market Value
Cash-on-Cash Return (CoC)
Annual Cash Flow / Cash Invested
Calculation:
Annual cash flow divided by initial cash invested.
Debt Coverage Ratio (DCR)
Net Operating Income (NOI) divided by total debt payments.
Calculation:
NOI / Total Debt Payments
Internal Rate of Return (IRR)
A metric for assessing profitability over time. IRR is the discount rate at which the net present value (NPV) of all future cash flows (positive and negative) from an investment equals zero — including both periodic cash flow (such as rent) and a projected sale at the end of the holding period. It represents the expected annualized return, accounting for income, expenses, and the recovery of capital through a future sale.
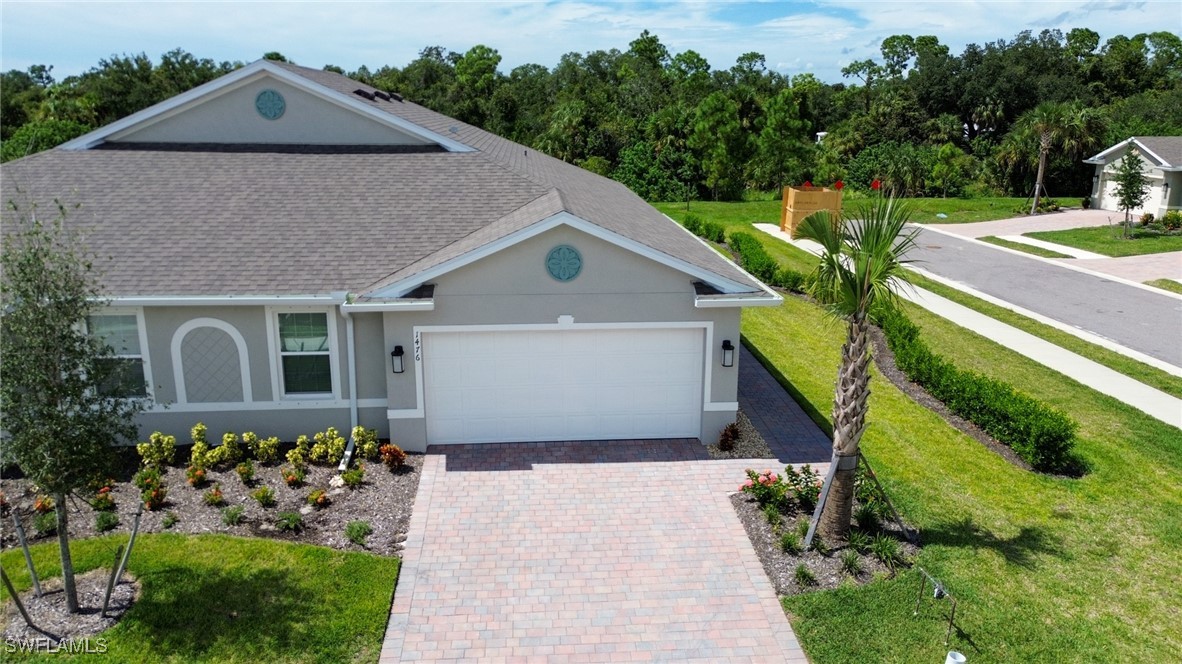
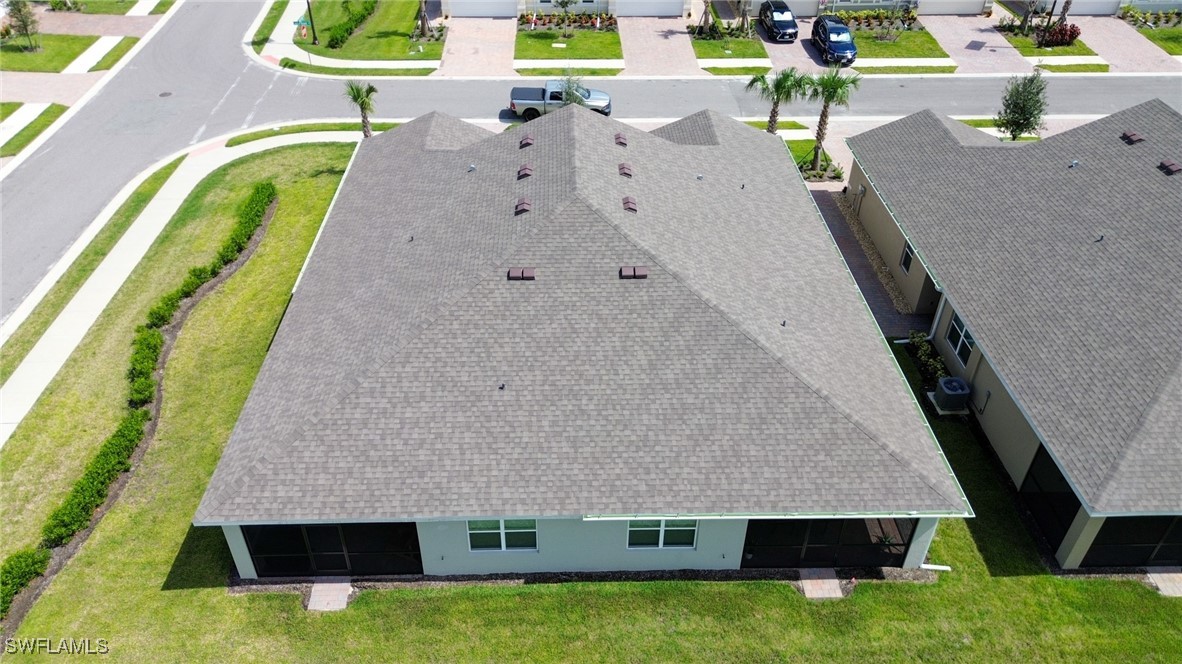
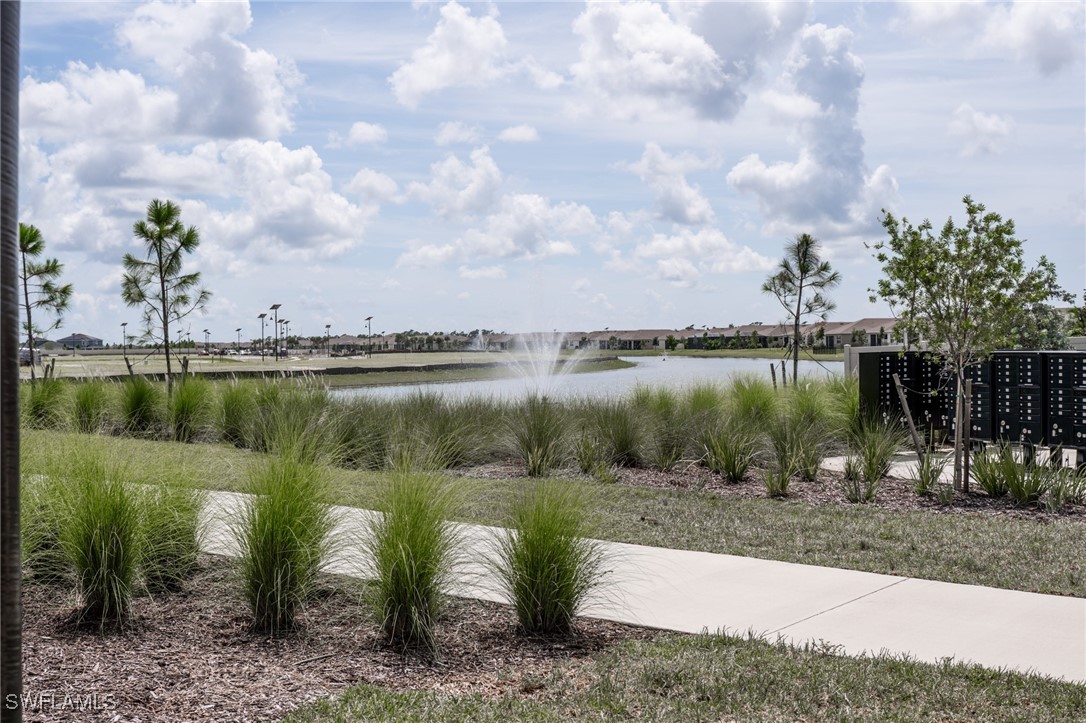
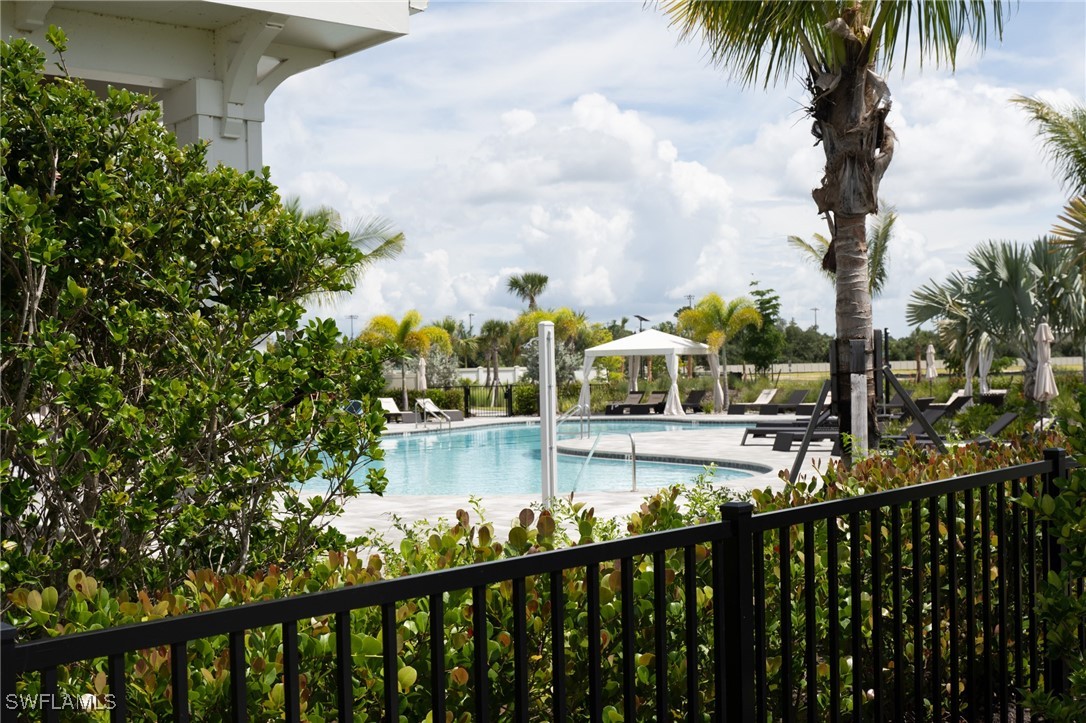
Property Description
Welcome Home to The cove at West Port. This 2 bed, 2 bath, 2 car garage Carrington Model lives like new. We are excited to present an exceptional opportunity to own a home in the highly sought-after Cove at West Port Community in Charlotte County. This exclusive, gated community offers an array of benefits that make it the perfect place to call home. Prime Location: Situated in the heart of Charlotte County, The Cove at West Port offers unparalleled access to the area's finest amenities. Enjoy the convenience of nearby pristine beaches, shopping, dining, and entertainment options, all just a short drive away. Gated Security: Your safety and privacy are paramount. This community is gated, providing an extra layer of security and peace of mind for you and your family. Experience the comfort of living in a secure and private environment. State-of-the-Art Clubhouse: Enhance your lifestyle with access to the community's modern Clubhouse. Enjoy the fully equipped fitness center, take a dip in the sparkling swimming pool, or gather in the spacious social areas to connect with neighbors and friends. It’s all designed to bring residents together and foster a sense of community. Exceptional Craftsmanship: Homes at The Cove at West Port are built with the utmost attention to detail and quality. From sleek, modern architectural designs to the use of high-quality materials, every home is crafted to ensure maximum comfort and style. Variety of Home Options: Whether you desire a cozy single-family home or a spacious twin villa, The Cove at West Port has a range of options to fit your lifestyle and needs. Choose from a selection of thoughtfully designed homes that cater to your preferences. Community Spirit: Life at The Cove at West Port is about more than just a home; it's about community. Participate in a variety of community events and activities, and enjoy the opportunity to build lasting connections with your neighbors. Ready to learn more? We would be thrilled to provide you with additional information and answer any questions you may have. ### Interior Highlights - **Open-Concept Design**: The Carrington model boasts a seamless flow between the kitchen, dining, and living areas, creating a welcoming space for gatherings. Interior upgrades include high hats, and ceiling fans throughout. - **Modern Finishes**: Enjoy contemporary finishes throughout the home, including sleek countertops, quality cabinetry, and stylish lighting fixtures. - **Master Suite**: The master bedroom features a large walk-in closet and an en-suite bathroom with dual vanities and a spacious shower. - **Natural Light**: Large windows throughout the home ensure plenty of natural light, enhancing the warm and inviting ambiance. Enjoy coffee or a drink on your lanai which backs to the privacy of the woods. **Schedule a Tour**: Experience all that The Cove at West Port has to offer.
Build Your Team
Quickly find investor-friendly professionals who can help you succeed in real estate investing at any stage of the investing journey.


Agents
Match with investor-friendly agents who can help you find, analyze, and close your next deal


Lenders
Get the best funding…find investor-friendly lenders who specialize in your deal strategy


Property Managers
Transition to passive investing. Find a trusted property management partnership that lasts.


Tax Pros & Accountants
Taxes and financial reporting made easy—find experts to create tax savings strategies, file taxes, and more
Location
Property Details
Parking
- Description: Attached, Driveway, Garage, Paved
- Details: Attached, Driveway, Garage, Paved
- Garage Spaces: 2
- Spaces Total: 0
Bedroom Information
- # of Bedrooms: 2
Bathroom Information
- # of Baths (Full): 2
- # of Baths (Total): 2.0
Interior Features
- # of Stories: 1
Exterior Features
- Roof Material: Shingle
- Pool Community: Yes
HOA
- Has HOA: Yes
- Additional HOA Fee: $241/monthly
Land Information
- Land Use: Residential
- Land Use Subtype: Cluster home
Lot Information
- Parcel ID: 402110111038
- Lot Size: 0 sqft
Property Information
- Property Type: Attached
- Style: See Remarks
- Year Built: 2023
Tax Information
- Annual Tax: $2,321
Utilities
- Heating: Central, Electric
- Cooling: Central Air, Electric
Location
- County: Charlotte
Listing Details
Investment Summary
- Monthly Cash Flow
- -$464
- Cap Rate
- 4.1%
- Cash-on-Cash Return
- -8.8%
- Debt Coverage Ratio
- 0.67
- Internal Rate of Return (5 years)
- -4.5%
Cash Flow
Net Operating Income (NOI) minus mortgage payments.
Calculation:
NOI - Mortgage Payments
Cap Rate (Market Value)
Capitalization Rate is a rate of return that compares the yearly Net Operating Income (NOI) to the market value.
Calculation:
NOI / Market Value
Cash-on-Cash Return (CoC)
Annual Cash Flow / Cash Invested
Calculation:
Annual cash flow divided by initial cash invested.
Debt Coverage Ratio (DCR)
Net Operating Income (NOI) divided by total debt payments.
Calculation:
NOI / Total Debt Payments
Internal Rate of Return (IRR)
A metric for assessing profitability over time. IRR is the discount rate at which the net present value (NPV) of all future cash flows (positive and negative) from an investment equals zero — including both periodic cash flow (such as rent) and a projected sale at the end of the holding period. It represents the expected annualized return, accounting for income, expenses, and the recovery of capital through a future sale.
Purchase Details
Purchase PriceThe price paid for the property. Purchase price:
| $274,988 |
|---|---|
Amount FinancedThe amount of the purchase financed through a loan. Amount financed:
| -$219,990 |
Down paymentThe initial payment made towards the purchase. Down payment:
| $54,998 |
Closing CostsFees and expenses associated with purchasing a property, typically ranging from 2% to 5% of the home’s purchase price, paid at the end of a home purchase to cover services like lending, title transfer, and taxes. Closing costs:
| $8,250 |
Rehab CostsCosts incurred to repair or improve the property, including: roof, flooring, exterior siding, kitchen, exterior paint, bathrooms, etc. Rehab costs:
| $0 |
Initial Cash InvestedThe total initial cash invested in the property. Calculation:Down payment + Buying costs + Rehab costs Initial cash invested:
| $63,248 |
Square Feet (SQFT)The total square footage of the property. Square feet:
| 1,500 |
Cost Per Square FootCost per square foot of the property. Calculation:Purchase Price / Square Feet Cost per square foot:
| $183 |
Monthly Rent Per Square FootMonthly rent divided by the number of square feet. This ratio helps investors compare rental income efficiency across properties, markets, and unit sizes Calculation:Monthly Rent / Square Feet Monthly rent per square foot:
| $1.33 |
Financing Details
Loan AmountThe total sum of money borrowed from a lender to finance a property purchase. Calculation:Purchase Price - Down Payment
Loan amount:
| $219,990 |
|---|---|
Loan to Value Ratio (LTV)Loan amount divided by the market value of the property. Calculation:Loan Amount / Market Value
Loan to value ratio:
| 80.0% |
Loan TypeThe type of loan (e.g., fixed, adjustable).
Loan type:
| Amortizing |
TermThe loan repayment period in years.
Term:
| 30 years |
Interest RateThe percentage a lender charges on the borrowed amount of a loan, determining the cost of borrowing money.
Interest rate:
| 6.625% |
Principal & Interest (PI)The principal is the portion of the loan payment that reduces the loan balance. The interest is the lender's charge for borrowing money. Calculation:(P * r * (1 + r) ** n) / ((1 + r) ** n - 1) Where:
P = Loan amount (principal)
Principal & interest:
| $1,409 |
Property TaxesAnnual taxes levied by local governments on real estate properties. These taxes fund public services like schools, roads, and emergency services.
Property tax:
| $194 |
InsuranceThe costs for insurance coverage to protect against financial losses due to risks like fire, natural disasters, theft, liability, or tenant-related damages. Calculation:Assumes 7% of gross rental income, unless insurance rates are specified.
Insurance:
| $140 |
Private Mortgage Insurance (PMI)A fee that borrowers pay when they take out a conventional loan with a loan-to-value (LTV) ratio above 80%.
Private mortgage insurance (PMI):
| $0 |
Monthly PaymentThe fixed amount a borrower pays each month to repay a loan. It typically includes principal and interest (P&I) and may also cover property taxes, insurance, HOA fees, and PMI if escrowed. Monthly payment:
| $1,743 |
Operating Income
| % Rent | Monthly | Yearly | |
|---|---|---|---|
Gross RentThe total rental income received from tenants before deducting any expenses. Includes base rent, late fees, pet fees, parking fees, and other recurring charges.
Gross rent:
| $2,000 | $24,000 | |
Vacancy LossExpected loss of rent due to vacancies.
Vacancy loss:
(6%)
| 6% | -$120 | -$1,440 |
Operating IncomeGross rental income minus vacancy loss. Calculation:Gross rent - Vacancy loss
Operating income:
| $1,880 | $22,560 |
Operating Expenses
| % Rent | Monthly | Yearly | |
|---|---|---|---|
Property TaxesAnnual taxes levied by local governments on real estate properties. These taxes fund public services like schools, roads, and emergency services. | 10% | -$194 | -$2,322 |
InsuranceThe costs for insurance coverage to protect against financial losses due to risks like fire, natural disasters, theft, liability, or tenant-related damages. Calculation:Assumes 7% of gross rental income, unless insurance rates are specified. | 7% | -$140 | -$1,680 |
Property ManagementThe costs associated with hiring a property manager to handle the day-to-day operations of a rental property. Includes management fees, leasing fes, eviction fees, etc. Calculation:Assumes 8% of gross rental income. | 8% | -$160 | -$1,920 |
Repairs & MaintenanceOngoing costs for routine upkeep and minor fixes needed to keep a property in good working condition. Calculation:Assumes 5% of gross rental income. Varies by property age and condition. | 5% | -$100 | -$1,200 |
Capital ExpensesLarge, infrequent costs for major improvements or replacements, like a new roof, HVAC system, or appliances. Calculation:Assumes 5% of gross rental income. Varies by property age. | 5% | -$100 | -$1,200 |
HOA FeesRegular dues paid to a Homeowners Association for community maintenance, amenities, and management. Similar fees include: Condo Association Fees, Co-op Maintenance Fees, etc. | 12% | -$241 | -$2,892 |
Operating ExpensesRecurring costs required to maintain and manage a rental property, including property taxes, insurance, maintenance, repairs, utilities (if paid by the owner), property management fees, and other day-to-day expenses. Calculation:Insurance + Property Taxes + Property Management + Repairs & Maintenance + Capital Expenditures + HOA Fees | 47% | -$935 | -$11,214 |
Cash Flow
| Monthly | Yearly | |
|---|---|---|
Net Operating Income (NOI)The income generated from a property after deducting all operating expenses but before deducting mortgage payments, taxes, and capital expenditures. Calculation:Gross Operating Income - Operating Expenses
Net operating income:
| $945 | $11,340 |
Mortgage PaymentThe fixed amount a borrower pays each month to repay a loan. It typically includes principal and interest (P&I) and may also cover property taxes, insurance, HOA fees, and PMI if escrowed. | -$1,409 | -$16,908 |
Cash FlowNet Operating Income (NOI) minus mortgage payments. Calculation:NOI - Mortgage Payments | $464 | $5,568 |