$1,085,000
Investment Summary
- Monthly Cash Flow
- -$2,243
- Cap Rate
- 3.2%
- Cash-on-Cash Return
- -10.8%
- Debt Coverage Ratio
- 0.56
- Internal Rate of Return (5 years)
- -6.4%
Cash Flow
Net Operating Income (NOI) minus mortgage payments.
Calculation:
NOI - Mortgage Payments
Cap Rate (Market Value)
Capitalization Rate is a rate of return that compares the yearly Net Operating Income (NOI) to the market value.
Calculation:
NOI / Market Value
Cash-on-Cash Return (CoC)
Annual Cash Flow / Cash Invested
Calculation:
Annual cash flow divided by initial cash invested.
Debt Coverage Ratio (DCR)
Net Operating Income (NOI) divided by total debt payments.
Calculation:
NOI / Total Debt Payments
Internal Rate of Return (IRR)
A metric for assessing profitability over time. IRR is the discount rate at which the net present value (NPV) of all future cash flows (positive and negative) from an investment equals zero — including both periodic cash flow (such as rent) and a projected sale at the end of the holding period. It represents the expected annualized return, accounting for income, expenses, and the recovery of capital through a future sale.
Property Description
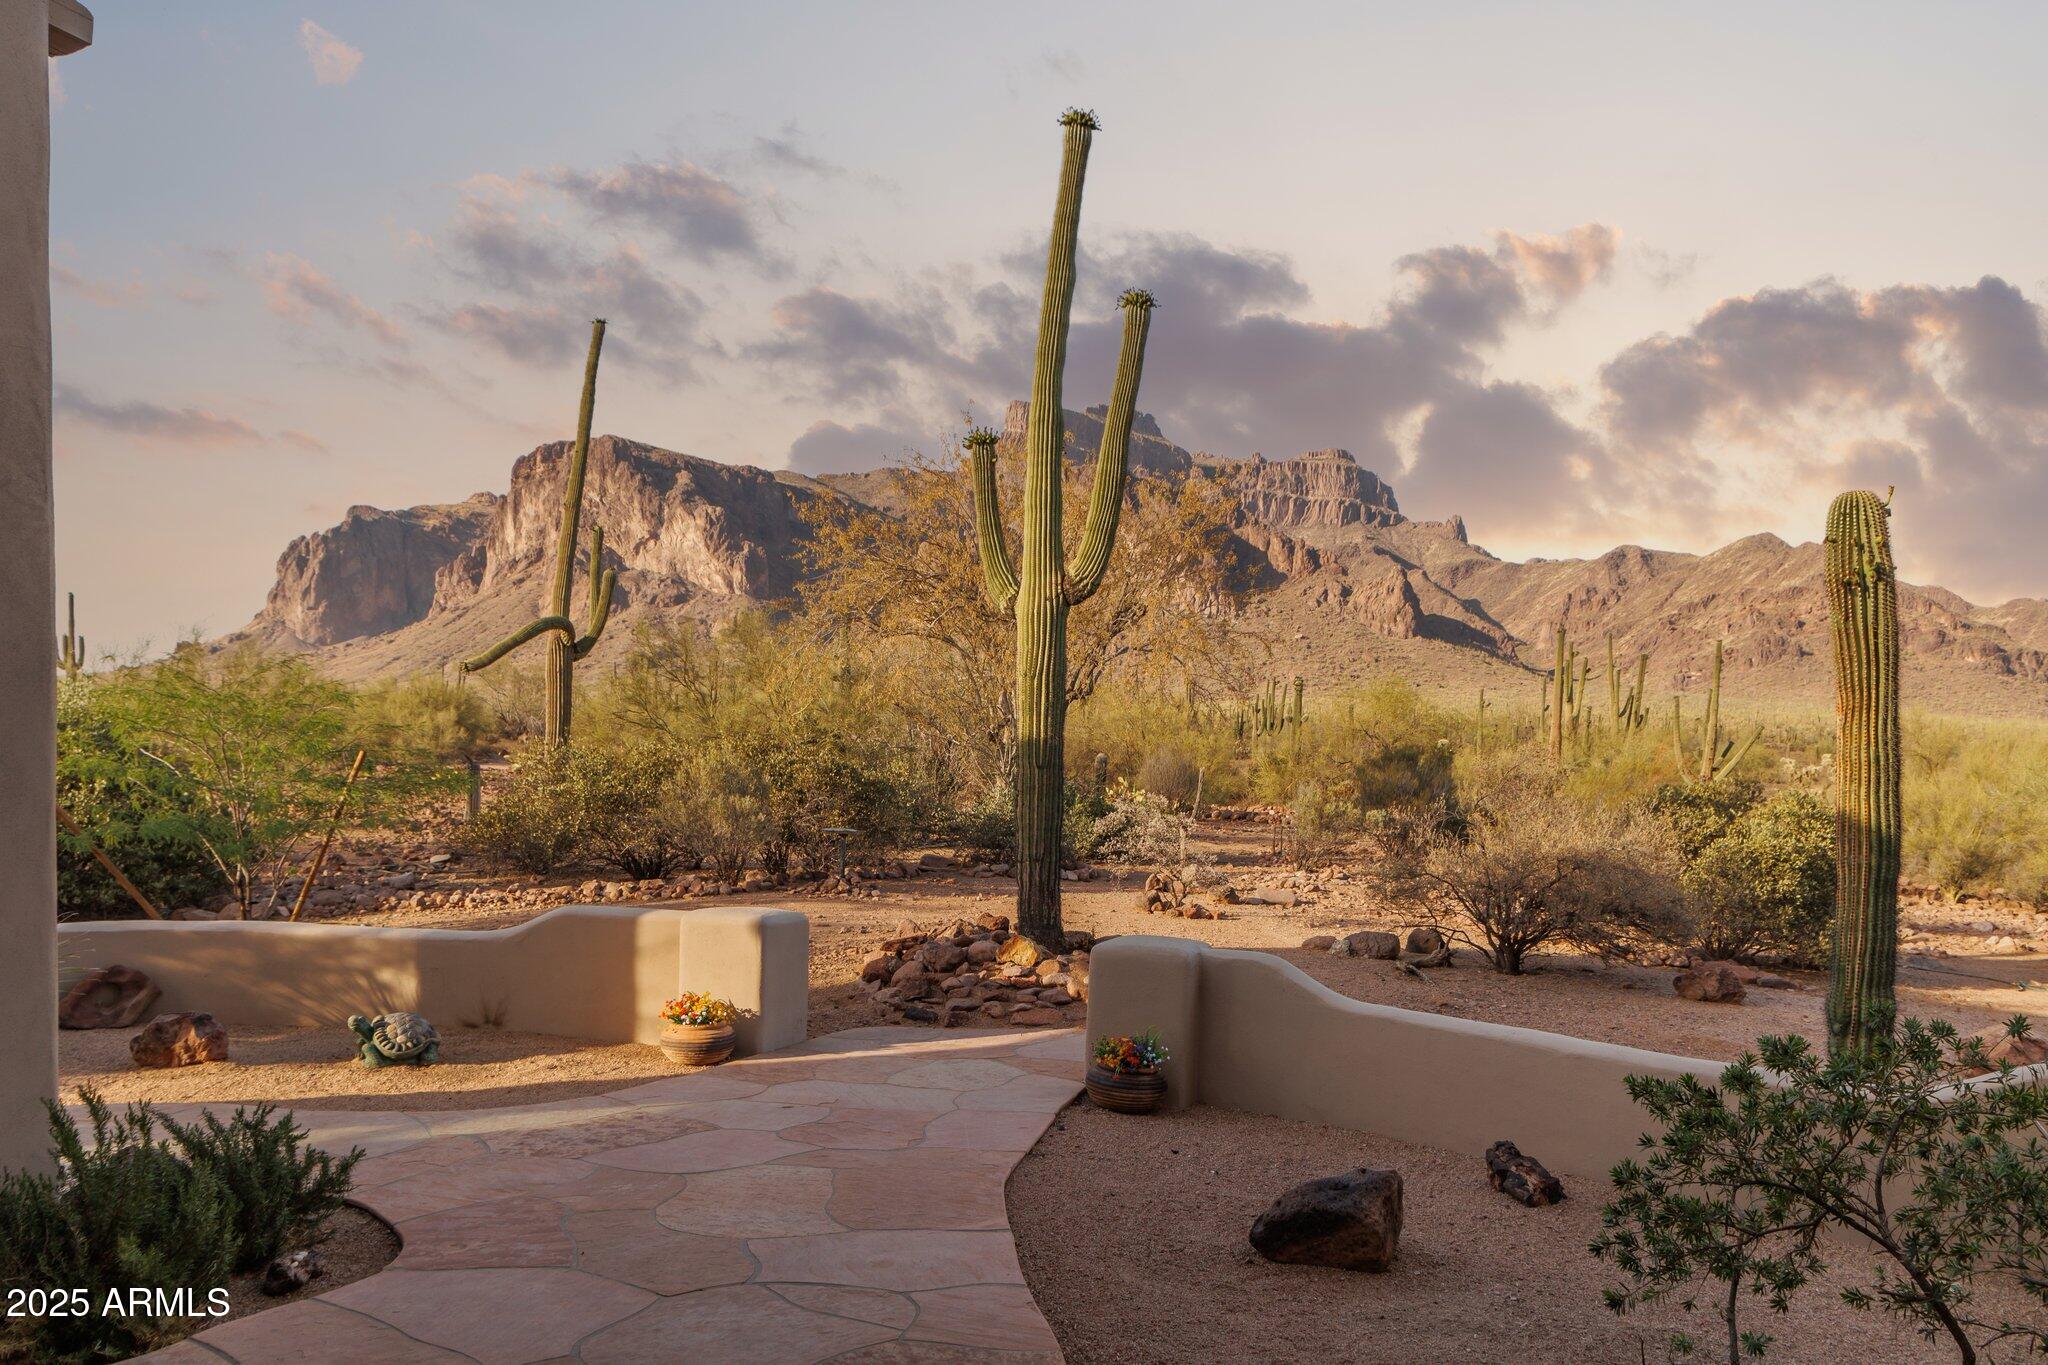
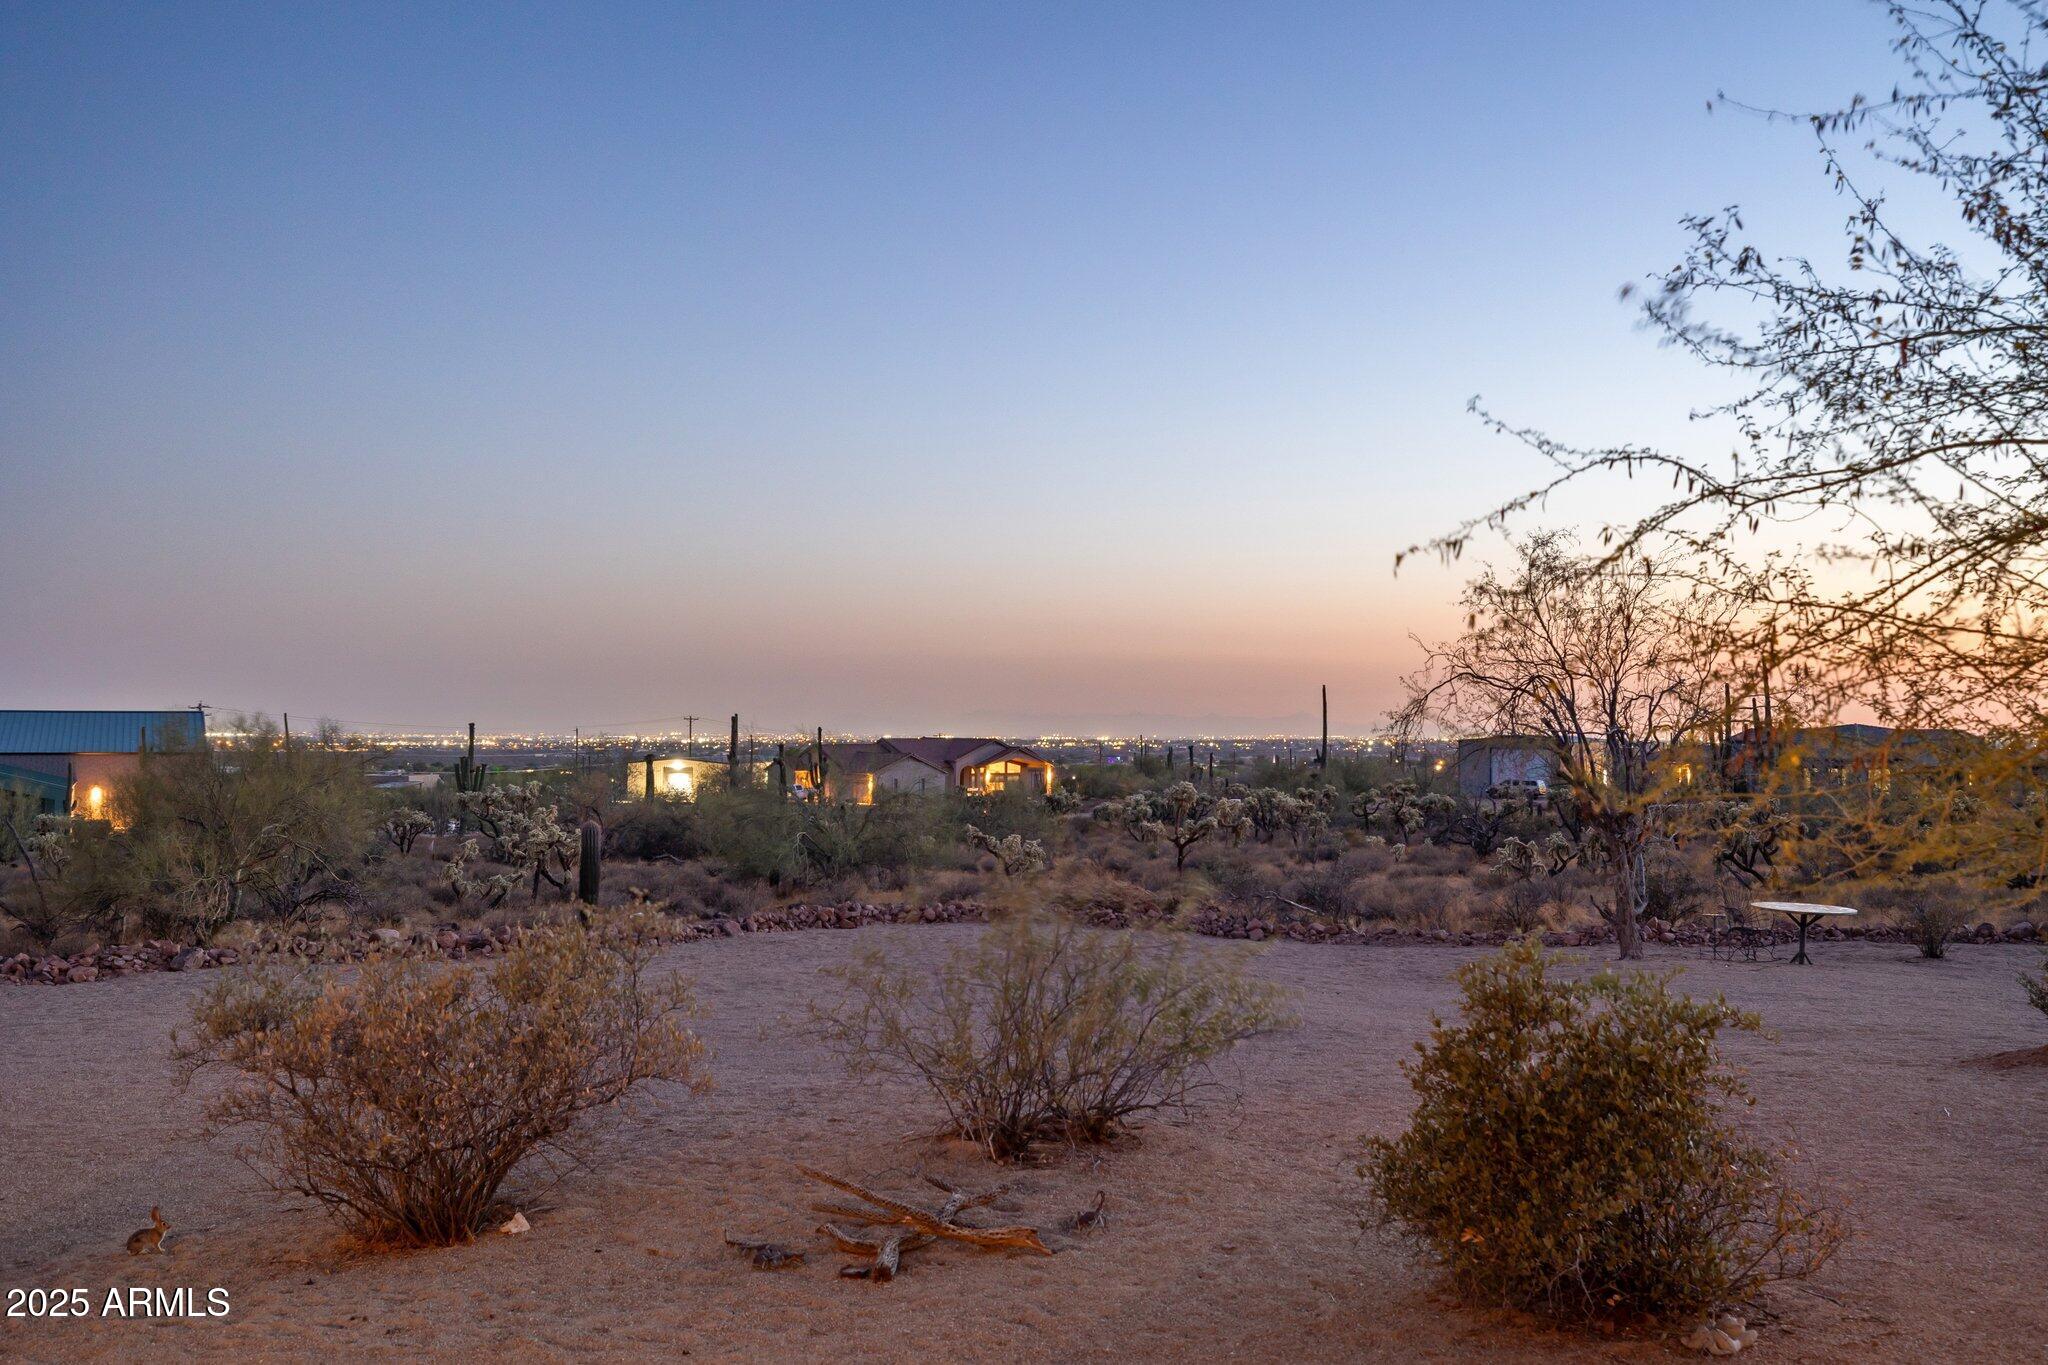
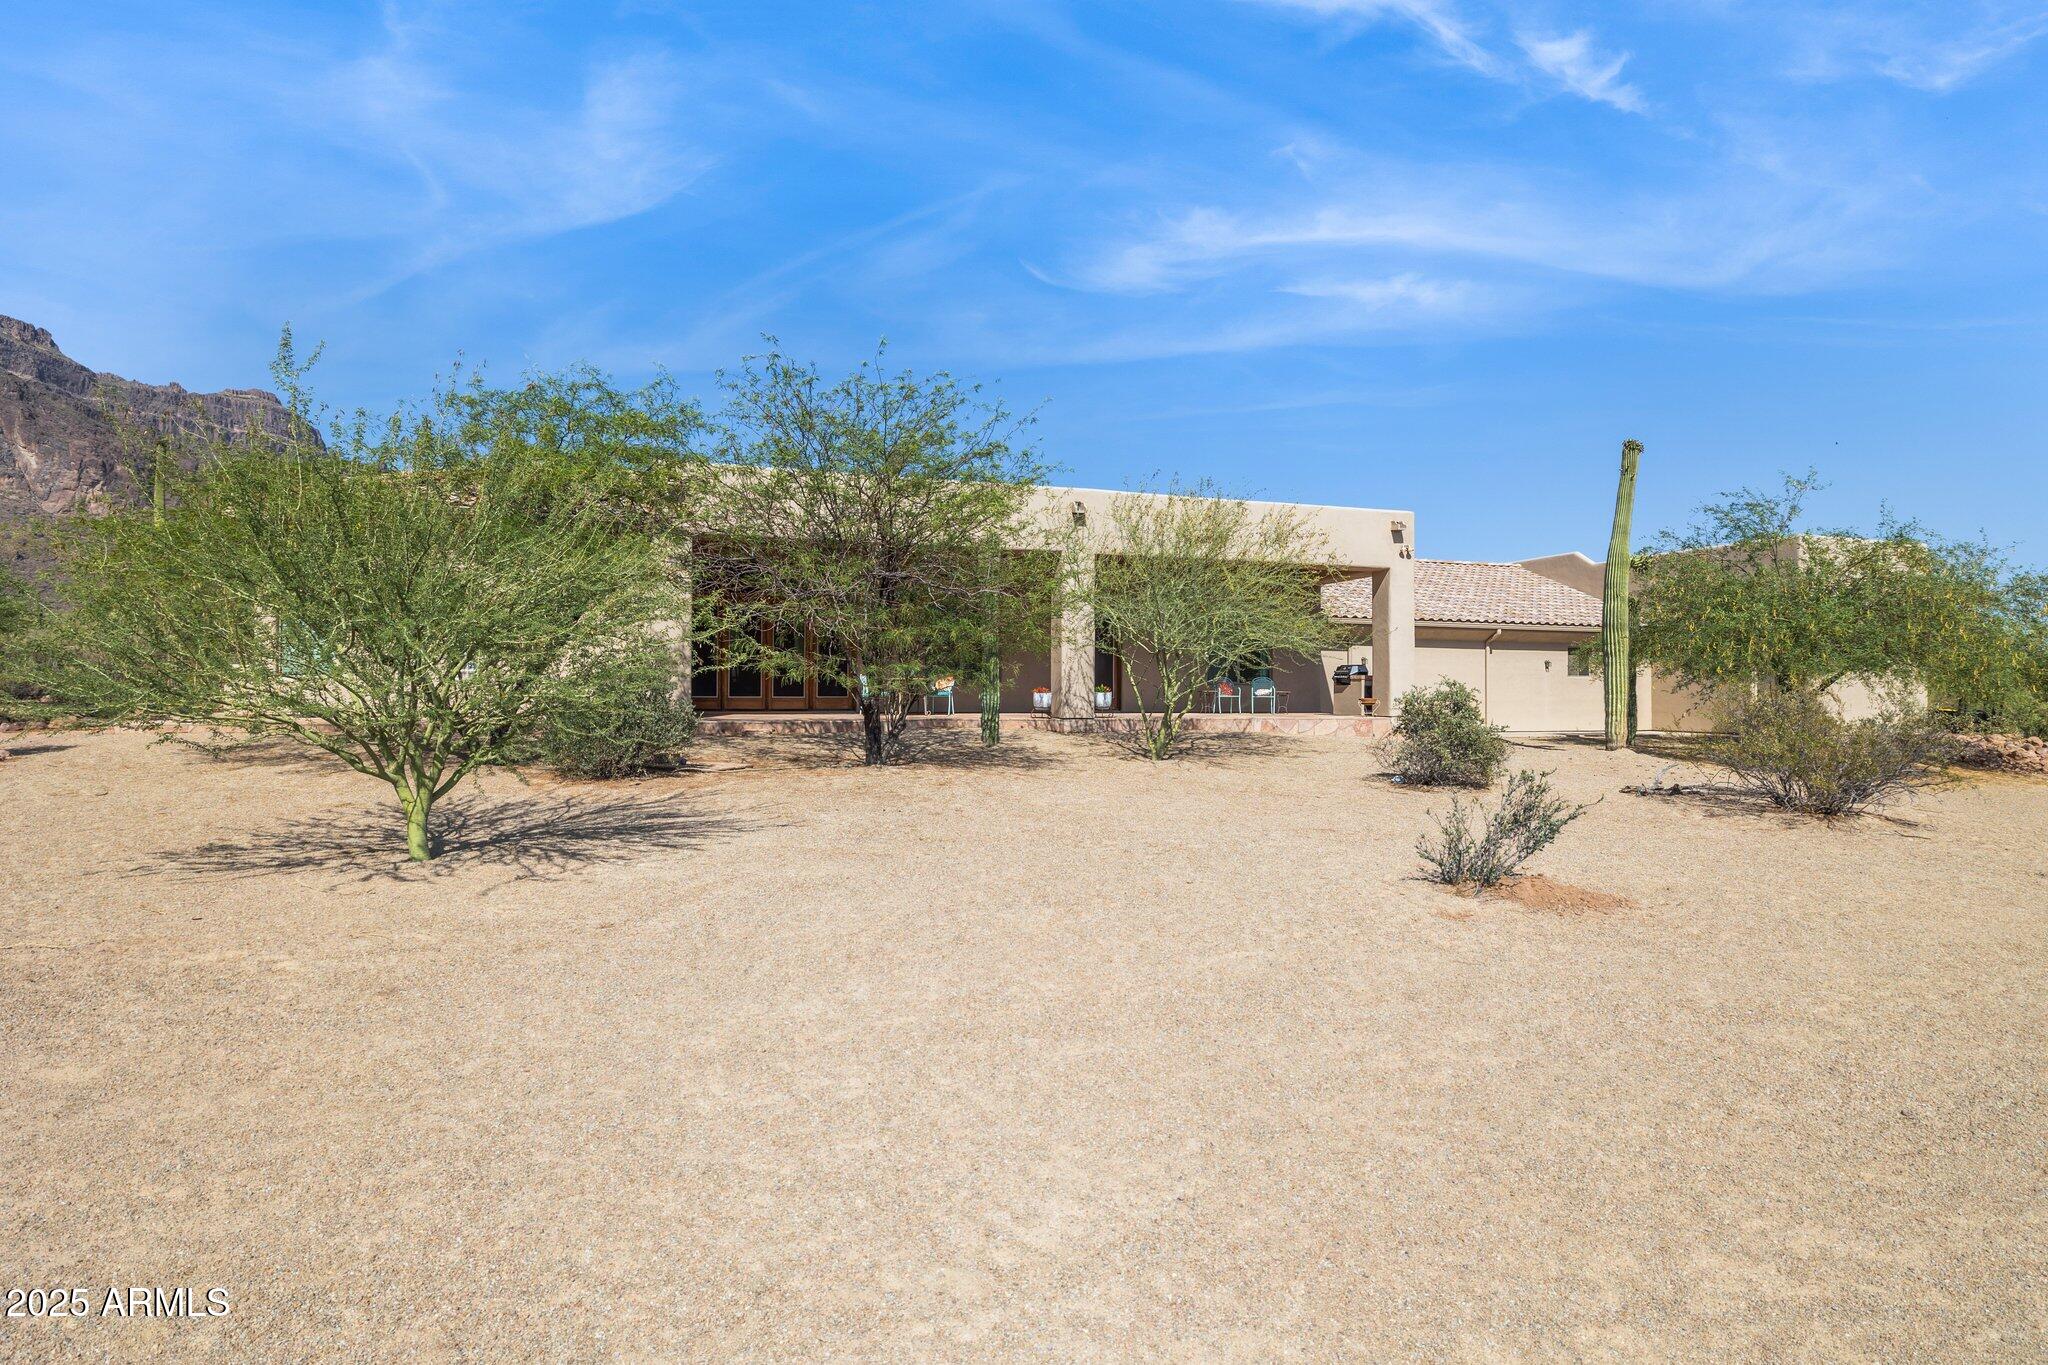
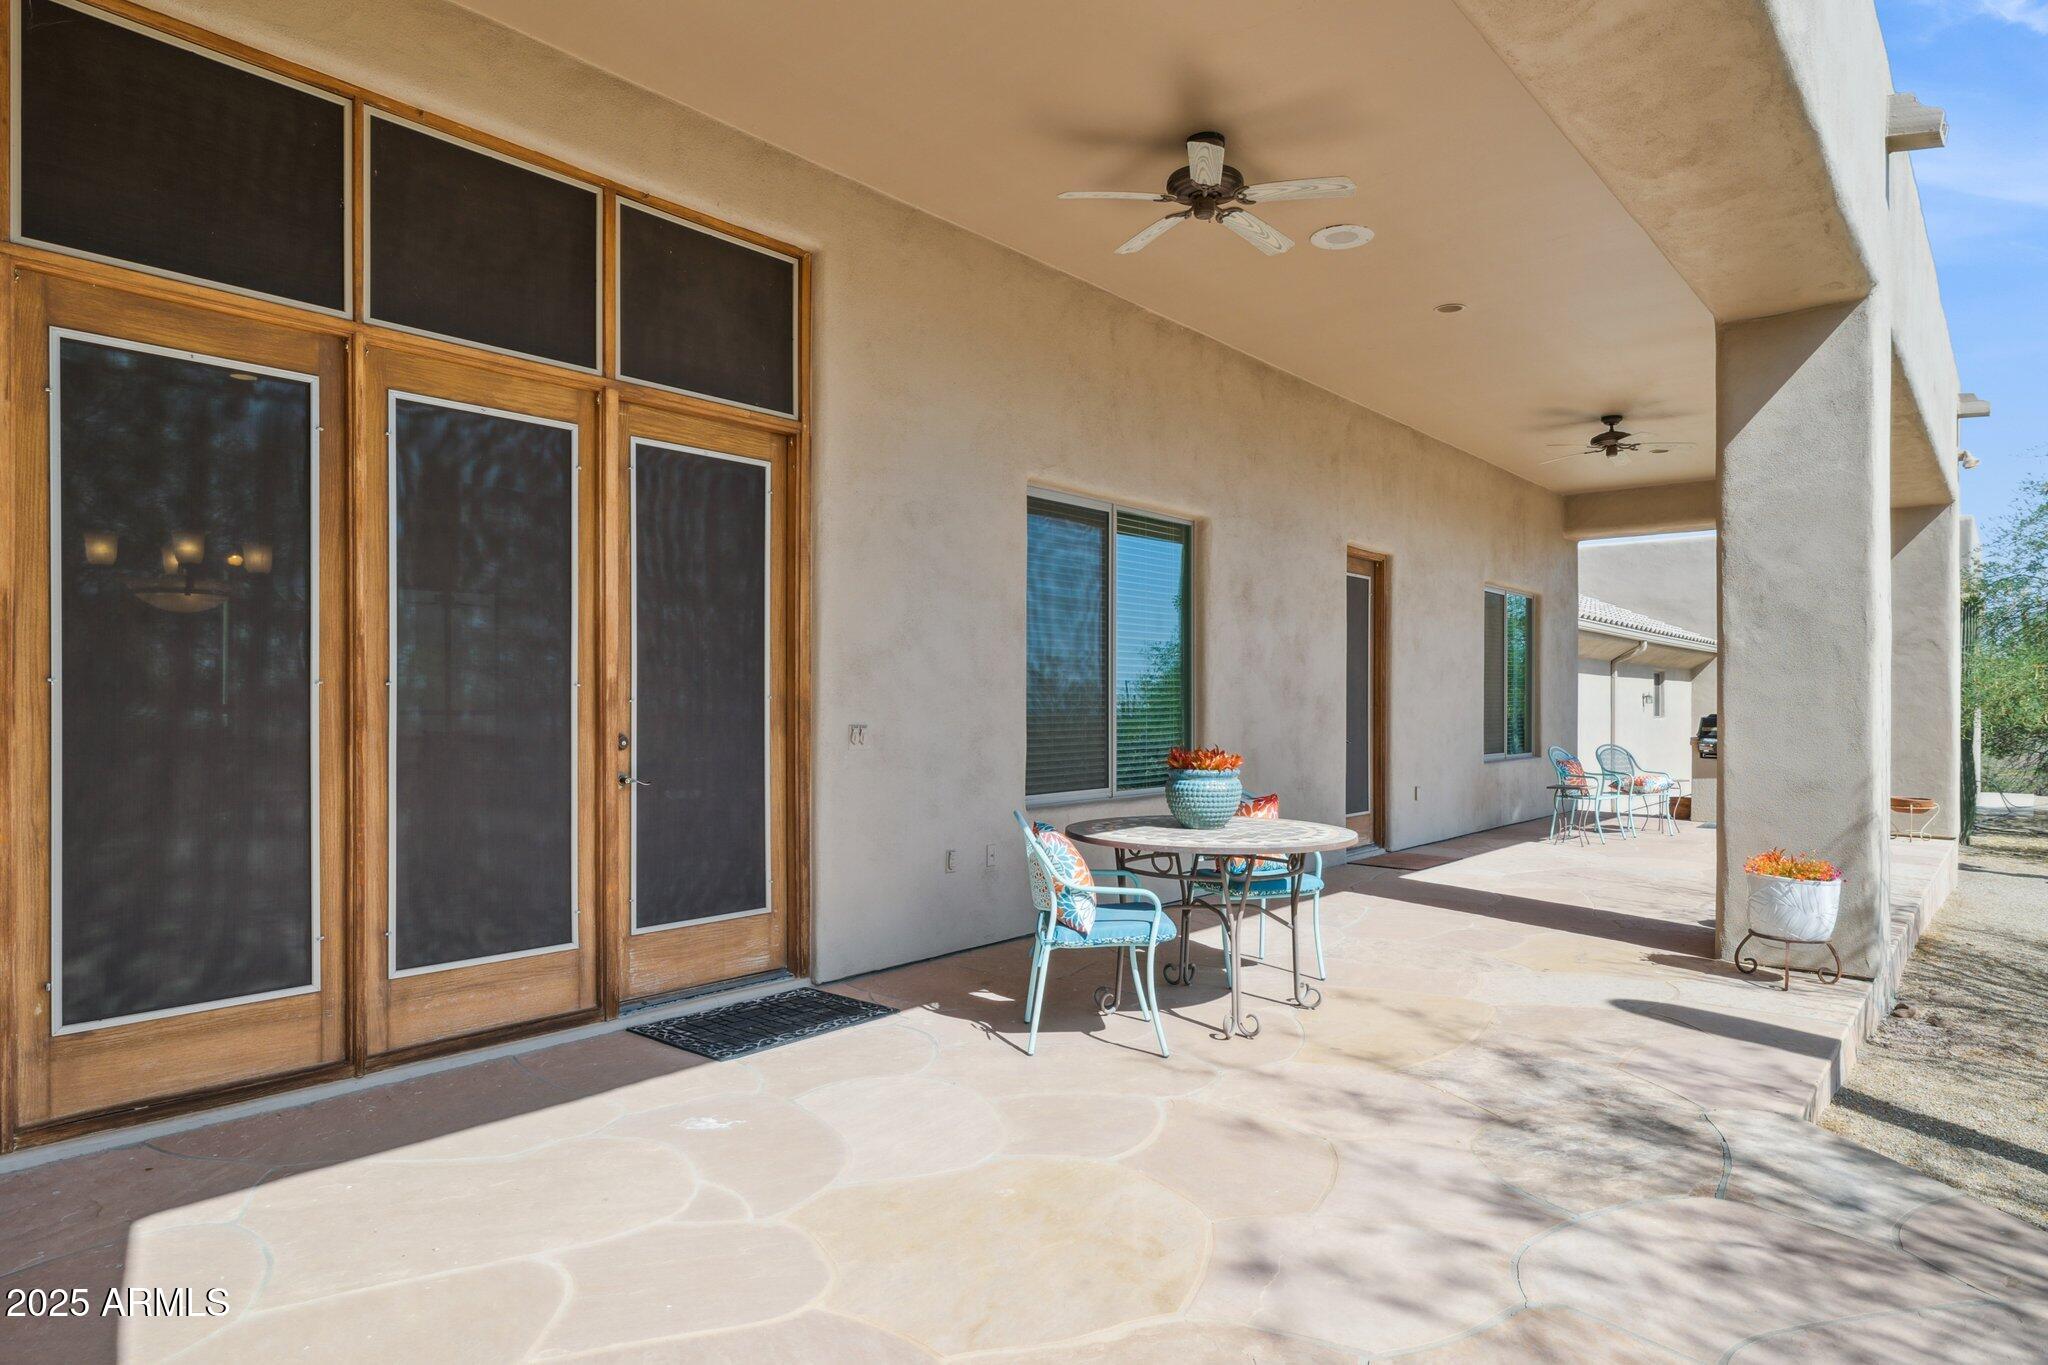
Gorgeous Home with UNMATCHED Supersition MOUNTAIN VIEWS. Plus, Breathtaking CITY LIGHT VIEWS! All on Beautiful, 2.5 ACRES, nestled at the foot of the Majestic Superstition Mountains. Your DREAM RETREAT awaits where breathtaking panoramic views & a serene 2.5-acre landscape create the ultimate escape; a sanctuary designed for those who appreciate the beauty of nature without sacrificing modern comforts. Step inside & be captivated by the AWE-INSPIRING INTERIOR VIEWS! Large picture windows ensure that you can enjoy these stunning views from nearly every angle. At the heart of this home is a Designer Kitchen, perfect for culinary enthusiasts & family gatherings. Equipped wi/ stainless steel appliances, a spacious kitchen island, & custom granite countertops. Imagine dining w/ a backdrop of Panoramic Views that make every meal feel special.The thoughtfully designed Open Floor Plan seamlessly connects the kitchen, dining, & family room, creating an inviting atmosphere for entertaining & everyday living. Natural light pours through the large windows, enhancing the warmth & comfort of the space. Outdoor Living AT IT"S BEST! Start your mornings on the charming front courtyard or unwind on the expansive covered back patio, both designed to maximize your enjoyment of the stunning natural surroundings. Picture yourself sipping coffee while watching the mountains come alive w/ color at dawn, or hosting friends for sunset gatherings under the stars.Venture into your Backyard Paradise, where breathtaking views & a sense of tranquility await. The large covered patio provides ample space for family & friends to gather. This outdoor paradise offers both beauty & privacy, making it the perfect setting for relaxation or entertaining. Ample Storage & Workshop, With a spacious 3-car oversized garage, a RV garage, and dedicated RV parking, you have all the space you need for your vehicles, toys, and outdoor adventures. Plus, a workshop area inside the garage, complete w/ cabinets, caters to all your DIY projects and hobbies. This Ideal Location, Surrounded by natural beauty & custom homes, this property is perfectly situated near a wealth of recreational activities. Explore nearby hiking trails, ATV paths, & the stunning Tonto National Forest. Enjoy the convenience of being just a short drive away from shopping, parks, & a dog park, ensuring that you have everything you need within reach. Experience peaceful, quiet evenings in your private retreat while watching the mountains turn pink at sunset. Don't miss this opportunity to own a piece of paradise! Discover why this stunning home is the perfect place for your family to create lasting memories!
Build Your Team
Quickly find investor-friendly professionals who can help you succeed in real estate investing at any stage of the investing journey.


Agents
Match with investor-friendly agents who can help you find, analyze, and close your next deal


Lenders
Get the best funding…find investor-friendly lenders who specialize in your deal strategy


Property Managers
Transition to passive investing. Find a trusted property management partnership that lasts.


Tax Pros & Accountants
Taxes and financial reporting made easy—find experts to create tax savings strategies, file taxes, and more
Location
Property Details
Parking
- Description: Attch'd Gar Cabinets, Dir Entry frm Garage, Electric Door Opener, Extnded Lngth Garage, Over Height Garage, RV Access/Parking, RV Garage
- Details: RV Access/Parking, Garage Door Opener, Direct Access, RV Garage
- Garage Spaces: 4
- Spaces Total: 0
Bedroom Information
- # of Bedrooms: 3
Bathroom Information
- # of Baths (Total): 2.0
Interior Features
- # of Stories: 1
- Fireplace: Yes
Exterior Features
- Exterior Walls Materials: Other
- Roof Material: Tile, Foam
Land Information
- Land Use: Residential
- Land Use Subtype: Rural/Agricultural
Lot Information
- Parcel ID: 103310330
- Lot Size: 109393 sqft
Property Information
- Property Type: Single Family Residence
- Style: Territorial/Santa Fe
- Year Built: 1998
Tax Information
- Annual Tax: $5,866
Utilities
- Heating: Electric
- Cooling: Central Air
Location
- County: Pinal
Listing Details
Investment Summary
- Monthly Cash Flow
- -$2,243
- Cap Rate
- 3.2%
- Cash-on-Cash Return
- -10.8%
- Debt Coverage Ratio
- 0.56
- Internal Rate of Return (5 years)
- -6.4%
Cash Flow
Net Operating Income (NOI) minus mortgage payments.
Calculation:
NOI - Mortgage Payments
Cap Rate (Market Value)
Capitalization Rate is a rate of return that compares the yearly Net Operating Income (NOI) to the market value.
Calculation:
NOI / Market Value
Cash-on-Cash Return (CoC)
Annual Cash Flow / Cash Invested
Calculation:
Annual cash flow divided by initial cash invested.
Debt Coverage Ratio (DCR)
Net Operating Income (NOI) divided by total debt payments.
Calculation:
NOI / Total Debt Payments
Internal Rate of Return (IRR)
A metric for assessing profitability over time. IRR is the discount rate at which the net present value (NPV) of all future cash flows (positive and negative) from an investment equals zero — including both periodic cash flow (such as rent) and a projected sale at the end of the holding period. It represents the expected annualized return, accounting for income, expenses, and the recovery of capital through a future sale.
Purchase Details
Purchase PriceThe price paid for the property. Purchase price:
| $1,085,000 |
|---|---|
Amount FinancedThe amount of the purchase financed through a loan. Amount financed:
| -$868,000 |
Down paymentThe initial payment made towards the purchase. Down payment:
| $217,000 |
Closing CostsFees and expenses associated with purchasing a property, typically ranging from 2% to 5% of the home’s purchase price, paid at the end of a home purchase to cover services like lending, title transfer, and taxes. Closing costs:
| $32,550 |
Rehab CostsCosts incurred to repair or improve the property, including: roof, flooring, exterior siding, kitchen, exterior paint, bathrooms, etc. Rehab costs:
| $0 |
Initial Cash InvestedThe total initial cash invested in the property. Calculation:Down payment + Buying costs + Rehab costs Initial cash invested:
| $249,550 |
Square Feet (SQFT)The total square footage of the property. Square feet:
| 2,895 |
Cost Per Square FootCost per square foot of the property. Calculation:Purchase Price / Square Feet Cost per square foot:
| $375 |
Monthly Rent Per Square FootMonthly rent divided by the number of square feet. This ratio helps investors compare rental income efficiency across properties, markets, and unit sizes Calculation:Monthly Rent / Square Feet Monthly rent per square foot:
| $1.69 |
Financing Details
Loan AmountThe total sum of money borrowed from a lender to finance a property purchase. Calculation:Purchase Price - Down Payment
Loan amount:
| $868,000 |
|---|---|
Loan to Value Ratio (LTV)Loan amount divided by the market value of the property. Calculation:Loan Amount / Market Value
Loan to value ratio:
| 80.0% |
Loan TypeThe type of loan (e.g., fixed, adjustable).
Loan type:
| Amortizing |
TermThe loan repayment period in years.
Term:
| 30 years |
Interest RateThe percentage a lender charges on the borrowed amount of a loan, determining the cost of borrowing money.
Interest rate:
| 5.875% |
Principal & Interest (PI)The principal is the portion of the loan payment that reduces the loan balance. The interest is the lender's charge for borrowing money. Calculation:(P * r * (1 + r) ** n) / ((1 + r) ** n - 1) Where:
P = Loan amount (principal)
Principal & interest:
| $5,135 |
Property TaxesAnnual taxes levied by local governments on real estate properties. These taxes fund public services like schools, roads, and emergency services.
Property tax:
| $489 |
InsuranceThe costs for insurance coverage to protect against financial losses due to risks like fire, natural disasters, theft, liability, or tenant-related damages. Calculation:Assumes 7% of gross rental income, unless insurance rates are specified.
Insurance:
| $343 |
Private Mortgage Insurance (PMI)A fee that borrowers pay when they take out a conventional loan with a loan-to-value (LTV) ratio above 80%.
Private mortgage insurance (PMI):
| $0 |
Monthly PaymentThe fixed amount a borrower pays each month to repay a loan. It typically includes principal and interest (P&I) and may also cover property taxes, insurance, HOA fees, and PMI if escrowed. Monthly payment:
| $5,967 |
Operating Income
| % Rent | Monthly | Yearly | |
|---|---|---|---|
Gross RentThe total rental income received from tenants before deducting any expenses. Includes base rent, late fees, pet fees, parking fees, and other recurring charges.
Gross rent:
| $4,900 | $58,800 | |
Vacancy LossExpected loss of rent due to vacancies.
Vacancy loss:
(6%)
| 6% | -$294 | -$3,528 |
Operating IncomeGross rental income minus vacancy loss. Calculation:Gross rent - Vacancy loss
Operating income:
| $4,606 | $55,272 |
Operating Expenses
| % Rent | Monthly | Yearly | |
|---|---|---|---|
Property TaxesAnnual taxes levied by local governments on real estate properties. These taxes fund public services like schools, roads, and emergency services. | 10% | -$489 | -$5,866 |
InsuranceThe costs for insurance coverage to protect against financial losses due to risks like fire, natural disasters, theft, liability, or tenant-related damages. Calculation:Assumes 7% of gross rental income, unless insurance rates are specified. | 7% | -$343 | -$4,116 |
Property ManagementThe costs associated with hiring a property manager to handle the day-to-day operations of a rental property. Includes management fees, leasing fes, eviction fees, etc. Calculation:Assumes 8% of gross rental income. | 8% | -$392 | -$4,704 |
Repairs & MaintenanceOngoing costs for routine upkeep and minor fixes needed to keep a property in good working condition. Calculation:Assumes 5% of gross rental income. Varies by property age and condition. | 5% | -$245 | -$2,940 |
Capital ExpensesLarge, infrequent costs for major improvements or replacements, like a new roof, HVAC system, or appliances. Calculation:Assumes 5% of gross rental income. Varies by property age. | 5% | -$245 | -$2,940 |
HOA FeesRegular dues paid to a Homeowners Association for community maintenance, amenities, and management. Similar fees include: Condo Association Fees, Co-op Maintenance Fees, etc. | n/a | n/a | n/a |
Operating ExpensesRecurring costs required to maintain and manage a rental property, including property taxes, insurance, maintenance, repairs, utilities (if paid by the owner), property management fees, and other day-to-day expenses. Calculation:Insurance + Property Taxes + Property Management + Repairs & Maintenance + Capital Expenditures + HOA Fees | 35% | -$1,714 | -$20,566 |
Cash Flow
| Monthly | Yearly | |
|---|---|---|
Net Operating Income (NOI)The income generated from a property after deducting all operating expenses but before deducting mortgage payments, taxes, and capital expenditures. Calculation:Gross Operating Income - Operating Expenses
Net operating income:
| $2,892 | $34,704 |
Mortgage PaymentThe fixed amount a borrower pays each month to repay a loan. It typically includes principal and interest (P&I) and may also cover property taxes, insurance, HOA fees, and PMI if escrowed. | -$5,135 | -$61,620 |
Cash FlowNet Operating Income (NOI) minus mortgage payments. Calculation:NOI - Mortgage Payments | -$2,243 | -$26,916 |