$649,000
Investment Summary
- Monthly Cash Flow
- -$1,064
- Cap Rate
- 4.2%
- Cash-on-Cash Return
- -8.6%
- Debt Coverage Ratio
- 0.68
- Internal Rate of Return (5 years)
- -4.3%
Cash Flow
Net Operating Income (NOI) minus mortgage payments.
Calculation:
NOI - Mortgage Payments
Cap Rate (Market Value)
Capitalization Rate is a rate of return that compares the yearly Net Operating Income (NOI) to the market value.
Calculation:
NOI / Market Value
Cash-on-Cash Return (CoC)
Annual Cash Flow / Cash Invested
Calculation:
Annual cash flow divided by initial cash invested.
Debt Coverage Ratio (DCR)
Net Operating Income (NOI) divided by total debt payments.
Calculation:
NOI / Total Debt Payments
Internal Rate of Return (IRR)
A metric for assessing profitability over time. IRR is the discount rate at which the net present value (NPV) of all future cash flows (positive and negative) from an investment equals zero — including both periodic cash flow (such as rent) and a projected sale at the end of the holding period. It represents the expected annualized return, accounting for income, expenses, and the recovery of capital through a future sale.
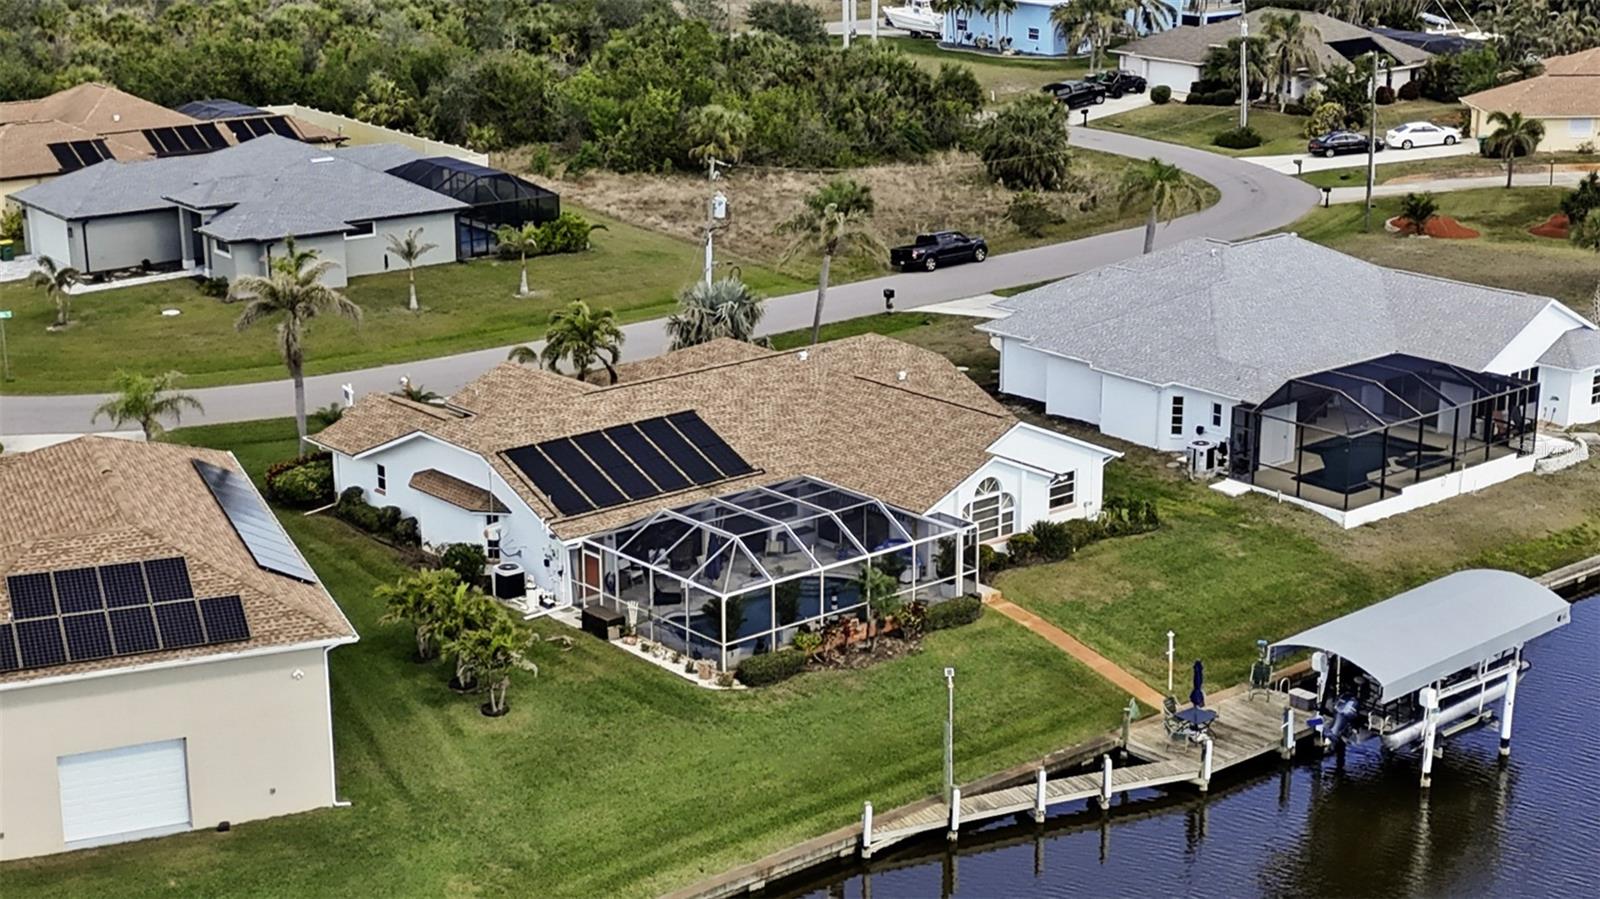
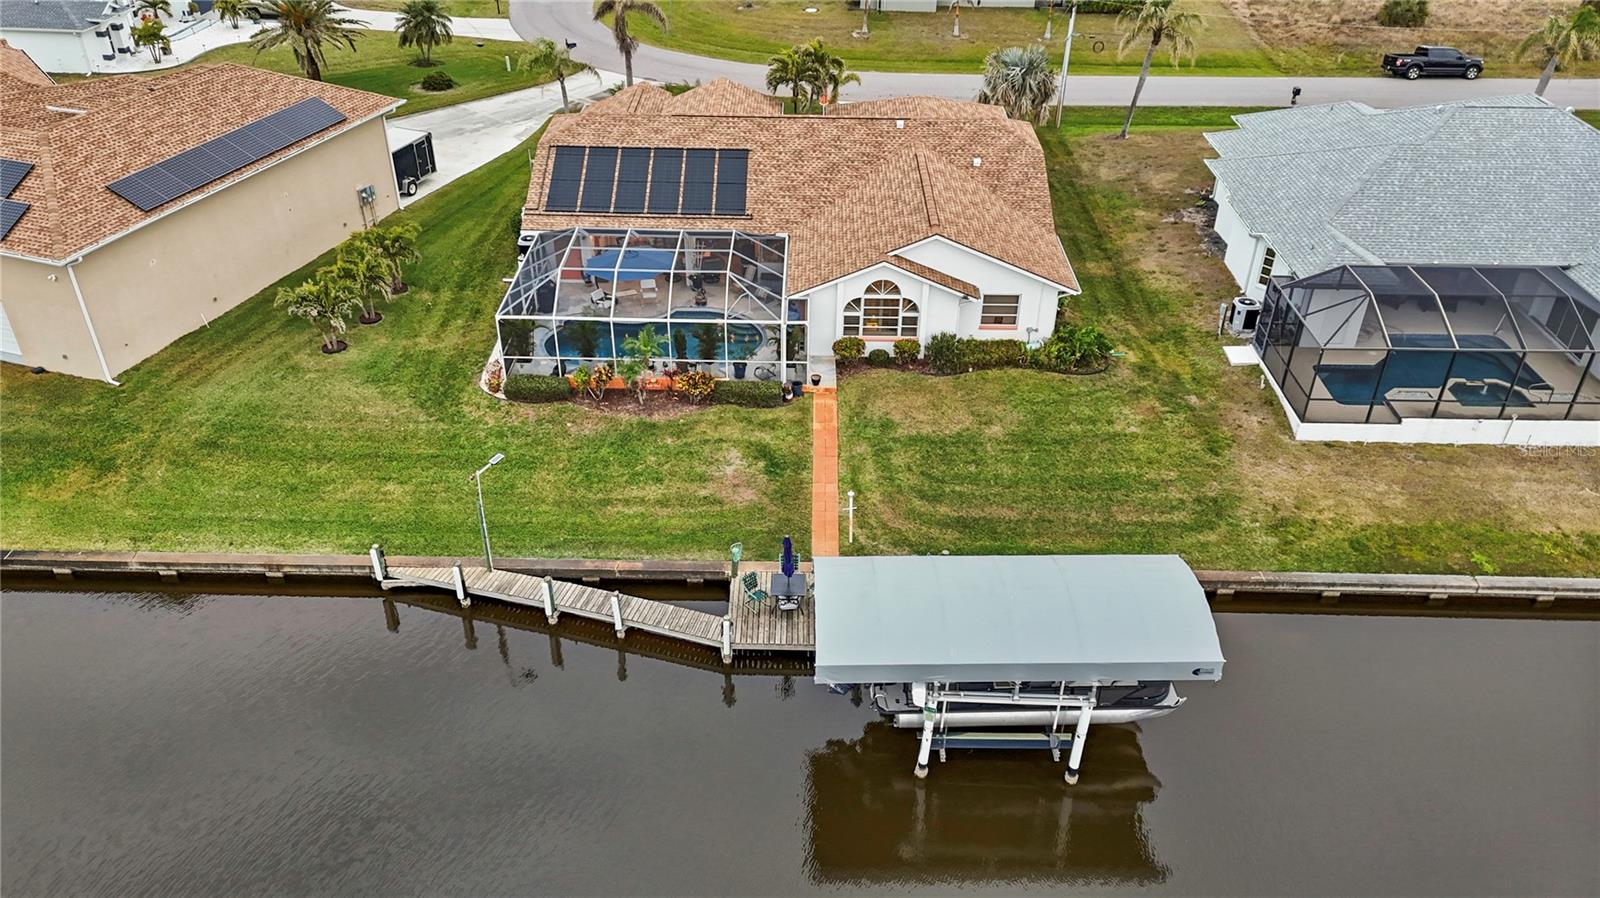
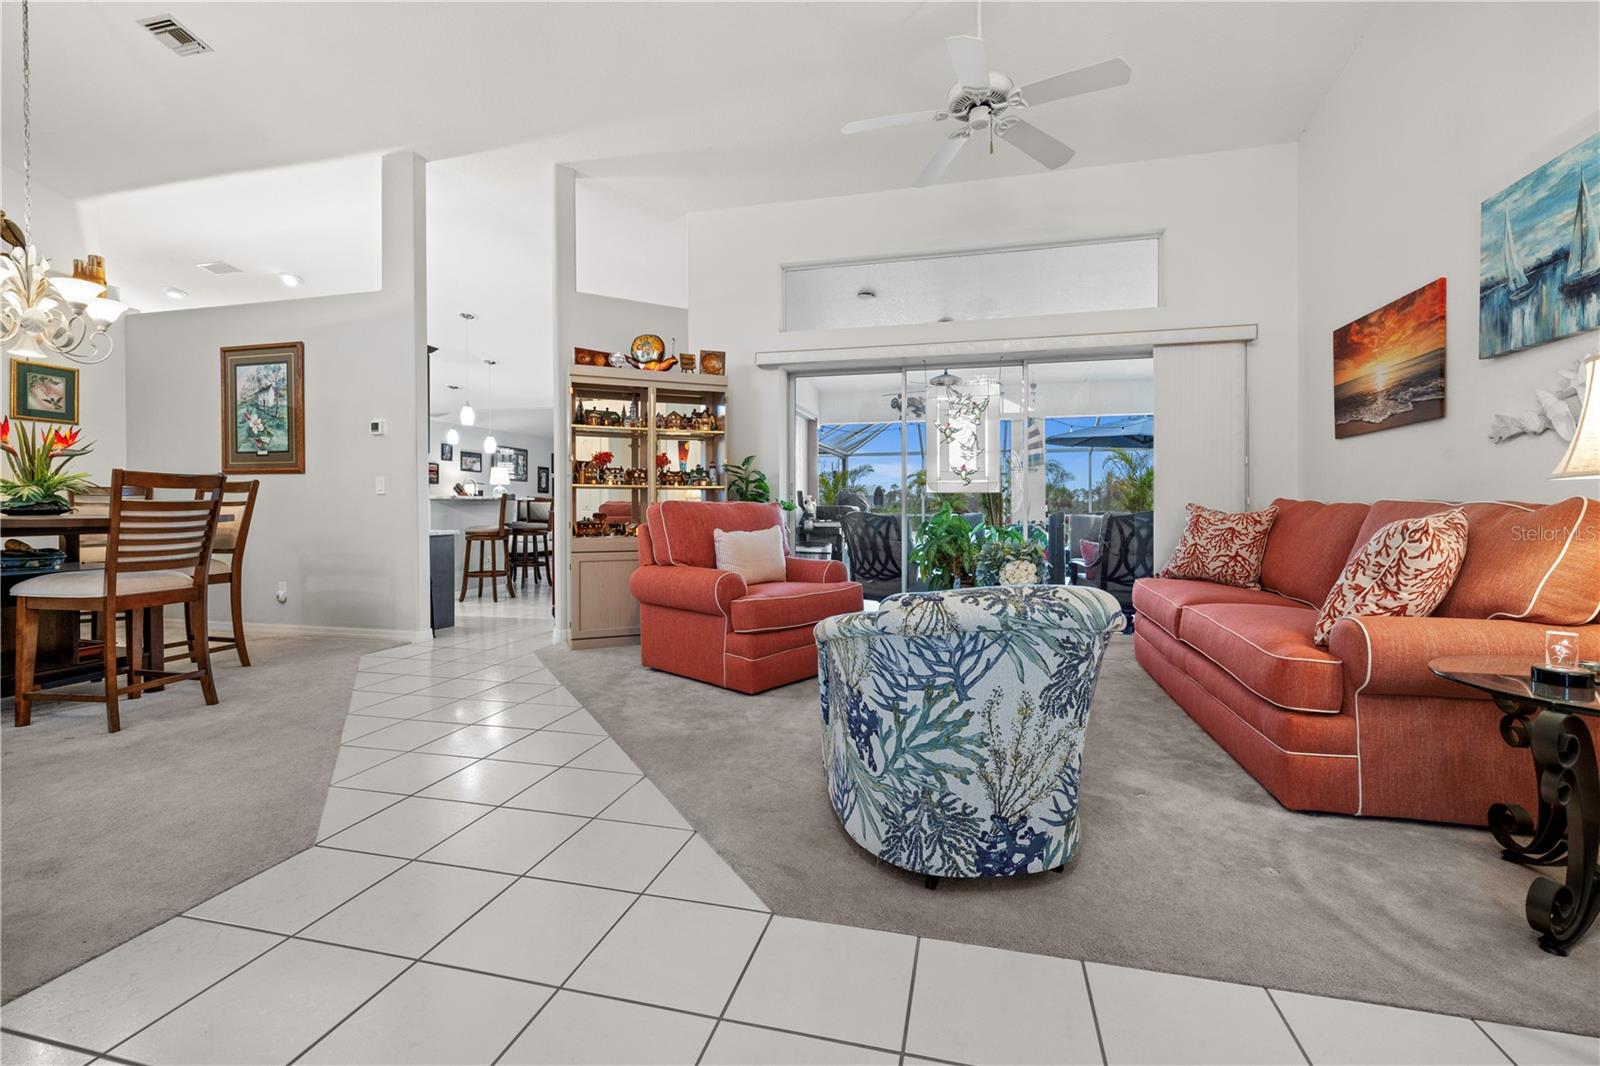
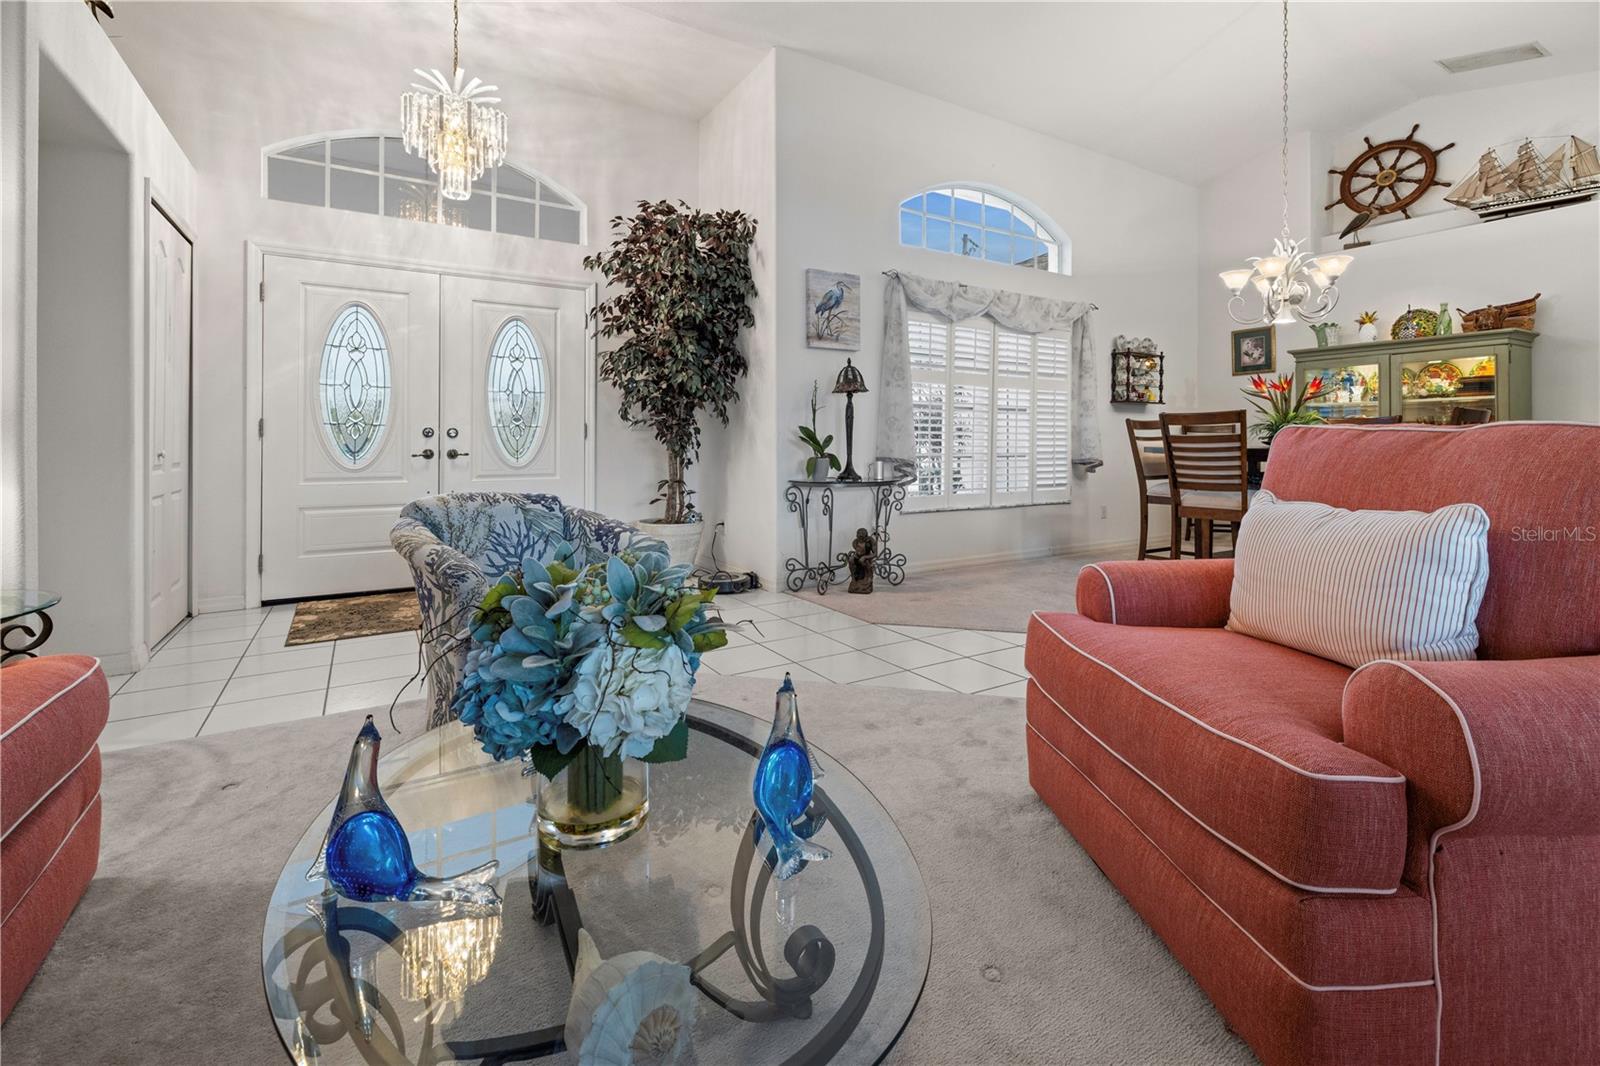
Property Description
EXCITING PRICE IMPROVEMENT—now is your chance to claim this waterfront home at an exceptional price! Nestled on the picturesque Santa Cruz Waterway, this Newport-built beauty offers direct Gulf access with no bridges, plus breathtaking views of the protected natural preserve. Step onto your private dock and set sail through bridge-free waters, leading you seamlessly to the Myakka River, Charlotte Harbor, and the Gulf of Mexico. Take a second look at this stunning canal-front home, now even more enticing with a recent price adjustment and a seller-offered home warranty at closing for added peace of mind. A true boater’s dream, this Newport-built home is perfectly positioned on the Santa Cruz Waterway, offering breathtaking views of the natural preserve as your only neighbor. Step onto your private dock, where your boat awaits to whisk you away through bridge-free waters to the lagoon, then effortlessly through the lock system to the Myakka River, Charlotte Harbor, and the Gulf of Mexico. While enjoying prime Gulf access, you’re also just minutes from the world-renowned beaches of Boca Grande and Manasota Key, as well as Sarasota’s shopping, fine dining, and premier golf courses. Inside, this thoughtfully designed split three-bedroom floor plan welcomes you with timeless elegance and sweeping waterfront views. Expansive pocketing glass doors blur the lines between indoor and outdoor spaces, leading to the screened lanai with electric roll-down screens for added privacy and storm protection. The recently screened pool cage (2023) encloses a refinished heated saltwater pool, creating a serene retreat. Boaters will love the 10’x30’ dock, 8,000 lb. canopied lift, and additional 35’ walkway with electric and water hookups. The updated kitchen boasts stainless steel appliances, granite countertops, subway tile backsplash, rich wood cabinetry, and a spacious breakfast bar, while an aquarium-style window offers a picturesque setting for al-fresco dining. Additional features include plantation shutters, a central vacuum system, vaulted ceilings, an indoor laundry area with extra storage, and an oversized garage with ample space and a 50 AMP RV hookup. The luxurious primary ensuite features dual closets, a garden tub, double sinks, a separate shower, and a private water closet, while the guest bedrooms are tucked behind a pocket door for added privacy. Notable upgrades include a new roof (2023), new front doors (2023), Storm Smart Shutters (2024), a solar-powered pool heating system (2024), a boat lift canopy (2024), and a 50 AMP RV charger, among many others. With this fresh price reduction, this waterfront dream home presents an unbeatable opportunity to make this one your forever home.
Build Your Team
Quickly find investor-friendly professionals who can help you succeed in real estate investing at any stage of the investing journey.


Agents
Match with investor-friendly agents who can help you find, analyze, and close your next deal


Lenders
Get the best funding…find investor-friendly lenders who specialize in your deal strategy


Property Managers
Transition to passive investing. Find a trusted property management partnership that lasts.


Tax Pros & Accountants
Taxes and financial reporting made easy—find experts to create tax savings strategies, file taxes, and more
Location
Property Details
Parking
- Description: Driveway, Garage Door Opener
- Details: Driveway, Garage Door Opener, Attached
- Garage Spaces: 2
- Spaces Total: 0
Bedroom Information
- # of Bedrooms: 3
Bathroom Information
- # of Baths (Full): 2
- # of Baths (Partial): 1
- # of Baths (Total): 3.0
Interior Features
- # of Rooms: 11
- # of Stories: 1
Exterior Features
- Exterior Walls Materials: Concrete Block
- Foundation: Slab
- Roof Material: Shingle
- Pool: Yes
HOA
- Has HOA: Yes
- Association: South Gulf Cove Homeowners Association
- HOA Fee: $120/annually
Land Information
- Land Use: Residential
- Land Use Subtype: Single Family Residential
Lot Information
- Parcel ID: 412127456005
- Lot Size: 10000 sqft
Property Information
- Property Type: Single Family Residence
- Style: Florida
- Year Built: 1998
Tax Information
- Annual Tax: $5,863
Utilities
- Water & Sewer: Public
- Heating: Heat Pump
- Cooling: Central Air
Location
- County: Charlotte
Listing Details
Investment Summary
- Monthly Cash Flow
- -$1,064
- Cap Rate
- 4.2%
- Cash-on-Cash Return
- -8.6%
- Debt Coverage Ratio
- 0.68
- Internal Rate of Return (5 years)
- -4.3%
Cash Flow
Net Operating Income (NOI) minus mortgage payments.
Calculation:
NOI - Mortgage Payments
Cap Rate (Market Value)
Capitalization Rate is a rate of return that compares the yearly Net Operating Income (NOI) to the market value.
Calculation:
NOI / Market Value
Cash-on-Cash Return (CoC)
Annual Cash Flow / Cash Invested
Calculation:
Annual cash flow divided by initial cash invested.
Debt Coverage Ratio (DCR)
Net Operating Income (NOI) divided by total debt payments.
Calculation:
NOI / Total Debt Payments
Internal Rate of Return (IRR)
A metric for assessing profitability over time. IRR is the discount rate at which the net present value (NPV) of all future cash flows (positive and negative) from an investment equals zero — including both periodic cash flow (such as rent) and a projected sale at the end of the holding period. It represents the expected annualized return, accounting for income, expenses, and the recovery of capital through a future sale.
Purchase Details
Purchase PriceThe price paid for the property. Purchase price:
| $649,000 |
|---|---|
Amount FinancedThe amount of the purchase financed through a loan. Amount financed:
| -$519,200 |
Down paymentThe initial payment made towards the purchase. Down payment:
| $129,800 |
Closing CostsFees and expenses associated with purchasing a property, typically ranging from 2% to 5% of the home’s purchase price, paid at the end of a home purchase to cover services like lending, title transfer, and taxes. Closing costs:
| $19,470 |
Rehab CostsCosts incurred to repair or improve the property, including: roof, flooring, exterior siding, kitchen, exterior paint, bathrooms, etc. Rehab costs:
| $0 |
Initial Cash InvestedThe total initial cash invested in the property. Calculation:Down payment + Buying costs + Rehab costs Initial cash invested:
| $149,270 |
Square Feet (SQFT)The total square footage of the property. Square feet:
| 2,330 |
Cost Per Square FootCost per square foot of the property. Calculation:Purchase Price / Square Feet Cost per square foot:
| $279 |
Monthly Rent Per Square FootMonthly rent divided by the number of square feet. This ratio helps investors compare rental income efficiency across properties, markets, and unit sizes Calculation:Monthly Rent / Square Feet Monthly rent per square foot:
| $1.72 |
Financing Details
Loan AmountThe total sum of money borrowed from a lender to finance a property purchase. Calculation:Purchase Price - Down Payment
Loan amount:
| $519,200 |
|---|---|
Loan to Value Ratio (LTV)Loan amount divided by the market value of the property. Calculation:Loan Amount / Market Value
Loan to value ratio:
| 80.0% |
Loan TypeThe type of loan (e.g., fixed, adjustable).
Loan type:
| Amortizing |
TermThe loan repayment period in years.
Term:
| 30 years |
Interest RateThe percentage a lender charges on the borrowed amount of a loan, determining the cost of borrowing money.
Interest rate:
| 6.625% |
Principal & Interest (PI)The principal is the portion of the loan payment that reduces the loan balance. The interest is the lender's charge for borrowing money. Calculation:(P * r * (1 + r) ** n) / ((1 + r) ** n - 1) Where:
P = Loan amount (principal)
Principal & interest:
| $3,325 |
Property TaxesAnnual taxes levied by local governments on real estate properties. These taxes fund public services like schools, roads, and emergency services.
Property tax:
| $489 |
InsuranceThe costs for insurance coverage to protect against financial losses due to risks like fire, natural disasters, theft, liability, or tenant-related damages. Calculation:Assumes 7% of gross rental income, unless insurance rates are specified.
Insurance:
| $280 |
Private Mortgage Insurance (PMI)A fee that borrowers pay when they take out a conventional loan with a loan-to-value (LTV) ratio above 80%.
Private mortgage insurance (PMI):
| $0 |
Monthly PaymentThe fixed amount a borrower pays each month to repay a loan. It typically includes principal and interest (P&I) and may also cover property taxes, insurance, HOA fees, and PMI if escrowed. Monthly payment:
| $4,094 |
Operating Income
| % Rent | Monthly | Yearly | |
|---|---|---|---|
Gross RentThe total rental income received from tenants before deducting any expenses. Includes base rent, late fees, pet fees, parking fees, and other recurring charges.
Gross rent:
| $4,000 | $48,000 | |
Vacancy LossExpected loss of rent due to vacancies.
Vacancy loss:
(6%)
| 6% | -$240 | -$2,880 |
Operating IncomeGross rental income minus vacancy loss. Calculation:Gross rent - Vacancy loss
Operating income:
| $3,760 | $45,120 |
Operating Expenses
| % Rent | Monthly | Yearly | |
|---|---|---|---|
Property TaxesAnnual taxes levied by local governments on real estate properties. These taxes fund public services like schools, roads, and emergency services. | 12% | -$489 | -$5,863 |
InsuranceThe costs for insurance coverage to protect against financial losses due to risks like fire, natural disasters, theft, liability, or tenant-related damages. Calculation:Assumes 7% of gross rental income, unless insurance rates are specified. | 7% | -$280 | -$3,360 |
Property ManagementThe costs associated with hiring a property manager to handle the day-to-day operations of a rental property. Includes management fees, leasing fes, eviction fees, etc. Calculation:Assumes 8% of gross rental income. | 8% | -$320 | -$3,840 |
Repairs & MaintenanceOngoing costs for routine upkeep and minor fixes needed to keep a property in good working condition. Calculation:Assumes 5% of gross rental income. Varies by property age and condition. | 5% | -$200 | -$2,400 |
Capital ExpensesLarge, infrequent costs for major improvements or replacements, like a new roof, HVAC system, or appliances. Calculation:Assumes 5% of gross rental income. Varies by property age. | 5% | -$200 | -$2,400 |
HOA FeesRegular dues paid to a Homeowners Association for community maintenance, amenities, and management. Similar fees include: Condo Association Fees, Co-op Maintenance Fees, etc. | 0% | -$10 | -$120 |
Operating ExpensesRecurring costs required to maintain and manage a rental property, including property taxes, insurance, maintenance, repairs, utilities (if paid by the owner), property management fees, and other day-to-day expenses. Calculation:Insurance + Property Taxes + Property Management + Repairs & Maintenance + Capital Expenditures + HOA Fees | 37% | -$1,499 | -$17,983 |
Cash Flow
| Monthly | Yearly | |
|---|---|---|
Net Operating Income (NOI)The income generated from a property after deducting all operating expenses but before deducting mortgage payments, taxes, and capital expenditures. Calculation:Gross Operating Income - Operating Expenses
Net operating income:
| $2,261 | $27,132 |
Mortgage PaymentThe fixed amount a borrower pays each month to repay a loan. It typically includes principal and interest (P&I) and may also cover property taxes, insurance, HOA fees, and PMI if escrowed. | -$3,325 | -$39,900 |
Cash FlowNet Operating Income (NOI) minus mortgage payments. Calculation:NOI - Mortgage Payments | $1,064 | $12,768 |