$749,900
Investment Summary
- Monthly Cash Flow
- -$1,762
- Cap Rate
- 3.3%
- Cash-on-Cash Return
- -12.3%
- Debt Coverage Ratio
- 0.54
- Internal Rate of Return (5 years)
- -7.9%
Cash Flow
Net Operating Income (NOI) minus mortgage payments.
Calculation:
NOI - Mortgage Payments
Cap Rate (Market Value)
Capitalization Rate is a rate of return that compares the yearly Net Operating Income (NOI) to the market value.
Calculation:
NOI / Market Value
Cash-on-Cash Return (CoC)
Annual Cash Flow / Cash Invested
Calculation:
Annual cash flow divided by initial cash invested.
Debt Coverage Ratio (DCR)
Net Operating Income (NOI) divided by total debt payments.
Calculation:
NOI / Total Debt Payments
Internal Rate of Return (IRR)
A metric for assessing profitability over time. IRR is the discount rate at which the net present value (NPV) of all future cash flows (positive and negative) from an investment equals zero — including both periodic cash flow (such as rent) and a projected sale at the end of the holding period. It represents the expected annualized return, accounting for income, expenses, and the recovery of capital through a future sale.
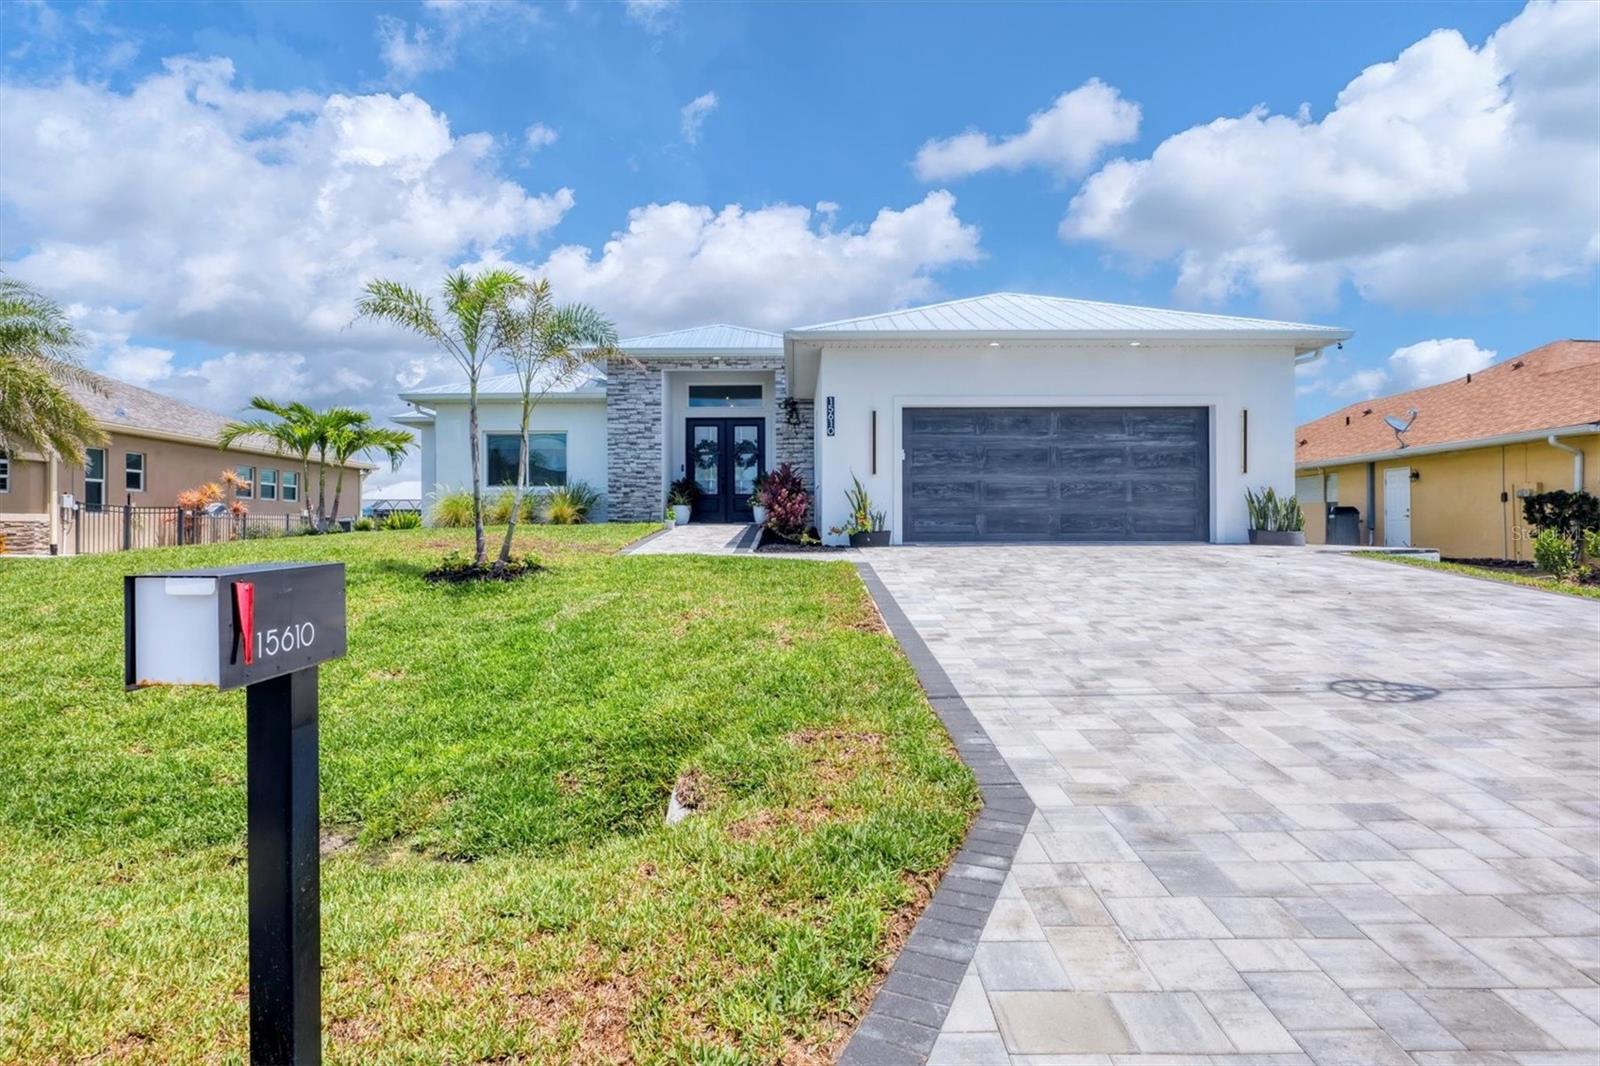
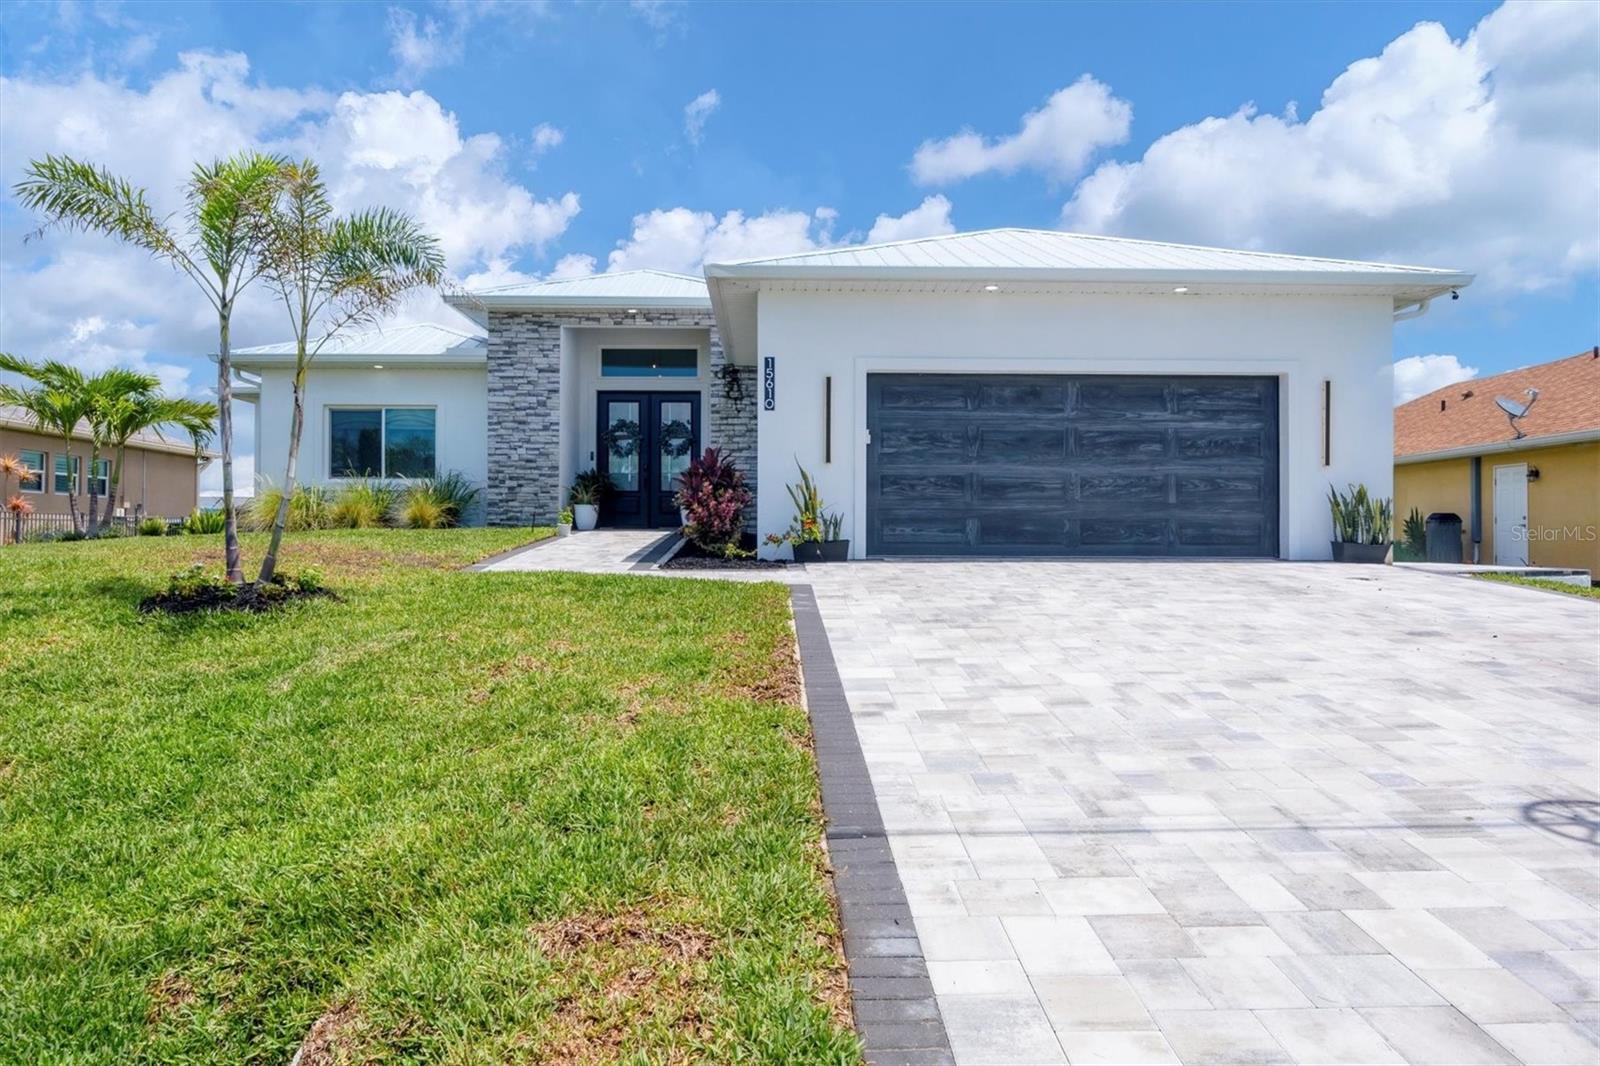
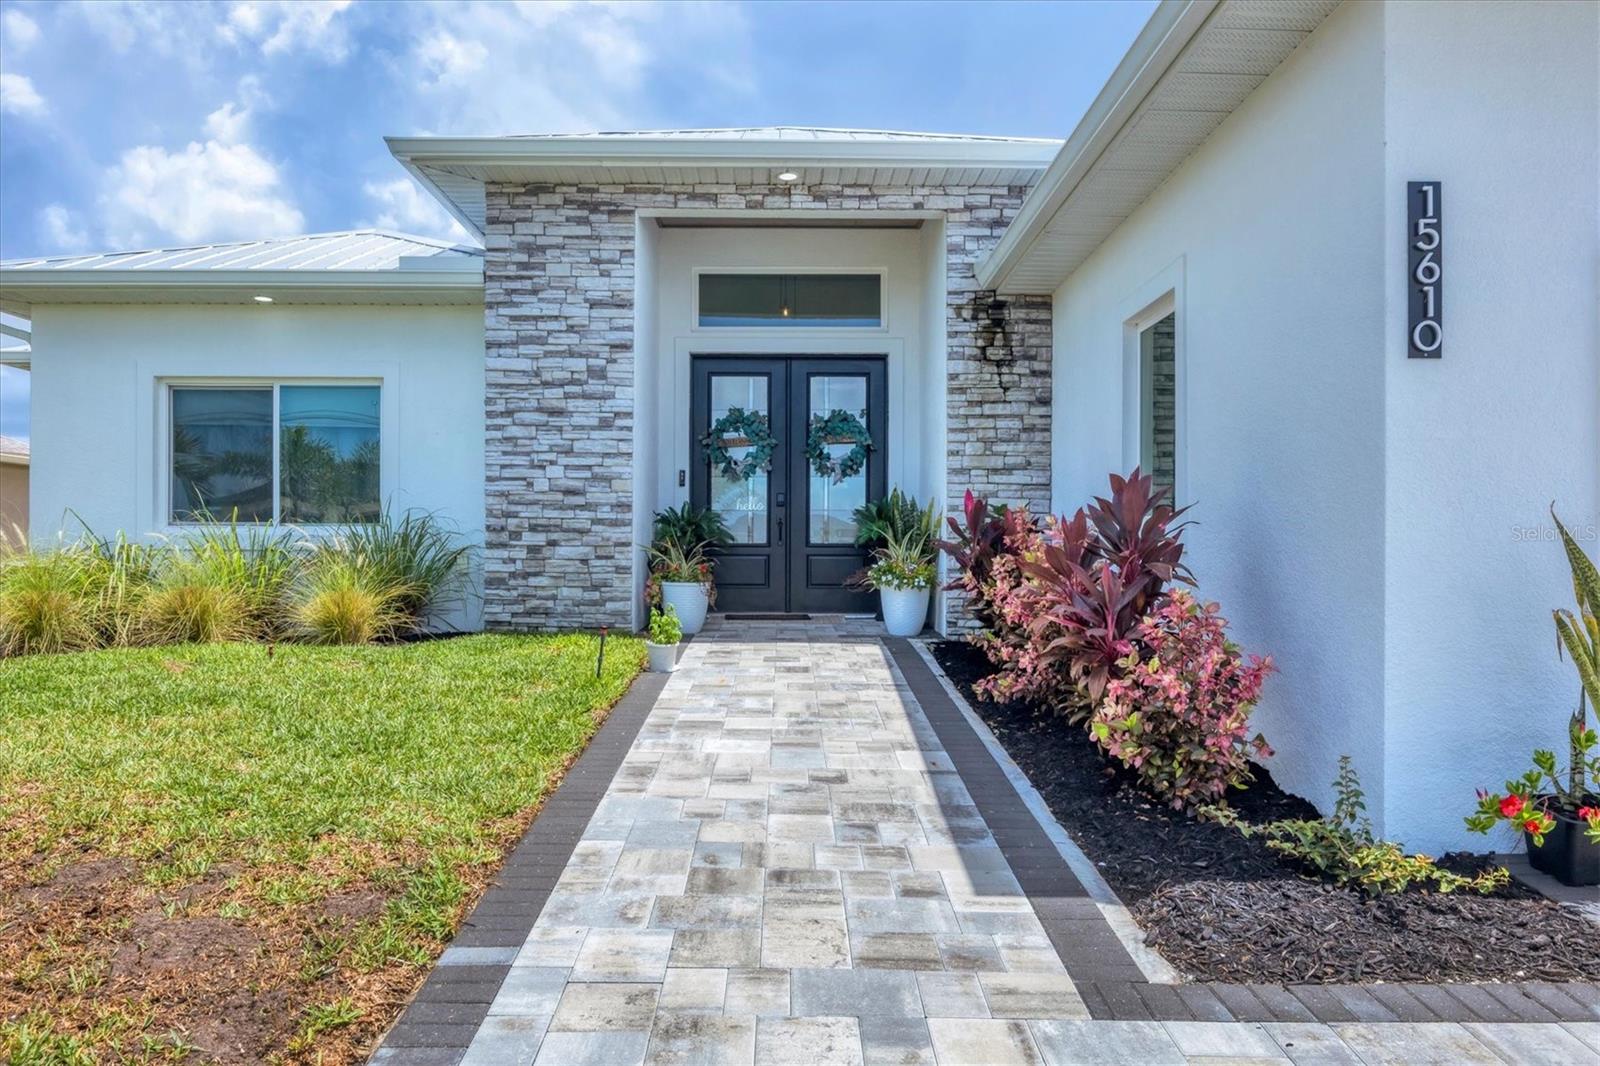
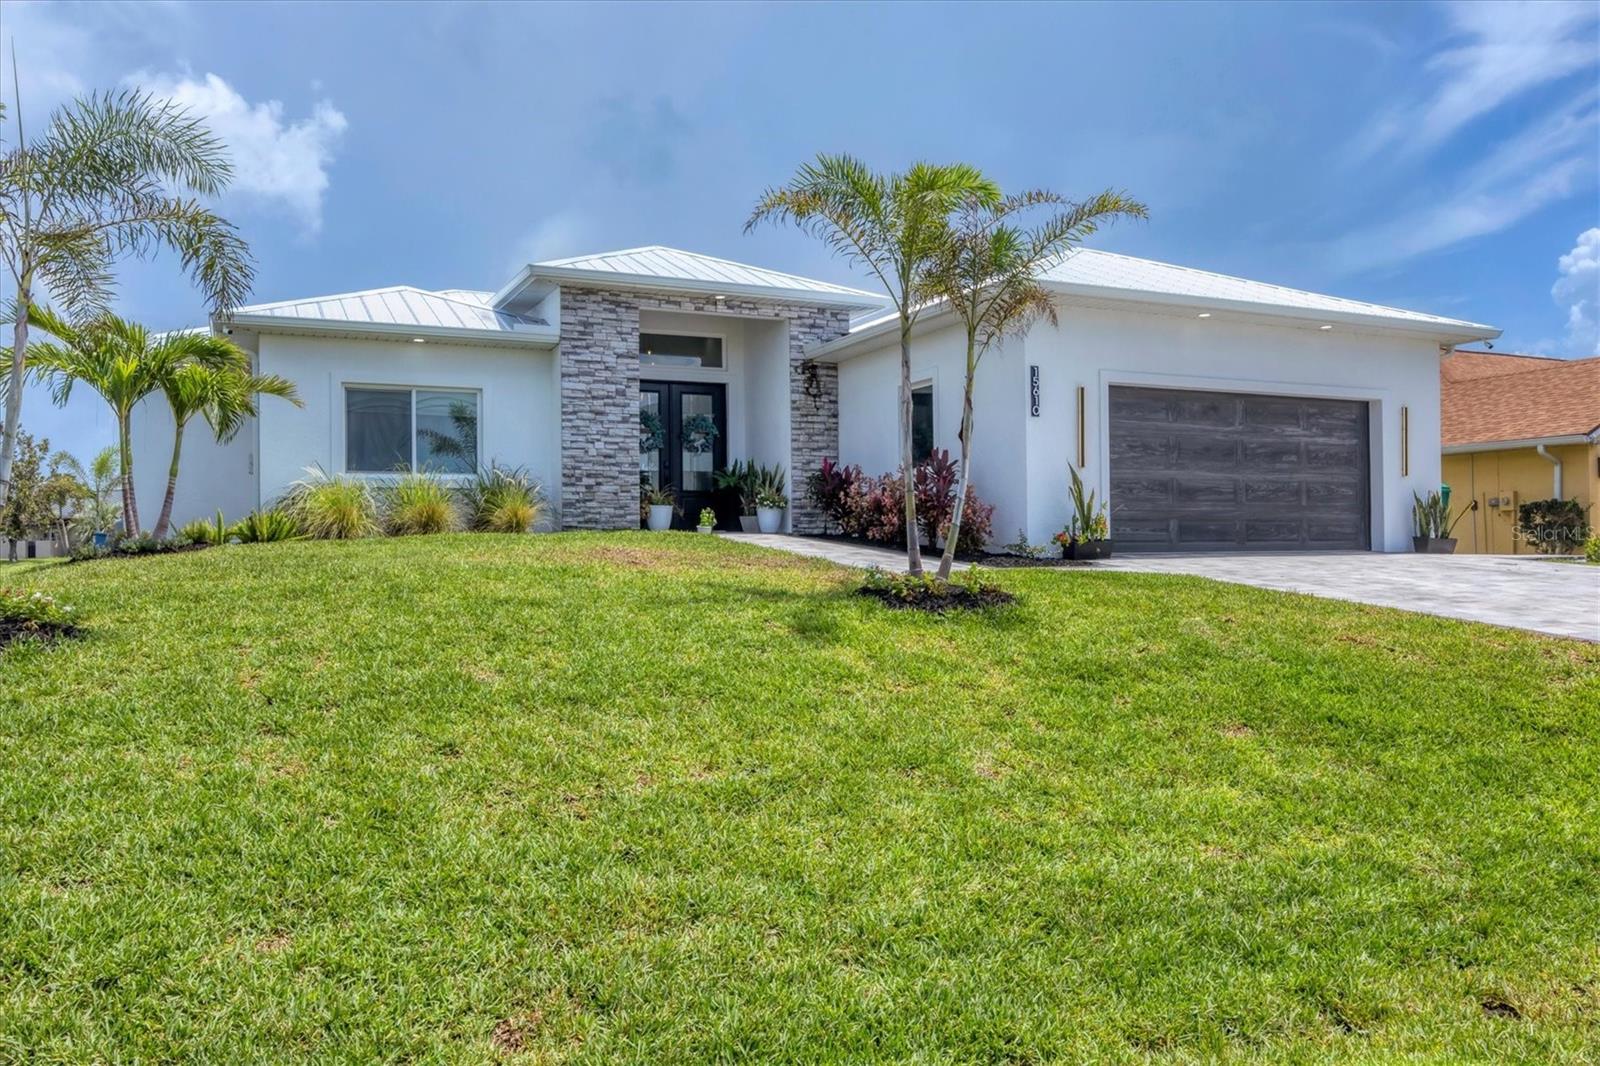
Property Description
Gulf Access Luxury Living – Smart, Secure and Storm Ready! Experience the ultimate in coastal living with this stunning Gulf-access home, perfectly located just minutes from world-class beaches, shopping, restaurants, and premier golf courses. Every inch of this home has been thoughtfully designed with luxury, comfort, and style in mind — plus it's fully up to current code and WiFi smart-enabled! Enter through gorgeous double doors into a beautiful foyer that looks straight through to the huge screened in lanai. Your eye is quickly drawn to the canal that will lead you to the gulf. Looking around you will quicly relize you have found your piece on earth! Lets take you through this gorgeous home bit by bit. *Interior Highlights* Chef's dream kitchen features quartz countertops, brushed gold accents, high-end appliances (including oven with air fryer mode) and are wifi capable, pot filler, spice drawers, Pot and Pan drawers, soft-close cabinets/drawers & a large walk-in pantry. Expansive primary suite with breathtaking canal views, direct access to the covered & screened lanai, and transom windows for added natural light. Spa-like primary bathroom with a 9-ft double vanity, freestanding tub, stunning open shower with rain shower head and changing lights, multiple body sprayers, and a spray wand. Living room boasts spectacular canal views through oversized 4-panel hurricane-rated sliding doors. Spacious mudroom entry from garage, plus a large laundry room with ample storage. Interior walls are insulated (bearing and non-bearing). Laundry room has GE washer/drier wifi capable, deep wash sink and cabinets for storage. Gorgeous 2x4 foot porcelain tiles throughout the home. Beautiful functioning Fireplace insert in living room with multi light displays. *Structural & Exterior Features* Spray Foam in attic including Garage, METAL ROOF & hurricane-rated IMPACT WINDOWS and DOORS for peace of mind. Huge covered and screened lanai with custom tongue and groove ceiling overlooking the water – perfect for entertaining or relaxing. A 4 zone Irrigation system draws directly from the canal. Beautiful, professionally landscaped exterior with exceptional curb appeal. Hose bib on each corner of home. There is Attic Storage in this home for those storage bins only needed 1 time a year. *Waterfront Perks* 2025 Concrete Sea wall, 2025 10x30 ft dock with 10,000 lb boat lift - complete with water and electric, and a boat box, Only one bridge to the open Gulf, making your boating days seamless and unforgettable. Whether you're lounging on the lanai, entertaining in your exquisite kitchen, or exploring the endless nearby amenities, this home offers the best of Florida living. Don't miss your chance to own a true coastal gem! ?? Schedule your private showing today!
Build Your Team
Quickly find investor-friendly professionals who can help you succeed in real estate investing at any stage of the investing journey.


Agents
Match with investor-friendly agents who can help you find, analyze, and close your next deal


Lenders
Get the best funding…find investor-friendly lenders who specialize in your deal strategy


Property Managers
Transition to passive investing. Find a trusted property management partnership that lasts.


Tax Pros & Accountants
Taxes and financial reporting made easy—find experts to create tax savings strategies, file taxes, and more
Location
Property Details
Parking
- Details: Attached
- Garage Spaces: 2
- Spaces Total: 0
Bedroom Information
- # of Bedrooms: 3
Bathroom Information
- # of Baths (Full): 2
- # of Baths (Total): 2.0
Interior Features
- # of Rooms: 10
- Fireplace: Yes
Exterior Features
- Foundation: Slab
- Roof Material: Metal
HOA
- Association: South Gulf Cove - OPTIONAL
Land Information
- Land Use: Residential
- Land Use Subtype: Single Family Residential
Lot Information
- Parcel ID: 412127232008
- Lot Size: 10000 sqft
Property Information
- Property Type: Single Family Residence
- Year Built: 2024
Tax Information
- Annual Tax: $1,548
Utilities
- Water & Sewer: Public
- Heating: Electric
- Cooling: Central Air
Location
- County: Charlotte
Listing Details
Investment Summary
- Monthly Cash Flow
- -$1,762
- Cap Rate
- 3.3%
- Cash-on-Cash Return
- -12.3%
- Debt Coverage Ratio
- 0.54
- Internal Rate of Return (5 years)
- -7.9%
Cash Flow
Net Operating Income (NOI) minus mortgage payments.
Calculation:
NOI - Mortgage Payments
Cap Rate (Market Value)
Capitalization Rate is a rate of return that compares the yearly Net Operating Income (NOI) to the market value.
Calculation:
NOI / Market Value
Cash-on-Cash Return (CoC)
Annual Cash Flow / Cash Invested
Calculation:
Annual cash flow divided by initial cash invested.
Debt Coverage Ratio (DCR)
Net Operating Income (NOI) divided by total debt payments.
Calculation:
NOI / Total Debt Payments
Internal Rate of Return (IRR)
A metric for assessing profitability over time. IRR is the discount rate at which the net present value (NPV) of all future cash flows (positive and negative) from an investment equals zero — including both periodic cash flow (such as rent) and a projected sale at the end of the holding period. It represents the expected annualized return, accounting for income, expenses, and the recovery of capital through a future sale.
Purchase Details
Purchase PriceThe price paid for the property. Purchase price:
| $749,900 |
|---|---|
Amount FinancedThe amount of the purchase financed through a loan. Amount financed:
| -$599,920 |
Down paymentThe initial payment made towards the purchase. Down payment:
| $149,980 |
Closing CostsFees and expenses associated with purchasing a property, typically ranging from 2% to 5% of the home’s purchase price, paid at the end of a home purchase to cover services like lending, title transfer, and taxes. Closing costs:
| $22,497 |
Rehab CostsCosts incurred to repair or improve the property, including: roof, flooring, exterior siding, kitchen, exterior paint, bathrooms, etc. Rehab costs:
| $0 |
Initial Cash InvestedThe total initial cash invested in the property. Calculation:Down payment + Buying costs + Rehab costs Initial cash invested:
| $172,477 |
Square Feet (SQFT)The total square footage of the property. Square feet:
| 1,864 |
Cost Per Square FootCost per square foot of the property. Calculation:Purchase Price / Square Feet Cost per square foot:
| $402 |
Monthly Rent Per Square FootMonthly rent divided by the number of square feet. This ratio helps investors compare rental income efficiency across properties, markets, and unit sizes Calculation:Monthly Rent / Square Feet Monthly rent per square foot:
| $1.72 |
Financing Details
Loan AmountThe total sum of money borrowed from a lender to finance a property purchase. Calculation:Purchase Price - Down Payment
Loan amount:
| $599,920 |
|---|---|
Loan to Value Ratio (LTV)Loan amount divided by the market value of the property. Calculation:Loan Amount / Market Value
Loan to value ratio:
| 80.0% |
Loan TypeThe type of loan (e.g., fixed, adjustable).
Loan type:
| Amortizing |
TermThe loan repayment period in years.
Term:
| 30 years |
Interest RateThe percentage a lender charges on the borrowed amount of a loan, determining the cost of borrowing money.
Interest rate:
| 6.625% |
Principal & Interest (PI)The principal is the portion of the loan payment that reduces the loan balance. The interest is the lender's charge for borrowing money. Calculation:(P * r * (1 + r) ** n) / ((1 + r) ** n - 1) Where:
P = Loan amount (principal)
Principal & interest:
| $3,841 |
Property TaxesAnnual taxes levied by local governments on real estate properties. These taxes fund public services like schools, roads, and emergency services.
Property tax:
| $129 |
InsuranceThe costs for insurance coverage to protect against financial losses due to risks like fire, natural disasters, theft, liability, or tenant-related damages. Calculation:Assumes 7% of gross rental income, unless insurance rates are specified.
Insurance:
| $224 |
Private Mortgage Insurance (PMI)A fee that borrowers pay when they take out a conventional loan with a loan-to-value (LTV) ratio above 80%.
Private mortgage insurance (PMI):
| $0 |
Monthly PaymentThe fixed amount a borrower pays each month to repay a loan. It typically includes principal and interest (P&I) and may also cover property taxes, insurance, HOA fees, and PMI if escrowed. Monthly payment:
| $4,194 |
Operating Income
| % Rent | Monthly | Yearly | |
|---|---|---|---|
Gross RentThe total rental income received from tenants before deducting any expenses. Includes base rent, late fees, pet fees, parking fees, and other recurring charges.
Gross rent:
| $3,200 | $38,400 | |
Vacancy LossExpected loss of rent due to vacancies.
Vacancy loss:
(6%)
| 6% | -$192 | -$2,304 |
Operating IncomeGross rental income minus vacancy loss. Calculation:Gross rent - Vacancy loss
Operating income:
| $3,008 | $36,096 |
Operating Expenses
| % Rent | Monthly | Yearly | |
|---|---|---|---|
Property TaxesAnnual taxes levied by local governments on real estate properties. These taxes fund public services like schools, roads, and emergency services. | 4% | -$129 | -$1,548 |
InsuranceThe costs for insurance coverage to protect against financial losses due to risks like fire, natural disasters, theft, liability, or tenant-related damages. Calculation:Assumes 7% of gross rental income, unless insurance rates are specified. | 7% | -$224 | -$2,688 |
Property ManagementThe costs associated with hiring a property manager to handle the day-to-day operations of a rental property. Includes management fees, leasing fes, eviction fees, etc. Calculation:Assumes 8% of gross rental income. | 8% | -$256 | -$3,072 |
Repairs & MaintenanceOngoing costs for routine upkeep and minor fixes needed to keep a property in good working condition. Calculation:Assumes 5% of gross rental income. Varies by property age and condition. | 5% | -$160 | -$1,920 |
Capital ExpensesLarge, infrequent costs for major improvements or replacements, like a new roof, HVAC system, or appliances. Calculation:Assumes 5% of gross rental income. Varies by property age. | 5% | -$160 | -$1,920 |
HOA FeesRegular dues paid to a Homeowners Association for community maintenance, amenities, and management. Similar fees include: Condo Association Fees, Co-op Maintenance Fees, etc. | n/a | n/a | n/a |
Operating ExpensesRecurring costs required to maintain and manage a rental property, including property taxes, insurance, maintenance, repairs, utilities (if paid by the owner), property management fees, and other day-to-day expenses. Calculation:Insurance + Property Taxes + Property Management + Repairs & Maintenance + Capital Expenditures + HOA Fees | 29% | -$929 | -$11,148 |
Cash Flow
| Monthly | Yearly | |
|---|---|---|
Net Operating Income (NOI)The income generated from a property after deducting all operating expenses but before deducting mortgage payments, taxes, and capital expenditures. Calculation:Gross Operating Income - Operating Expenses
Net operating income:
| $2,079 | $24,948 |
Mortgage PaymentThe fixed amount a borrower pays each month to repay a loan. It typically includes principal and interest (P&I) and may also cover property taxes, insurance, HOA fees, and PMI if escrowed. | -$3,841 | -$46,092 |
Cash FlowNet Operating Income (NOI) minus mortgage payments. Calculation:NOI - Mortgage Payments | $1,762 | $21,144 |