$509,900
Investment Summary
- Monthly Cash Flow
- -$541
- Cap Rate
- 5.0%
- Cash-on-Cash Return
- -5.5%
- Debt Coverage Ratio
- 0.80
- Internal Rate of Return (5 years)
- -1.4%
Cash Flow
Net Operating Income (NOI) minus mortgage payments.
Calculation:
NOI - Mortgage Payments
Cap Rate (Market Value)
Capitalization Rate is a rate of return that compares the yearly Net Operating Income (NOI) to the market value.
Calculation:
NOI / Market Value
Cash-on-Cash Return (CoC)
Annual Cash Flow / Cash Invested
Calculation:
Annual cash flow divided by initial cash invested.
Debt Coverage Ratio (DCR)
Net Operating Income (NOI) divided by total debt payments.
Calculation:
NOI / Total Debt Payments
Internal Rate of Return (IRR)
A metric for assessing profitability over time. IRR is the discount rate at which the net present value (NPV) of all future cash flows (positive and negative) from an investment equals zero — including both periodic cash flow (such as rent) and a projected sale at the end of the holding period. It represents the expected annualized return, accounting for income, expenses, and the recovery of capital through a future sale.
Property Description
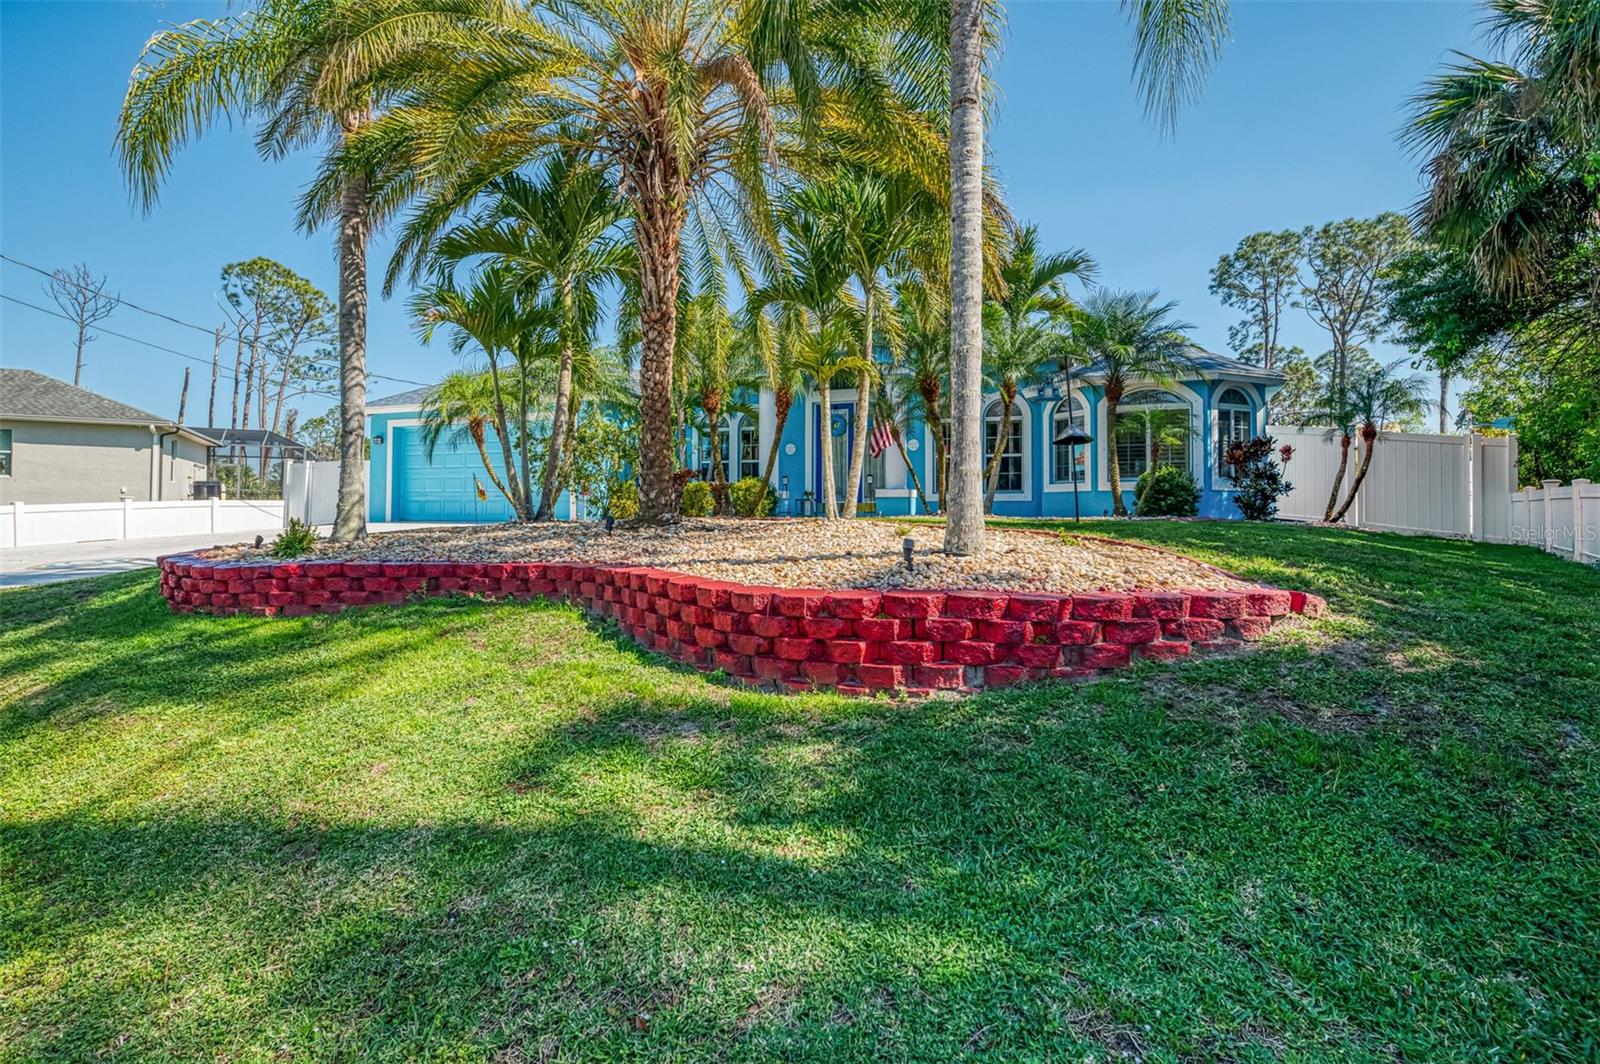
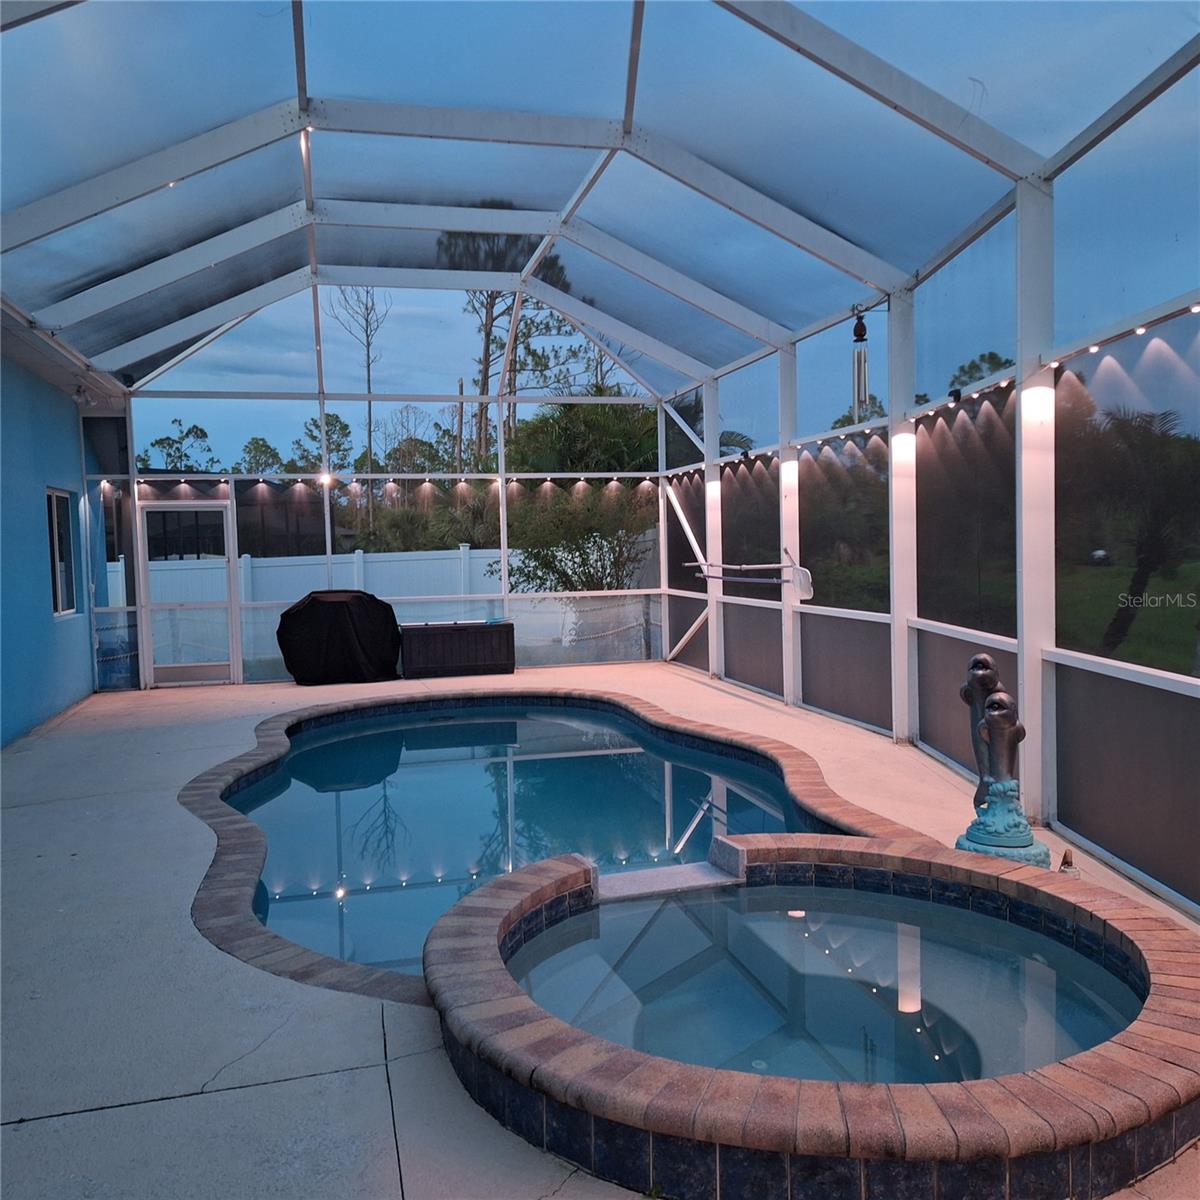
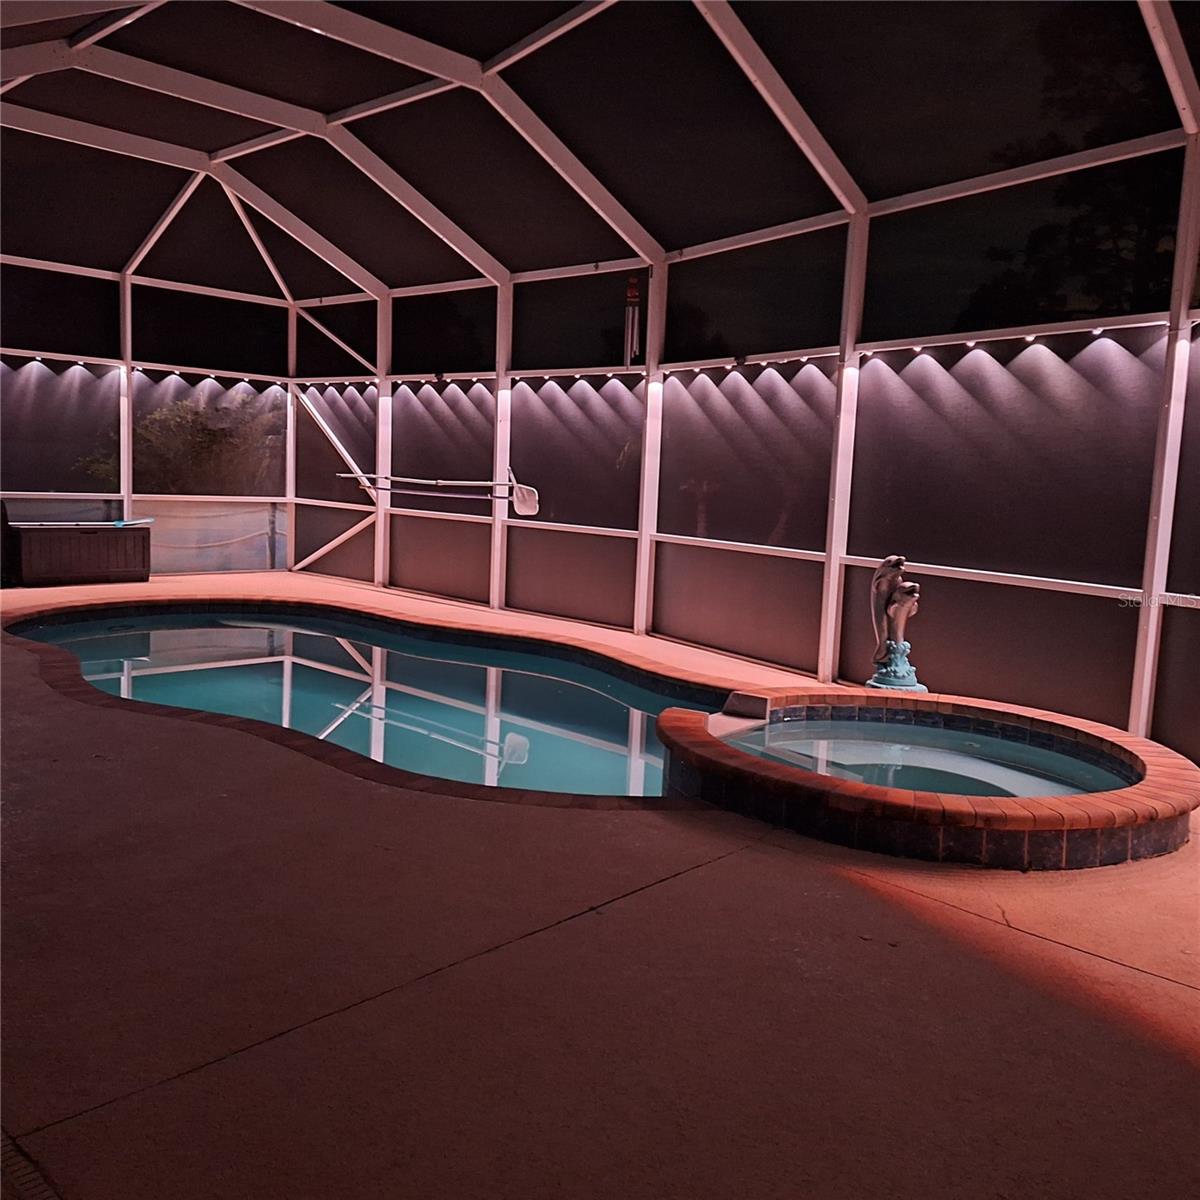
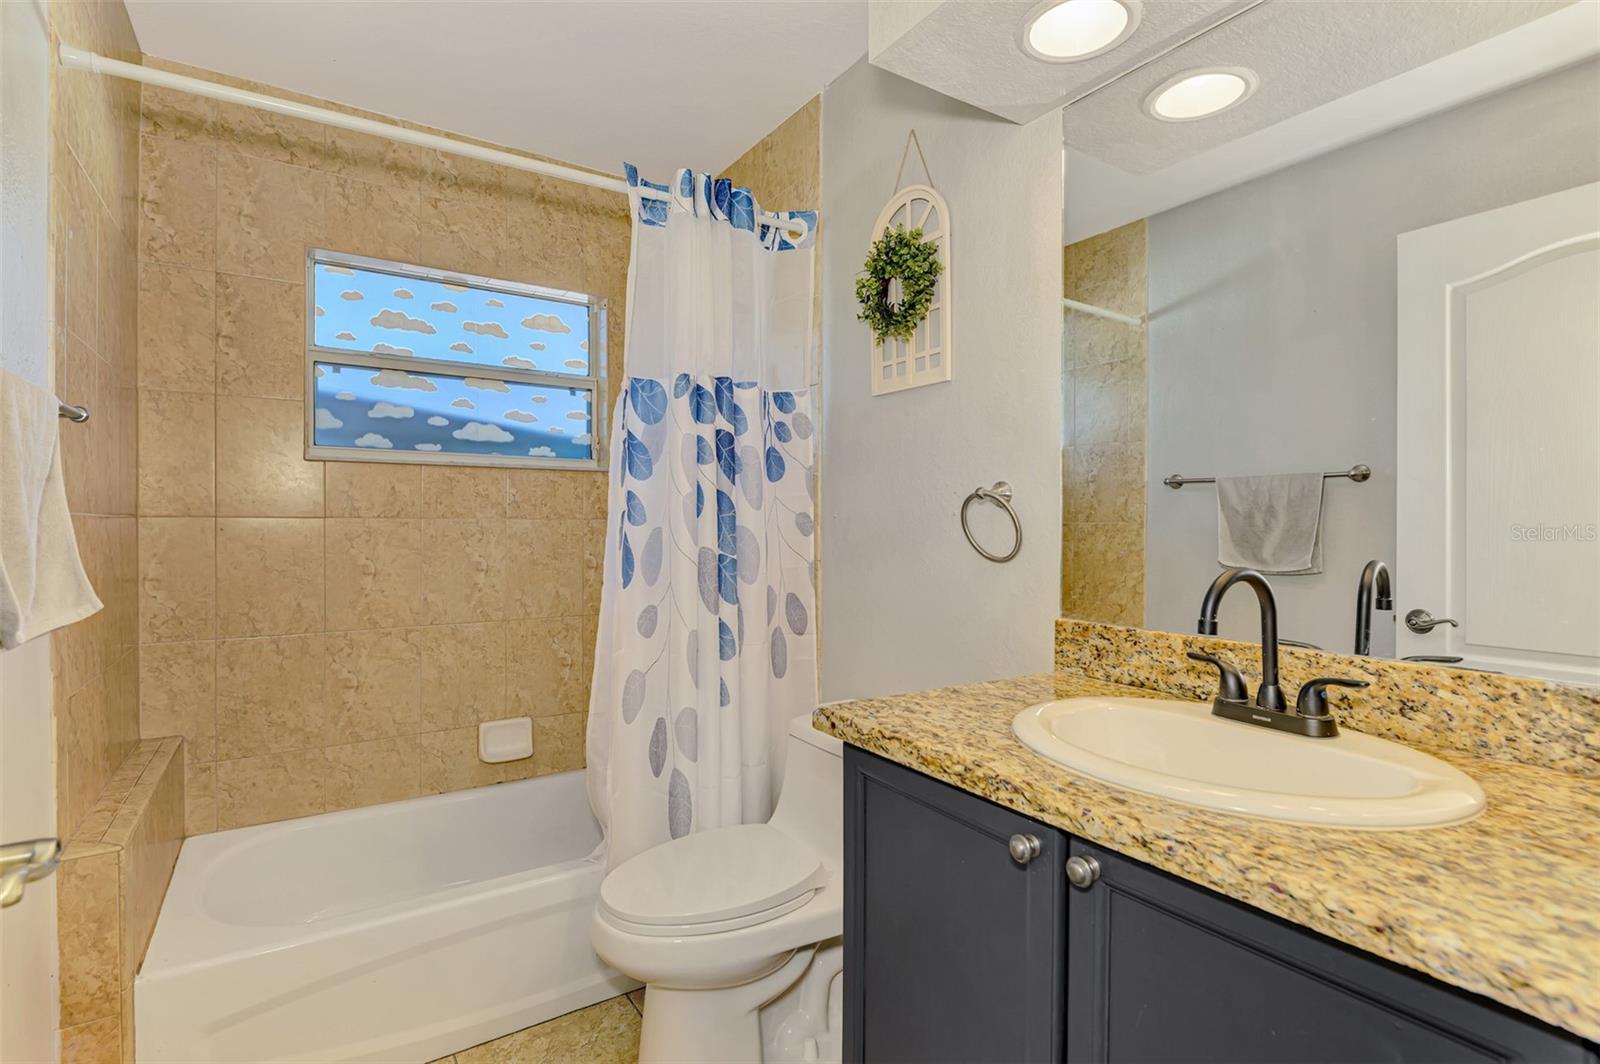
Extraordinary Custom Home with Heated Pool & Spa on a Stunning Oversized Lot! This impressive 3/4-bedroom, 2-bath, 2-car garage home offers 2,370 sq. ft. under air, blending luxury, comfort, and top-tier upgrades! Situated on an oversized 11,504 sq. ft. lot, this mini estate is completely fenced and backs onto a peaceful greenbelt, creating a serene and private retreat. Step inside and experience 10-foot ceilings adorned with elegant crown molding, adding a touch of grandeur throughout. The dedicated office, complete with 8-foot glass French doors and plantation shutters, provides flexibility as a fourth bedroom if needed. Every inch of this home boasts high-end upgrades, including new tile flooring in the bedrooms and bathrooms, new plumbing fixtures, and new ceiling fans and lighting in every room—including the porch and garage. The gourmet kitchen is designed for both function and style, featuring new stainless-steel appliances, a convection double oven, abundant counter space, a large breakfast bar, and a charming breakfast nook with aquarium glass that frames breathtaking views of the sparkling pool. A formal dining room with mirrored walls and an eye-catching window adds a sophisticated touch. The primary suite is a true retreat, offering an expansive layout with a private sitting area, a luxury en-suite bathroom with dual sinks, granite countertops, a separate garden tub, and a walk-in tiled shower. The additional bedrooms are generously sized, each with ceiling fans and ample closet space. Step outside, and prepare to be amazed! The resort-style heated pool and spa are surrounded by an expansive 26-foot lanai and an extended 32x36 pool deck, complete with a safety gate, dolphin fountain and a second storage shed for pool equipment. Beyond the pool cage, the property extends with a privacy easement, offering even more space to enjoy. This home is packed with upgraded features, including a whole-house reverse osmosis water purification system, new well pump, new AC (2023), new hot water heater (2022), brand new pool heater and pool pump, whole-house surge protector, fresh interior and exterior paint, a new shed, and a security system with built-in speakers. The garage features epoxy flooring, while the driveway and front porch showcase a custom dolphin design. There's even expanded parking to accommodate an RV, boat, or extra vehicles. The professionally landscaped yard is a tropical paradise, featuring $135,000 in premium landscaping, including mature palm trees, flowering shrubs, cherry trees, colored rock with weed guard protection, and custom concrete curbing around the front, side, and backyard. Home includes Hurricane shutters too. Located in North Port's desirable new home area, this spectacular property offers easy access to I-75, shopping, dining, Town Center Mall, and more. This home is one-of-a-kind—schedule your showing today!
Build Your Team
Quickly find investor-friendly professionals who can help you succeed in real estate investing at any stage of the investing journey.


Agents
Match with investor-friendly agents who can help you find, analyze, and close your next deal


Lenders
Get the best funding…find investor-friendly lenders who specialize in your deal strategy


Property Managers
Transition to passive investing. Find a trusted property management partnership that lasts.


Tax Pros & Accountants
Taxes and financial reporting made easy—find experts to create tax savings strategies, file taxes, and more
Location
Property Details
Parking
- Description: Attached Garage
- Details: Boat, Driveway, Garage Door Opener, Oversized, Parking Pad, RV Access/Parking, Attached
- Garage Spaces: 2
- Spaces Total: 0
Bedroom Information
- # of Bedrooms: 3
Bathroom Information
- # of Baths (Full): 2
- # of Baths (Total): 2.0
Interior Features
- # of Rooms: 9
- # of Stories: 1
Exterior Features
- Exterior Walls Materials: Stucco
- Foundation: Slab
- Roof Type: Hip
- Roof Material: Shingle
- Pool: Yes
Land Information
- Land Use: Residential
- Land Use Subtype: Single Family Residential
Lot Information
- Parcel ID: 1118165803
- Lot Size: 11504 sqft
Property Information
- Property Type: Single Family Residence
- Style: Florida
- Year Built: 2008
Tax Information
- Annual Tax: $3,434
Utilities
- Water & Sewer: Private, Well
- Heating: Electric
- Cooling: Central Air
Location
- County: Sarasota
Listing Details
Investment Summary
- Monthly Cash Flow
- -$541
- Cap Rate
- 5.0%
- Cash-on-Cash Return
- -5.5%
- Debt Coverage Ratio
- 0.80
- Internal Rate of Return (5 years)
- -1.4%
Cash Flow
Net Operating Income (NOI) minus mortgage payments.
Calculation:
NOI - Mortgage Payments
Cap Rate (Market Value)
Capitalization Rate is a rate of return that compares the yearly Net Operating Income (NOI) to the market value.
Calculation:
NOI / Market Value
Cash-on-Cash Return (CoC)
Annual Cash Flow / Cash Invested
Calculation:
Annual cash flow divided by initial cash invested.
Debt Coverage Ratio (DCR)
Net Operating Income (NOI) divided by total debt payments.
Calculation:
NOI / Total Debt Payments
Internal Rate of Return (IRR)
A metric for assessing profitability over time. IRR is the discount rate at which the net present value (NPV) of all future cash flows (positive and negative) from an investment equals zero — including both periodic cash flow (such as rent) and a projected sale at the end of the holding period. It represents the expected annualized return, accounting for income, expenses, and the recovery of capital through a future sale.
Purchase Details
Purchase PriceThe price paid for the property. Purchase price:
| $509,900 |
|---|---|
Amount FinancedThe amount of the purchase financed through a loan. Amount financed:
| -$407,920 |
Down paymentThe initial payment made towards the purchase. Down payment:
| $101,980 |
Closing CostsFees and expenses associated with purchasing a property, typically ranging from 2% to 5% of the home’s purchase price, paid at the end of a home purchase to cover services like lending, title transfer, and taxes. Closing costs:
| $15,297 |
Rehab CostsCosts incurred to repair or improve the property, including: roof, flooring, exterior siding, kitchen, exterior paint, bathrooms, etc. Rehab costs:
| $0 |
Initial Cash InvestedThe total initial cash invested in the property. Calculation:Down payment + Buying costs + Rehab costs Initial cash invested:
| $117,277 |
Square Feet (SQFT)The total square footage of the property. Square feet:
| 2,370 |
Cost Per Square FootCost per square foot of the property. Calculation:Purchase Price / Square Feet Cost per square foot:
| $215 |
Monthly Rent Per Square FootMonthly rent divided by the number of square feet. This ratio helps investors compare rental income efficiency across properties, markets, and unit sizes Calculation:Monthly Rent / Square Feet Monthly rent per square foot:
| $1.48 |
Financing Details
Loan AmountThe total sum of money borrowed from a lender to finance a property purchase. Calculation:Purchase Price - Down Payment
Loan amount:
| $407,920 |
|---|---|
Loan to Value Ratio (LTV)Loan amount divided by the market value of the property. Calculation:Loan Amount / Market Value
Loan to value ratio:
| 80.0% |
Loan TypeThe type of loan (e.g., fixed, adjustable).
Loan type:
| Amortizing |
TermThe loan repayment period in years.
Term:
| 30 years |
Interest RateThe percentage a lender charges on the borrowed amount of a loan, determining the cost of borrowing money.
Interest rate:
| 6.840% |
Principal & Interest (PI)The principal is the portion of the loan payment that reduces the loan balance. The interest is the lender's charge for borrowing money. Calculation:(P * r * (1 + r) ** n) / ((1 + r) ** n - 1) Where:
P = Loan amount (principal)
Principal & interest:
| $2,670 |
Property TaxesAnnual taxes levied by local governments on real estate properties. These taxes fund public services like schools, roads, and emergency services.
Property tax:
| $286 |
InsuranceThe costs for insurance coverage to protect against financial losses due to risks like fire, natural disasters, theft, liability, or tenant-related damages. Calculation:Assumes 7% of gross rental income, unless insurance rates are specified.
Insurance:
| $245 |
Private Mortgage Insurance (PMI)A fee that borrowers pay when they take out a conventional loan with a loan-to-value (LTV) ratio above 80%.
Private mortgage insurance (PMI):
| $0 |
Monthly PaymentThe fixed amount a borrower pays each month to repay a loan. It typically includes principal and interest (P&I) and may also cover property taxes, insurance, HOA fees, and PMI if escrowed. Monthly payment:
| $3,201 |
Operating Income
| % Rent | Monthly | Yearly | |
|---|---|---|---|
Gross RentThe total rental income received from tenants before deducting any expenses. Includes base rent, late fees, pet fees, parking fees, and other recurring charges.
Gross rent:
| $3,500 | $42,000 | |
Vacancy LossExpected loss of rent due to vacancies.
Vacancy loss:
(6%)
| 6% | -$210 | -$2,520 |
Operating IncomeGross rental income minus vacancy loss. Calculation:Gross rent - Vacancy loss
Operating income:
| $3,290 | $39,480 |
Operating Expenses
| % Rent | Monthly | Yearly | |
|---|---|---|---|
Property TaxesAnnual taxes levied by local governments on real estate properties. These taxes fund public services like schools, roads, and emergency services. | 8% | -$286 | -$3,434 |
InsuranceThe costs for insurance coverage to protect against financial losses due to risks like fire, natural disasters, theft, liability, or tenant-related damages. Calculation:Assumes 7% of gross rental income, unless insurance rates are specified. | 7% | -$245 | -$2,940 |
Property ManagementThe costs associated with hiring a property manager to handle the day-to-day operations of a rental property. Includes management fees, leasing fes, eviction fees, etc. Calculation:Assumes 8% of gross rental income. | 8% | -$280 | -$3,360 |
Repairs & MaintenanceOngoing costs for routine upkeep and minor fixes needed to keep a property in good working condition. Calculation:Assumes 5% of gross rental income. Varies by property age and condition. | 5% | -$175 | -$2,100 |
Capital ExpensesLarge, infrequent costs for major improvements or replacements, like a new roof, HVAC system, or appliances. Calculation:Assumes 5% of gross rental income. Varies by property age. | 5% | -$175 | -$2,100 |
HOA FeesRegular dues paid to a Homeowners Association for community maintenance, amenities, and management. Similar fees include: Condo Association Fees, Co-op Maintenance Fees, etc. | n/a | n/a | n/a |
Operating ExpensesRecurring costs required to maintain and manage a rental property, including property taxes, insurance, maintenance, repairs, utilities (if paid by the owner), property management fees, and other day-to-day expenses. Calculation:Insurance + Property Taxes + Property Management + Repairs & Maintenance + Capital Expenditures + HOA Fees | 33% | -$1,161 | -$13,934 |
Cash Flow
| Monthly | Yearly | |
|---|---|---|
Net Operating Income (NOI)The income generated from a property after deducting all operating expenses but before deducting mortgage payments, taxes, and capital expenditures. Calculation:Gross Operating Income - Operating Expenses
Net operating income:
| $2,129 | $25,548 |
Mortgage PaymentThe fixed amount a borrower pays each month to repay a loan. It typically includes principal and interest (P&I) and may also cover property taxes, insurance, HOA fees, and PMI if escrowed. | -$2,670 | -$32,040 |
Cash FlowNet Operating Income (NOI) minus mortgage payments. Calculation:NOI - Mortgage Payments | $541 | $6,492 |