
$1,249,000
Investment Summary
- Monthly Cash Flow
- -$3,626
- Cap Rate
- 2.8%
- Cash-on-Cash Return
- -15.1%
- Debt Coverage Ratio
- 0.44
- Internal Rate of Return (5 years)
- -10.7%
Cash Flow
Net Operating Income (NOI) minus mortgage payments.
Calculation:
NOI - Mortgage Payments
Cap Rate (Market Value)
Capitalization Rate is a rate of return that compares the yearly Net Operating Income (NOI) to the market value.
Calculation:
NOI / Market Value
Cash-on-Cash Return (CoC)
Annual Cash Flow / Cash Invested
Calculation:
Annual cash flow divided by initial cash invested.
Debt Coverage Ratio (DCR)
Net Operating Income (NOI) divided by total debt payments.
Calculation:
NOI / Total Debt Payments
Internal Rate of Return (IRR)
A metric for assessing profitability over time. IRR is the discount rate at which the net present value (NPV) of all future cash flows (positive and negative) from an investment equals zero — including both periodic cash flow (such as rent) and a projected sale at the end of the holding period. It represents the expected annualized return, accounting for income, expenses, and the recovery of capital through a future sale.
Property Description
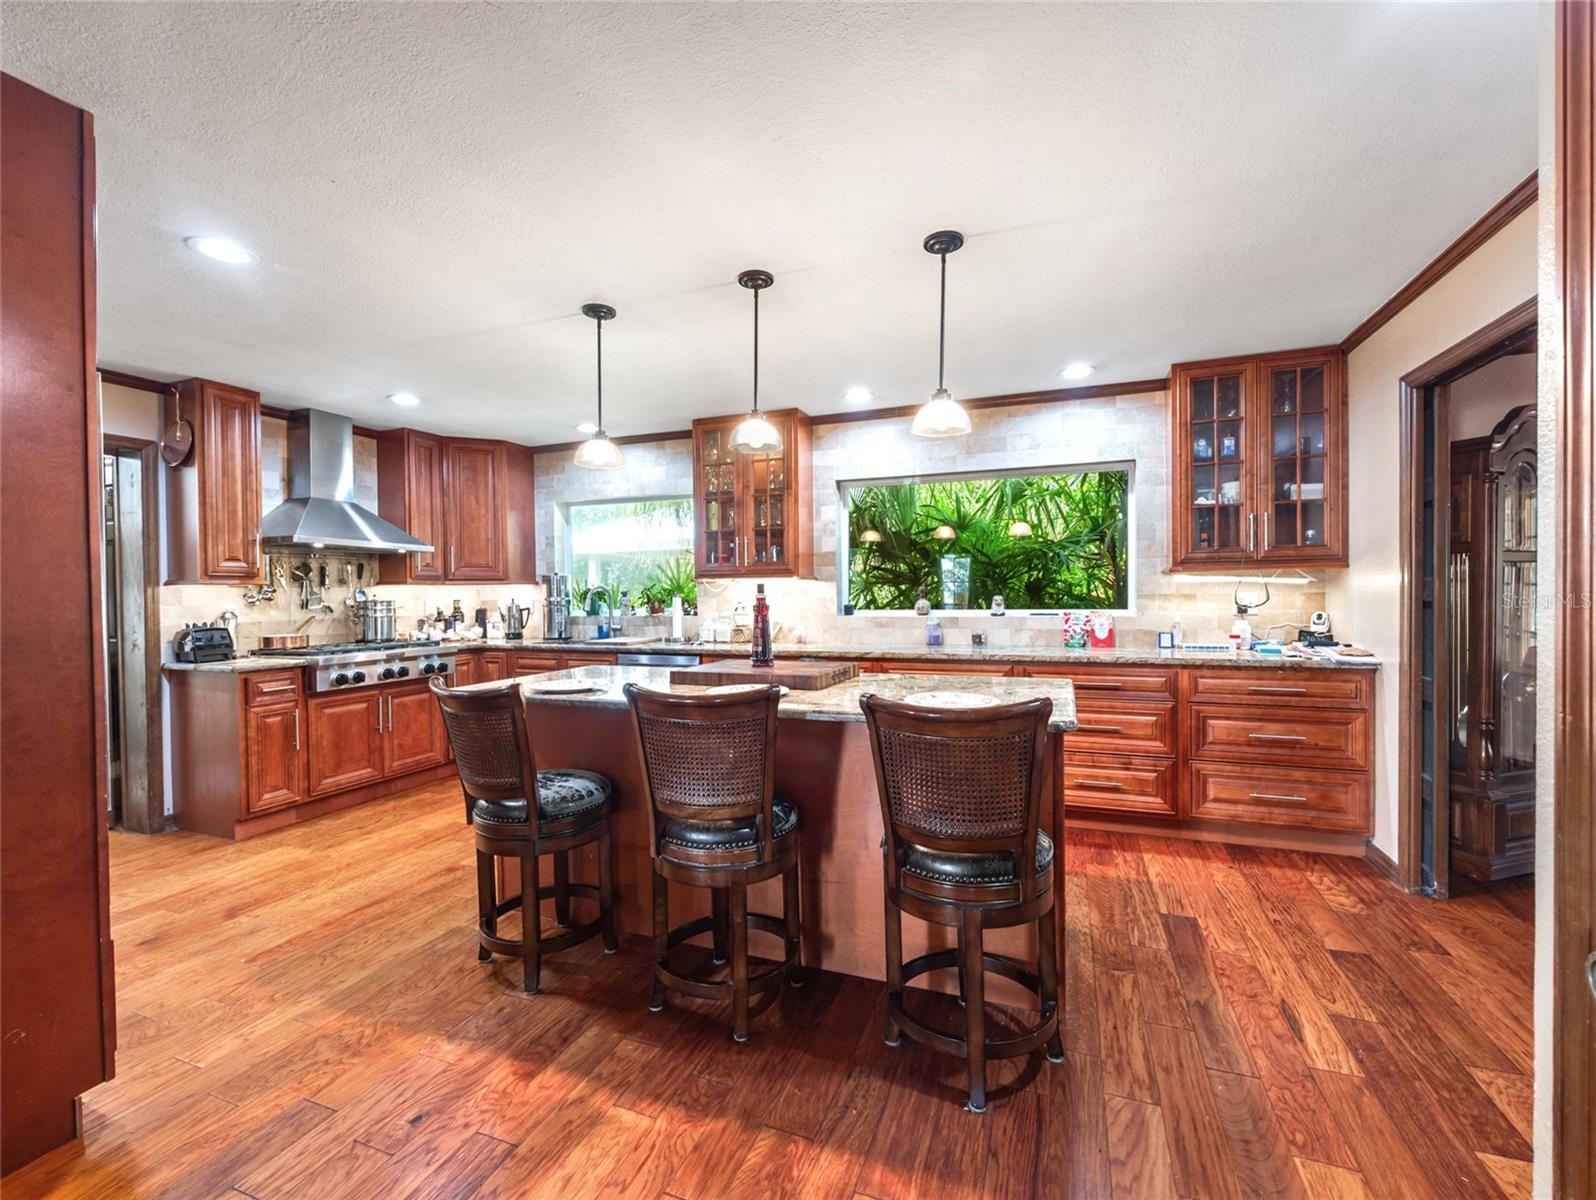
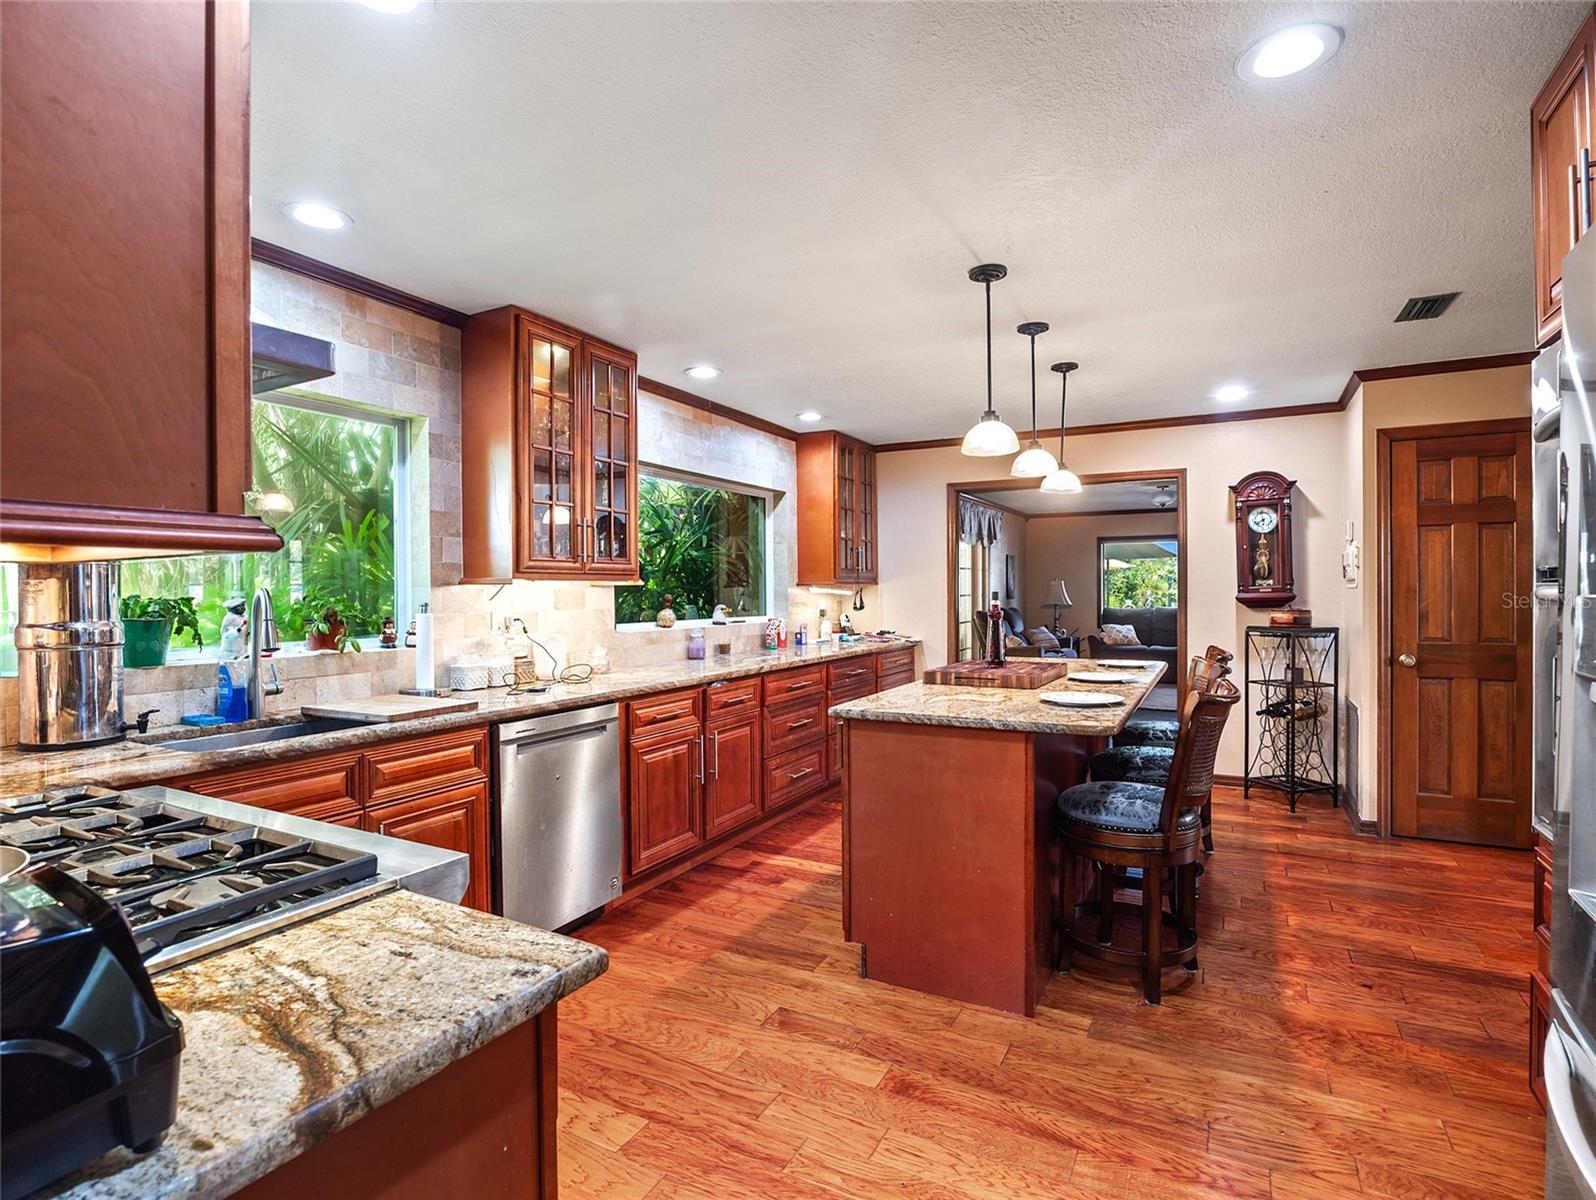
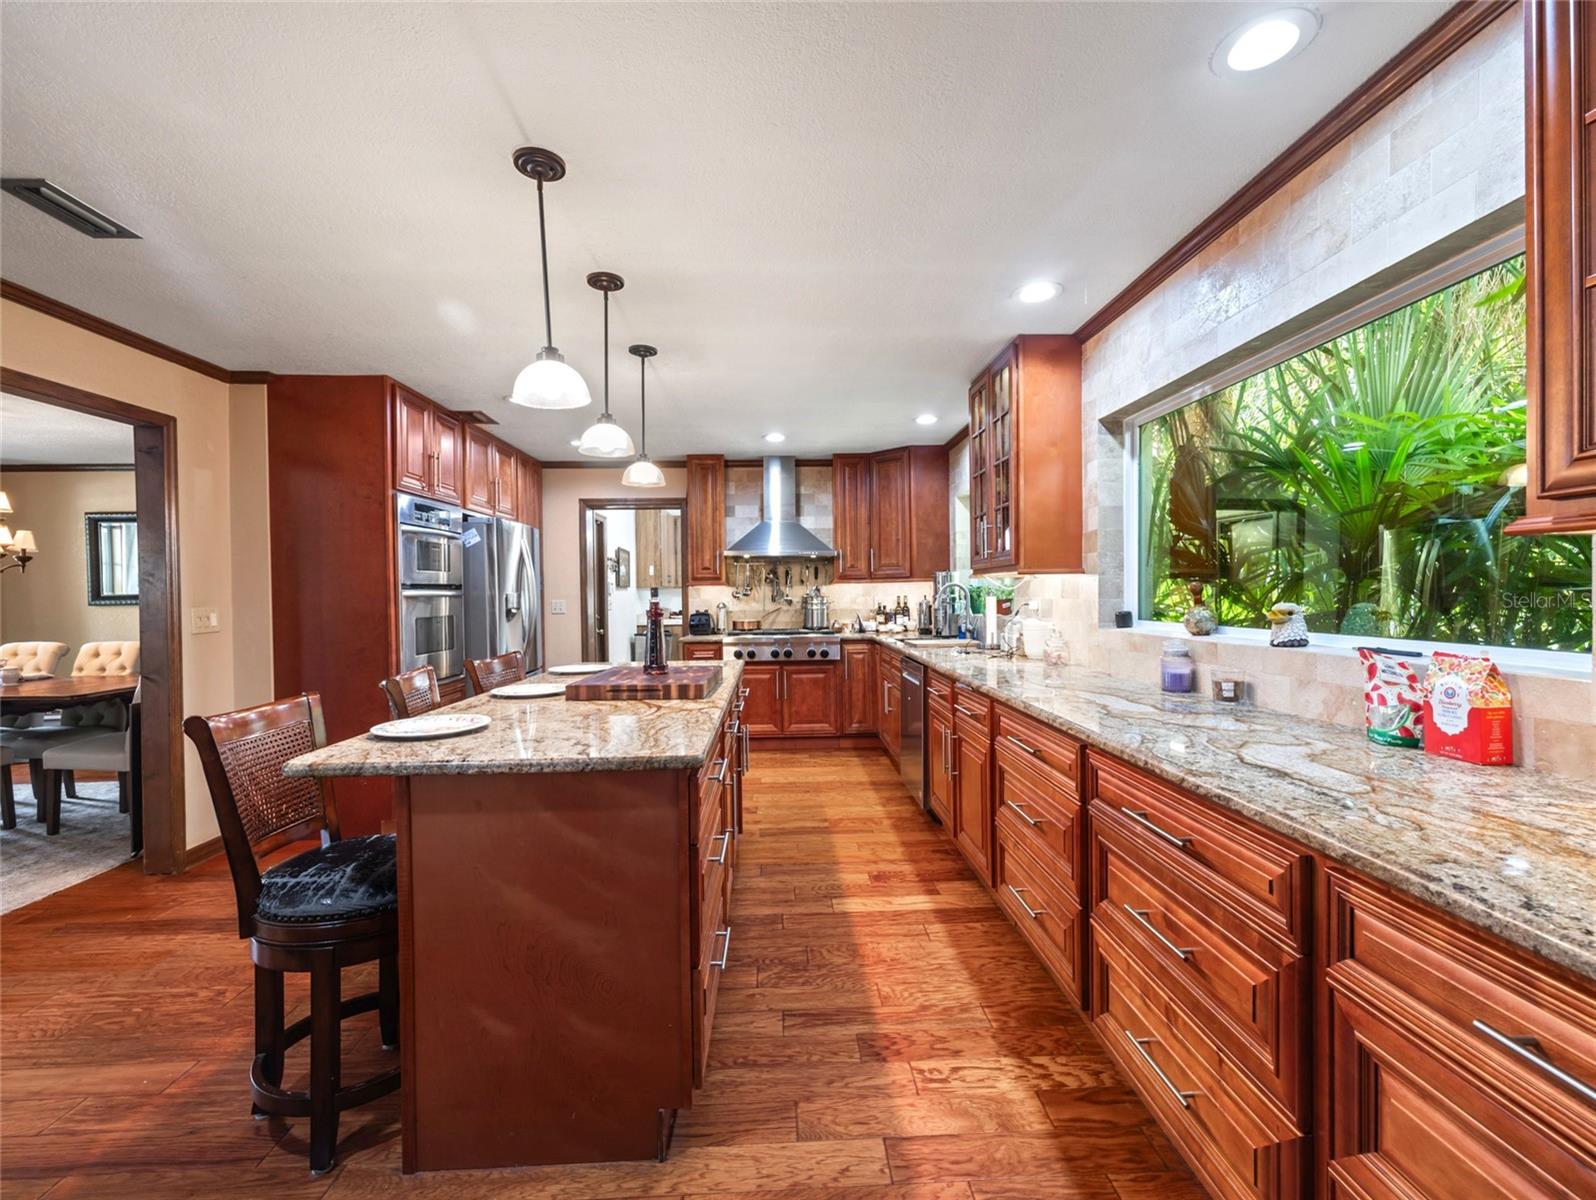
Lakefront Oasis on the Clermont Chain – 2600 Sq Ft, 4 Bed, 2.5 Bath and NO Homeowners Association Tucked away at the end of a quiet cul-de-sac on the sought-after northwest shore of Lake Minneola, this 2,600 square foot two-story home offers direct access to the stunning Clermont Chain of Lakes. With 4 bedrooms, 2.5 baths, and over 200 feet of canal frontage, this property is a rare find for those seeking a combination of waterfront living and privacy. Step inside to a spacious layout designed for both comfort and entertaining. The first floor features rich wood flooring throughout and includes a living room and family room joined by a charming double-sided fireplace. The oversized 19' x 11' kitchen with a large center island offers ample space for hosting, while the 12' x 11' dining room sets the stage for memorable meals. A generous laundry room and convenient half bath complete the main level. Upstairs, you'll find four well-sized bedrooms and three full bathrooms, providing space and privacy for the whole family or guests. Step outside to your own tropical retreat. The covered lanai opens to a sparkling pool with a custom rock waterfall, surrounded by lush landscaping including bamboo, avocado, starfruit, and more—creating a true South Pacific vibe. A shaded path winds along the canal to a private gazebo where all you see is water and woods—no neighbors in sight. Set on a beautifully landscaped 1/3-acre lot with over 200 feet of waterfront, this canal-front home is just 100 feet from the open waters of Lake Minneola—boating, fishing, and lake life await. Clermont's Waterfront Park is practically your neighbor. It's got a public boat ramp, a sandy beach, a Splash Park, a Pavilion, a Bandstand, a Fishing Pier and the Clermont Rowing Club. Clermont Waterfront Park is home for numerous events throughout the year: various Triathlons , a number of Festivals and holiday celebrations. The South Lake Trail which is part of a 100 mile network, ideal for hiking, cycling and jogging, runs right through the park. The Vibrant and Historic downtown Clermont is several blocks away from the waterfront. Downtown Clermont offers shops, eateries, breweries, antiques, gift shops, novelties and private academies/schools. Just up the hill from the park is the famous 19 story Citrus Tower. Other nearby points of interest include: South Lake Hospital, The Florida Sports Injury Institute, The National Training Center, Lake Sumter State College and the Lakeridge Winery. From Tower View Drive it’s a short commute to U.S. Highway 27, State Road 50 and the Florida Turnpike. From those roads one can quickly get to the Orlando International Airport, multiple golf courses, Disney World, Universal Studios, Seaworld and other attractions. From Clermont it's about the same distance to either the Atlantic Coast or the Gulf Coast.
Build Your Team
Quickly find investor-friendly professionals who can help you succeed in real estate investing at any stage of the investing journey.


Agents
Match with investor-friendly agents who can help you find, analyze, and close your next deal


Lenders
Get the best funding…find investor-friendly lenders who specialize in your deal strategy


Property Managers
Transition to passive investing. Find a trusted property management partnership that lasts.


Tax Pros & Accountants
Taxes and financial reporting made easy—find experts to create tax savings strategies, file taxes, and more
Location
Property Details
Parking
- Description: Garage
- Details: Attached
- Garage Spaces: 2
- Spaces Total: 0
Bedroom Information
- # of Bedrooms: 4
Bathroom Information
- # of Baths (Full): 2
- # of Baths (Partial): 1
- # of Baths (Total): 3.0
Interior Features
- # of Rooms: 8
- # of Stories: 2
- Fireplace: Yes
Exterior Features
- Exterior Walls Materials: Brick Veneer
- Foundation: Slab
- Roof Material: Metal
- Pool: Yes
Land Information
- Land Use: Residential
- Land Use Subtype: Single Family Residential
Lot Information
- Parcel ID: 142225010000B01300
- Lot Size: 16464 sqft
Property Information
- Property Type: Single Family Residence
- Year Built: 1984
Tax Information
- Annual Tax: $3,349
Utilities
- Water & Sewer: Private
- Heating: Central, Electric
- Cooling: Central Air
Location
- County: Lake
Listing Details
Investment Summary
- Monthly Cash Flow
- -$3,626
- Cap Rate
- 2.8%
- Cash-on-Cash Return
- -15.1%
- Debt Coverage Ratio
- 0.44
- Internal Rate of Return (5 years)
- -10.7%
Cash Flow
Net Operating Income (NOI) minus mortgage payments.
Calculation:
NOI - Mortgage Payments
Cap Rate (Market Value)
Capitalization Rate is a rate of return that compares the yearly Net Operating Income (NOI) to the market value.
Calculation:
NOI / Market Value
Cash-on-Cash Return (CoC)
Annual Cash Flow / Cash Invested
Calculation:
Annual cash flow divided by initial cash invested.
Debt Coverage Ratio (DCR)
Net Operating Income (NOI) divided by total debt payments.
Calculation:
NOI / Total Debt Payments
Internal Rate of Return (IRR)
A metric for assessing profitability over time. IRR is the discount rate at which the net present value (NPV) of all future cash flows (positive and negative) from an investment equals zero — including both periodic cash flow (such as rent) and a projected sale at the end of the holding period. It represents the expected annualized return, accounting for income, expenses, and the recovery of capital through a future sale.
Purchase Details
Purchase PriceThe price paid for the property. Purchase price:
| $1,249,000 |
|---|---|
Amount FinancedThe amount of the purchase financed through a loan. Amount financed:
| -$999,200 |
Down paymentThe initial payment made towards the purchase. Down payment:
| $249,800 |
Closing CostsFees and expenses associated with purchasing a property, typically ranging from 2% to 5% of the home’s purchase price, paid at the end of a home purchase to cover services like lending, title transfer, and taxes. Closing costs:
| $37,470 |
Rehab CostsCosts incurred to repair or improve the property, including: roof, flooring, exterior siding, kitchen, exterior paint, bathrooms, etc. Rehab costs:
| $0 |
Initial Cash InvestedThe total initial cash invested in the property. Calculation:Down payment + Buying costs + Rehab costs Initial cash invested:
| $287,270 |
Square Feet (SQFT)The total square footage of the property. Square feet:
| 2,612 |
Cost Per Square FootCost per square foot of the property. Calculation:Purchase Price / Square Feet Cost per square foot:
| $478 |
Monthly Rent Per Square FootMonthly rent divided by the number of square feet. This ratio helps investors compare rental income efficiency across properties, markets, and unit sizes Calculation:Monthly Rent / Square Feet Monthly rent per square foot:
| $1.76 |
Financing Details
Loan AmountThe total sum of money borrowed from a lender to finance a property purchase. Calculation:Purchase Price - Down Payment
Loan amount:
| $999,200 |
|---|---|
Loan to Value Ratio (LTV)Loan amount divided by the market value of the property. Calculation:Loan Amount / Market Value
Loan to value ratio:
| 80.0% |
Loan TypeThe type of loan (e.g., fixed, adjustable).
Loan type:
| Amortizing |
TermThe loan repayment period in years.
Term:
| 30 years |
Interest RateThe percentage a lender charges on the borrowed amount of a loan, determining the cost of borrowing money.
Interest rate:
| 6.810% |
Principal & Interest (PI)The principal is the portion of the loan payment that reduces the loan balance. The interest is the lender's charge for borrowing money. Calculation:(P * r * (1 + r) ** n) / ((1 + r) ** n - 1) Where:
P = Loan amount (principal)
Principal & interest:
| $6,521 |
Property TaxesAnnual taxes levied by local governments on real estate properties. These taxes fund public services like schools, roads, and emergency services.
Property tax:
| $279 |
InsuranceThe costs for insurance coverage to protect against financial losses due to risks like fire, natural disasters, theft, liability, or tenant-related damages. Calculation:Assumes 7% of gross rental income, unless insurance rates are specified.
Insurance:
| $322 |
Private Mortgage Insurance (PMI)A fee that borrowers pay when they take out a conventional loan with a loan-to-value (LTV) ratio above 80%.
Private mortgage insurance (PMI):
| $0 |
Monthly PaymentThe fixed amount a borrower pays each month to repay a loan. It typically includes principal and interest (P&I) and may also cover property taxes, insurance, HOA fees, and PMI if escrowed. Monthly payment:
| $7,122 |
Operating Income
| % Rent | Monthly | Yearly | |
|---|---|---|---|
Gross RentThe total rental income received from tenants before deducting any expenses. Includes base rent, late fees, pet fees, parking fees, and other recurring charges.
Gross rent:
| $4,600 | $55,200 | |
Vacancy LossExpected loss of rent due to vacancies.
Vacancy loss:
(6%)
| 6% | -$276 | -$3,312 |
Operating IncomeGross rental income minus vacancy loss. Calculation:Gross rent - Vacancy loss
Operating income:
| $4,324 | $51,888 |
Operating Expenses
| % Rent | Monthly | Yearly | |
|---|---|---|---|
Property TaxesAnnual taxes levied by local governments on real estate properties. These taxes fund public services like schools, roads, and emergency services. | 6% | -$279 | -$3,349 |
InsuranceThe costs for insurance coverage to protect against financial losses due to risks like fire, natural disasters, theft, liability, or tenant-related damages. Calculation:Assumes 7% of gross rental income, unless insurance rates are specified. | 7% | -$322 | -$3,864 |
Property ManagementThe costs associated with hiring a property manager to handle the day-to-day operations of a rental property. Includes management fees, leasing fes, eviction fees, etc. Calculation:Assumes 8% of gross rental income. | 8% | -$368 | -$4,416 |
Repairs & MaintenanceOngoing costs for routine upkeep and minor fixes needed to keep a property in good working condition. Calculation:Assumes 5% of gross rental income. Varies by property age and condition. | 5% | -$230 | -$2,760 |
Capital ExpensesLarge, infrequent costs for major improvements or replacements, like a new roof, HVAC system, or appliances. Calculation:Assumes 5% of gross rental income. Varies by property age. | 5% | -$230 | -$2,760 |
HOA FeesRegular dues paid to a Homeowners Association for community maintenance, amenities, and management. Similar fees include: Condo Association Fees, Co-op Maintenance Fees, etc. | n/a | n/a | n/a |
Operating ExpensesRecurring costs required to maintain and manage a rental property, including property taxes, insurance, maintenance, repairs, utilities (if paid by the owner), property management fees, and other day-to-day expenses. Calculation:Insurance + Property Taxes + Property Management + Repairs & Maintenance + Capital Expenditures + HOA Fees | 31% | -$1,429 | -$17,149 |
Cash Flow
| Monthly | Yearly | |
|---|---|---|
Net Operating Income (NOI)The income generated from a property after deducting all operating expenses but before deducting mortgage payments, taxes, and capital expenditures. Calculation:Gross Operating Income - Operating Expenses
Net operating income:
| $2,895 | $34,740 |
Mortgage PaymentThe fixed amount a borrower pays each month to repay a loan. It typically includes principal and interest (P&I) and may also cover property taxes, insurance, HOA fees, and PMI if escrowed. | -$6,521 | -$78,252 |
Cash FlowNet Operating Income (NOI) minus mortgage payments. Calculation:NOI - Mortgage Payments | $3,626 | $43,512 |