
$459,900
Investment Summary
- Monthly Cash Flow
- -$1,694
- Cap Rate
- 1.7%
- Cash-on-Cash Return
- -19.2%
- Debt Coverage Ratio
- 0.28
- Internal Rate of Return (5 years)
- -14.6%
Cash Flow
Net Operating Income (NOI) minus mortgage payments.
Calculation:
NOI - Mortgage Payments
Cap Rate (Market Value)
Capitalization Rate is a rate of return that compares the yearly Net Operating Income (NOI) to the market value.
Calculation:
NOI / Market Value
Cash-on-Cash Return (CoC)
Annual Cash Flow / Cash Invested
Calculation:
Annual cash flow divided by initial cash invested.
Debt Coverage Ratio (DCR)
Net Operating Income (NOI) divided by total debt payments.
Calculation:
NOI / Total Debt Payments
Internal Rate of Return (IRR)
A metric for assessing profitability over time. IRR is the discount rate at which the net present value (NPV) of all future cash flows (positive and negative) from an investment equals zero — including both periodic cash flow (such as rent) and a projected sale at the end of the holding period. It represents the expected annualized return, accounting for income, expenses, and the recovery of capital through a future sale.
Property Description
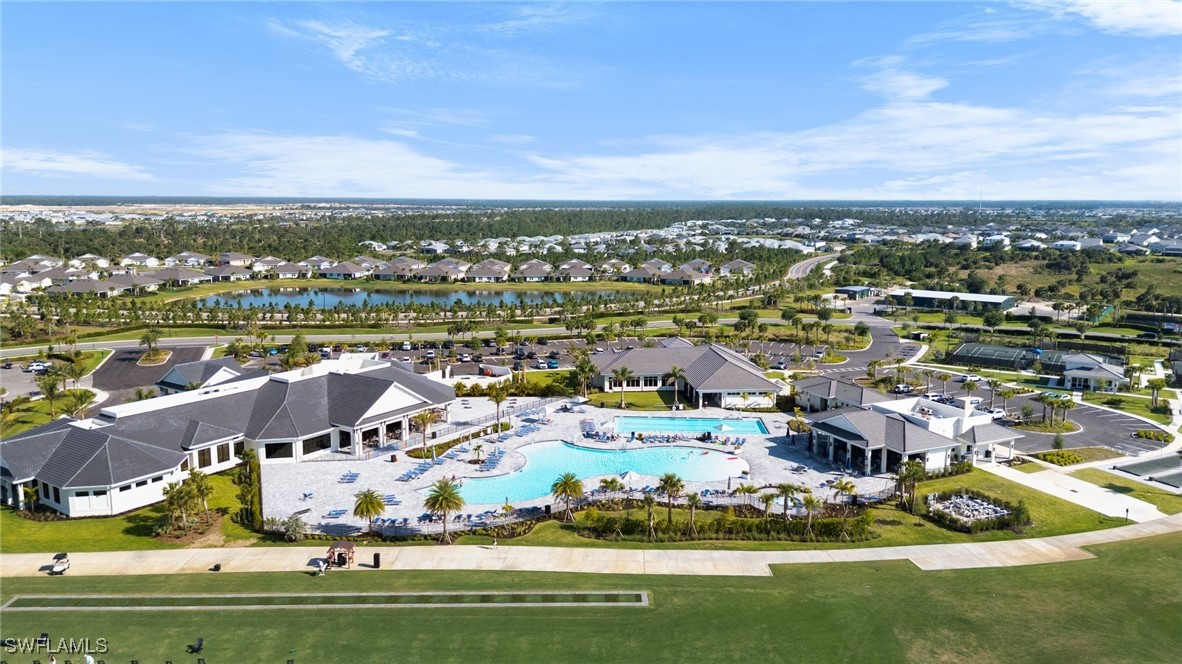
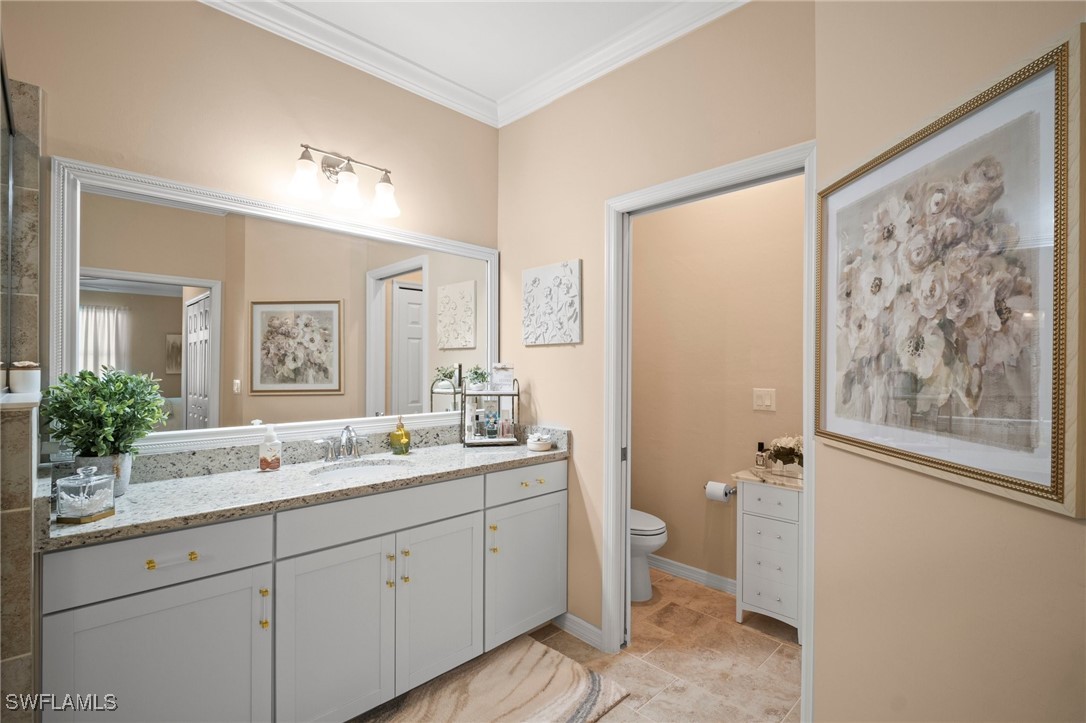
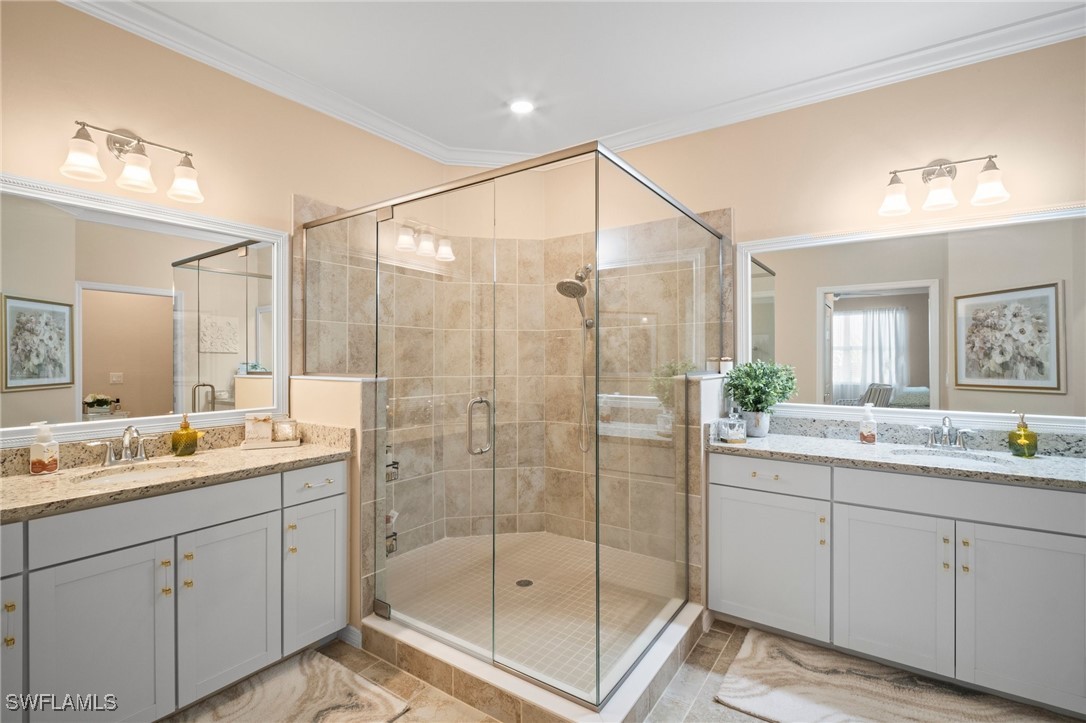
Practically perfect in every way! You'll know this is "the one" from the moment you walk through the front door. It's a feeling, a lifestyle and it's waiting for you! Step into this highly sought after Penthouse Coach home overlooking the 5th hole of Babcock National Golf & Country Club. This home offers a deeded golf membership and access to first-class resort amenities. Babcock National is officially completed, making it a construction free, guard gated neighborhood. With thoughtful upgrades in every room, custom craftsmanship, meticulous maintenance and as some of the largest bedrooms out of any home in the neighborhood, the Baycreek model is perfection. Admire the custom feature walls and rectangular tile flooring throughout the entire home. That’s right, No carpet in the bedrooms! The crown molding, fresh professional paint throughout, designer lighting and an stunning accent wall polish off the open living concept floor plan. The kitchen features custom cabinet hardware, a beautiful backsplash with tile work that continues under the extra-large island for a seamless, upscale look. Premium appliances have been selected for a kitchen meant to entertain friends & family. The double oven with built-in air fryer, extra-large-capacity dishwasher, single cast-iron sink, touchless kitchen faucet and easy access disposal button built into the granite island top, make this the heart of the home. A built-in double trash / recycling drawer and walk-in pantry add to the kitchen's effortless functionality. The great room stuns with a custom coffered ceiling and views of the golf course and sparkling lake. The primary suite is equally impressive, featuring a custom feature wall and ensuite bath with dual vanities, framed mirrors, and a walk-in shower fit for a king. Guests enjoy true privacy in their own wing of the home, separated by a pocket door from the main living space. The guest bath mirrors the home’s upscale finishes with a framed mirror and glass shower / tub enclosure. Soak in panoramic views from your expansive, extra-large lanai complete with tile flooring, dual ceiling fans and a custom tongue-and-groove ceiling. Additional features include an insulated garage door and an extra-large tandem garage. Plenty of room for 2 vehicles and a golf cart! Babcock National amenities include a resort-style pool, lap lane pool and hot tub along with 3 additional satellite pools & outdoor grill areas. The poolside tiki bar, 24-hour fitness center, men’s & women’s steam saunas, tennis & pickleball courts, full-service day spa, and brand-new clubhouse featuring a cocktail bar and fine dining—are all here waiting for you. Whether you're seeking a peaceful retreat, an active lifestyle, or a golf-lover’s dream, this one in a million-coach home is truly your key to it all! Select pieces of furniture convey~ Sofa, Recliner, Chair & ottoman, 2 Full Beds, Nightstand & Dresser in the guest room on the right, along with the Lanai Sectional Sofa come with the home!
Build Your Team
Quickly find investor-friendly professionals who can help you succeed in real estate investing at any stage of the investing journey.


Agents
Match with investor-friendly agents who can help you find, analyze, and close your next deal


Lenders
Get the best funding…find investor-friendly lenders who specialize in your deal strategy


Property Managers
Transition to passive investing. Find a trusted property management partnership that lasts.


Tax Pros & Accountants
Taxes and financial reporting made easy—find experts to create tax savings strategies, file taxes, and more
Location
Property Details
Parking
- Details: Attached, Driveway, Garage, Paved, Electric Vehicle Charging Station(s), Garage Door Opener
- Garage Spaces: 2
- Spaces Total: 0
Bedroom Information
- # of Bedrooms: 3
Bathroom Information
- # of Baths (Full): 2
- # of Baths (Total): 2.0
Interior Features
- # of Stories: 1
Exterior Features
- Roof Material: Tile
HOA
- Has HOA: Yes
- HOA Fee: $423/quarterly
- Additional HOA Fee: $883/quarterly
Land Information
- Land Use: Residential
- Land Use Subtype: Condominium Unit
Lot Information
- Parcel ID: 422629500046
- Lot Size: 0 sqft
Property Information
- Property Type: Condominium
- Style: Coach Carriage, Low Rise
- Year Built: 2022
Tax Information
- Annual Tax: $7,522
Utilities
- Water & Sewer: Public
- Heating: Central, Electric
- Cooling: Central Air, Ceiling Fan(s), Electric
Location
- County: Charlotte
Listing Details
Investment Summary
- Monthly Cash Flow
- -$1,694
- Cap Rate
- 1.7%
- Cash-on-Cash Return
- -19.2%
- Debt Coverage Ratio
- 0.28
- Internal Rate of Return (5 years)
- -14.6%
Cash Flow
Net Operating Income (NOI) minus mortgage payments.
Calculation:
NOI - Mortgage Payments
Cap Rate (Market Value)
Capitalization Rate is a rate of return that compares the yearly Net Operating Income (NOI) to the market value.
Calculation:
NOI / Market Value
Cash-on-Cash Return (CoC)
Annual Cash Flow / Cash Invested
Calculation:
Annual cash flow divided by initial cash invested.
Debt Coverage Ratio (DCR)
Net Operating Income (NOI) divided by total debt payments.
Calculation:
NOI / Total Debt Payments
Internal Rate of Return (IRR)
A metric for assessing profitability over time. IRR is the discount rate at which the net present value (NPV) of all future cash flows (positive and negative) from an investment equals zero — including both periodic cash flow (such as rent) and a projected sale at the end of the holding period. It represents the expected annualized return, accounting for income, expenses, and the recovery of capital through a future sale.
Purchase Details
Purchase PriceThe price paid for the property. Purchase price:
| $459,900 |
|---|---|
Amount FinancedThe amount of the purchase financed through a loan. Amount financed:
| -$367,920 |
Down paymentThe initial payment made towards the purchase. Down payment:
| $91,980 |
Closing CostsFees and expenses associated with purchasing a property, typically ranging from 2% to 5% of the home’s purchase price, paid at the end of a home purchase to cover services like lending, title transfer, and taxes. Closing costs:
| $13,797 |
Rehab CostsCosts incurred to repair or improve the property, including: roof, flooring, exterior siding, kitchen, exterior paint, bathrooms, etc. Rehab costs:
| $0 |
Initial Cash InvestedThe total initial cash invested in the property. Calculation:Down payment + Buying costs + Rehab costs Initial cash invested:
| $105,777 |
Square Feet (SQFT)The total square footage of the property. Square feet:
| 2,222 |
Cost Per Square FootCost per square foot of the property. Calculation:Purchase Price / Square Feet Cost per square foot:
| $207 |
Monthly Rent Per Square FootMonthly rent divided by the number of square feet. This ratio helps investors compare rental income efficiency across properties, markets, and unit sizes Calculation:Monthly Rent / Square Feet Monthly rent per square foot:
| $1.13 |
Financing Details
Loan AmountThe total sum of money borrowed from a lender to finance a property purchase. Calculation:Purchase Price - Down Payment
Loan amount:
| $367,920 |
|---|---|
Loan to Value Ratio (LTV)Loan amount divided by the market value of the property. Calculation:Loan Amount / Market Value
Loan to value ratio:
| 80.0% |
Loan TypeThe type of loan (e.g., fixed, adjustable).
Loan type:
| Amortizing |
TermThe loan repayment period in years.
Term:
| 30 years |
Interest RateThe percentage a lender charges on the borrowed amount of a loan, determining the cost of borrowing money.
Interest rate:
| 6.625% |
Principal & Interest (PI)The principal is the portion of the loan payment that reduces the loan balance. The interest is the lender's charge for borrowing money. Calculation:(P * r * (1 + r) ** n) / ((1 + r) ** n - 1) Where:
P = Loan amount (principal)
Principal & interest:
| $2,356 |
Property TaxesAnnual taxes levied by local governments on real estate properties. These taxes fund public services like schools, roads, and emergency services.
Property tax:
| $627 |
InsuranceThe costs for insurance coverage to protect against financial losses due to risks like fire, natural disasters, theft, liability, or tenant-related damages. Calculation:Assumes 7% of gross rental income, unless insurance rates are specified.
Insurance:
| $175 |
Private Mortgage Insurance (PMI)A fee that borrowers pay when they take out a conventional loan with a loan-to-value (LTV) ratio above 80%.
Private mortgage insurance (PMI):
| $0 |
Monthly PaymentThe fixed amount a borrower pays each month to repay a loan. It typically includes principal and interest (P&I) and may also cover property taxes, insurance, HOA fees, and PMI if escrowed. Monthly payment:
| $3,158 |
Operating Income
| % Rent | Monthly | Yearly | |
|---|---|---|---|
Gross RentThe total rental income received from tenants before deducting any expenses. Includes base rent, late fees, pet fees, parking fees, and other recurring charges.
Gross rent:
| $2,500 | $30,000 | |
Vacancy LossExpected loss of rent due to vacancies.
Vacancy loss:
(6%)
| 6% | -$150 | -$1,800 |
Operating IncomeGross rental income minus vacancy loss. Calculation:Gross rent - Vacancy loss
Operating income:
| $2,350 | $28,200 |
Operating Expenses
| % Rent | Monthly | Yearly | |
|---|---|---|---|
Property TaxesAnnual taxes levied by local governments on real estate properties. These taxes fund public services like schools, roads, and emergency services. | 25% | -$627 | -$7,522 |
InsuranceThe costs for insurance coverage to protect against financial losses due to risks like fire, natural disasters, theft, liability, or tenant-related damages. Calculation:Assumes 7% of gross rental income, unless insurance rates are specified. | 7% | -$175 | -$2,100 |
Property ManagementThe costs associated with hiring a property manager to handle the day-to-day operations of a rental property. Includes management fees, leasing fes, eviction fees, etc. Calculation:Assumes 8% of gross rental income. | 8% | -$200 | -$2,400 |
Repairs & MaintenanceOngoing costs for routine upkeep and minor fixes needed to keep a property in good working condition. Calculation:Assumes 5% of gross rental income. Varies by property age and condition. | 5% | -$125 | -$1,500 |
Capital ExpensesLarge, infrequent costs for major improvements or replacements, like a new roof, HVAC system, or appliances. Calculation:Assumes 5% of gross rental income. Varies by property age. | 5% | -$125 | -$1,500 |
HOA FeesRegular dues paid to a Homeowners Association for community maintenance, amenities, and management. Similar fees include: Condo Association Fees, Co-op Maintenance Fees, etc. | 17% | -$436 | -$5,232 |
Operating ExpensesRecurring costs required to maintain and manage a rental property, including property taxes, insurance, maintenance, repairs, utilities (if paid by the owner), property management fees, and other day-to-day expenses. Calculation:Insurance + Property Taxes + Property Management + Repairs & Maintenance + Capital Expenditures + HOA Fees | 68% | -$1,688 | -$20,254 |
Cash Flow
| Monthly | Yearly | |
|---|---|---|
Net Operating Income (NOI)The income generated from a property after deducting all operating expenses but before deducting mortgage payments, taxes, and capital expenditures. Calculation:Gross Operating Income - Operating Expenses
Net operating income:
| $662 | $7,944 |
Mortgage PaymentThe fixed amount a borrower pays each month to repay a loan. It typically includes principal and interest (P&I) and may also cover property taxes, insurance, HOA fees, and PMI if escrowed. | -$2,356 | -$28,272 |
Cash FlowNet Operating Income (NOI) minus mortgage payments. Calculation:NOI - Mortgage Payments | $1,694 | $20,328 |