
$142,000
Investment Summary
We noticed that property taxes are missing—this is a standard expense and should be considered in your estimate.
- Monthly Cash Flow
- $432
- Cap Rate
- 9.3%
- Cash-on-Cash Return
- 15.9%
- Debt Coverage Ratio
- 1.64
- Internal Rate of Return (5 years)
- 19.5%
Cash Flow
Net Operating Income (NOI) minus mortgage payments.
Calculation:
NOI - Mortgage Payments
Cap Rate (Market Value)
Capitalization Rate is a rate of return that compares the yearly Net Operating Income (NOI) to the market value.
Calculation:
NOI / Market Value
Cash-on-Cash Return (CoC)
Annual Cash Flow / Cash Invested
Calculation:
Annual cash flow divided by initial cash invested.
Debt Coverage Ratio (DCR)
Net Operating Income (NOI) divided by total debt payments.
Calculation:
NOI / Total Debt Payments
Internal Rate of Return (IRR)
A metric for assessing profitability over time. IRR is the discount rate at which the net present value (NPV) of all future cash flows (positive and negative) from an investment equals zero — including both periodic cash flow (such as rent) and a projected sale at the end of the holding period. It represents the expected annualized return, accounting for income, expenses, and the recovery of capital through a future sale.
Property Description
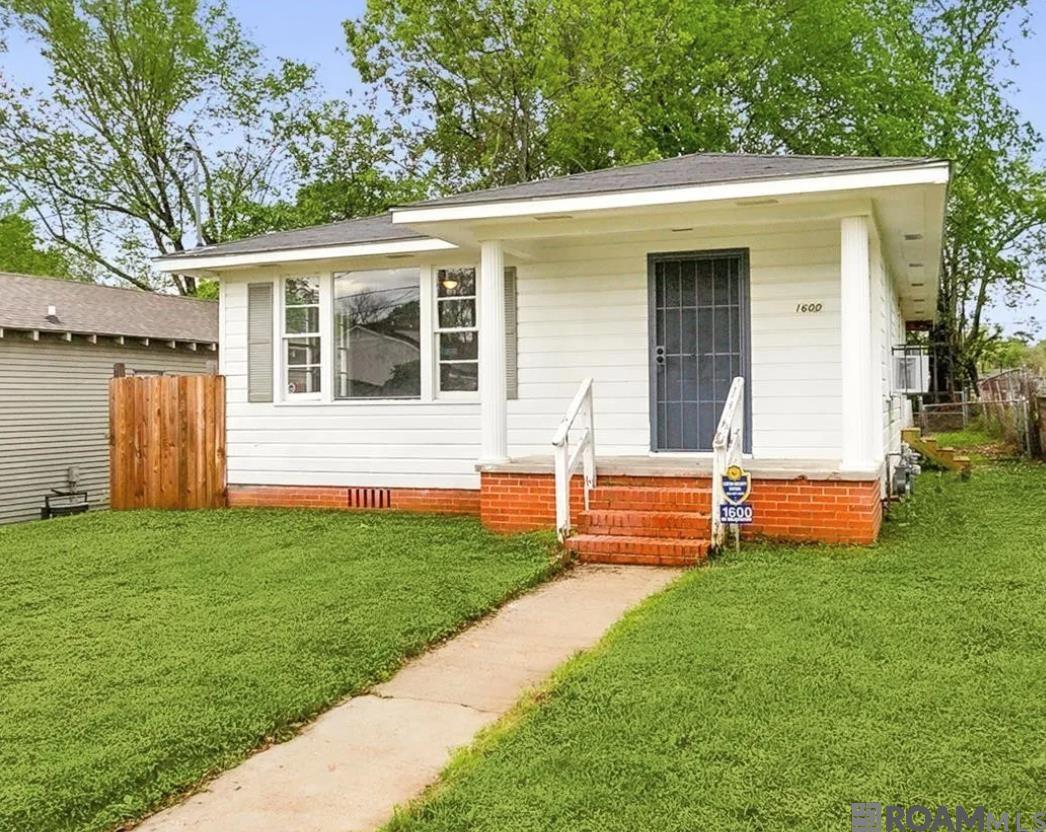
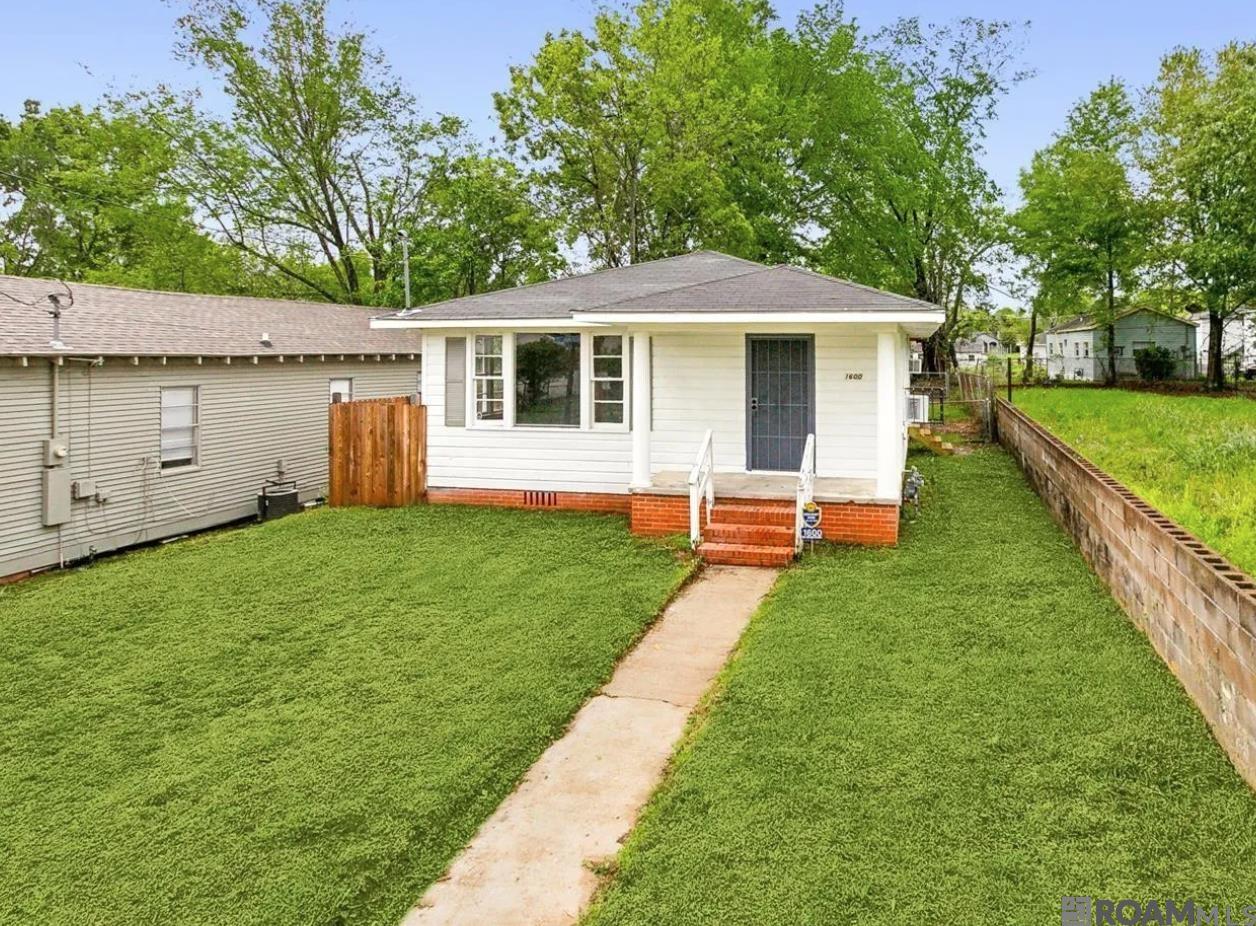
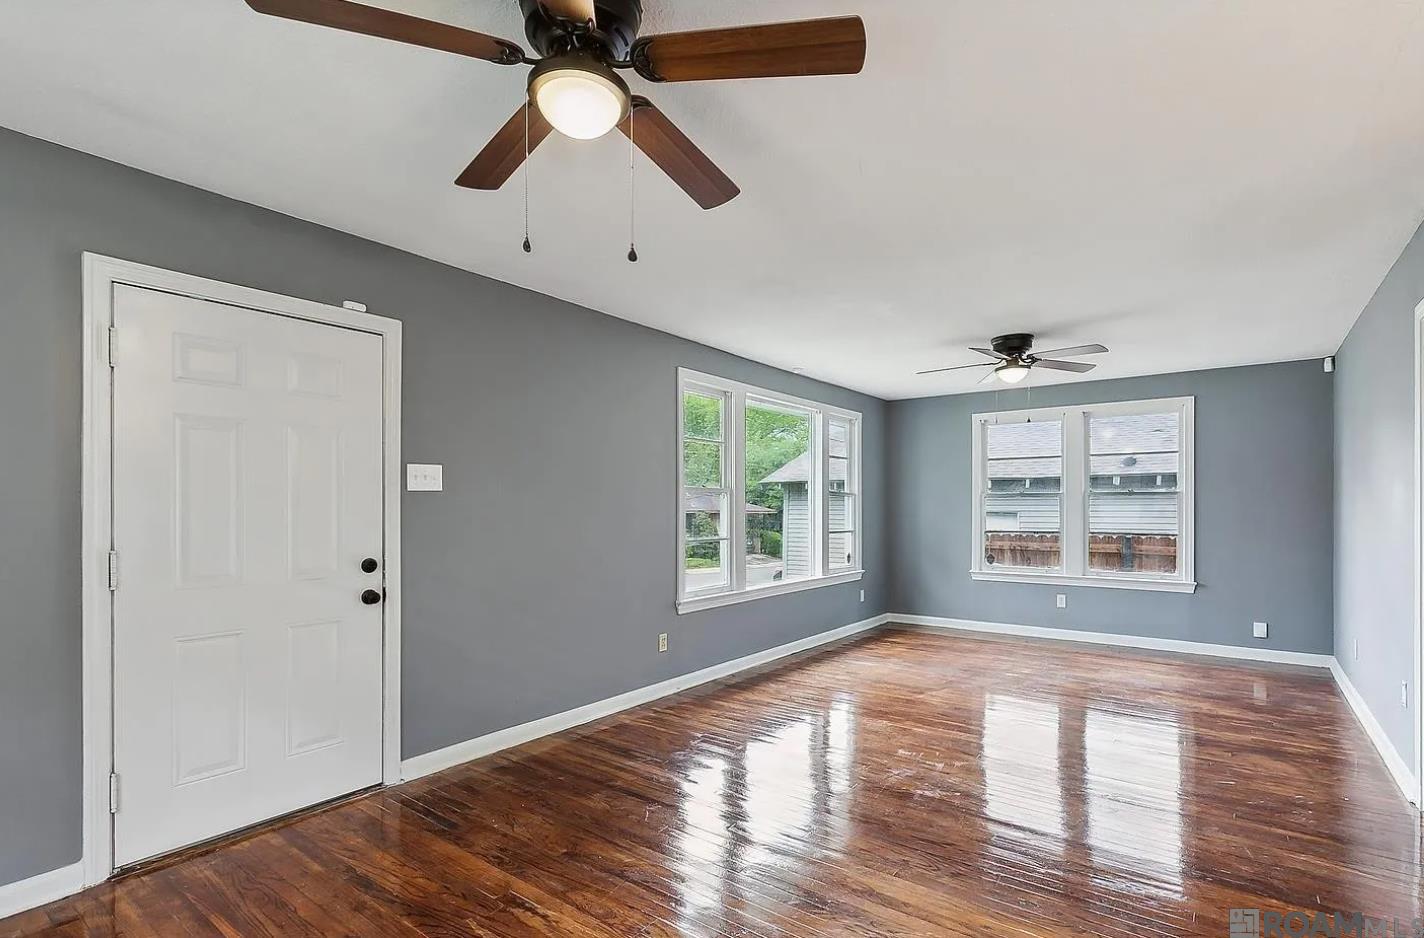
OWNER FINANCING! Charming Cottage Near the Garden District: Your Dream Home Awaits! Welcome to 1600 Myrtle Walk Avenue, a beautifully renovated 3-bedroom, 1-bath cottage nestled in the heart of Baton Rouge's coveted Garden District. This home offers an unbeatable combination of classic charm and modern convenience, perfect for those seeking a cozy retreat close to everything the city has to offer. Prime Location: Situated near LSU and City Park, this home provides easy access to Baton Rouge’s best amenities. Whether you're a student, a professional, or a family, you'll appreciate the proximity to vibrant dining, shopping, and recreational options. Step inside to discover a harmonious blend of old-world charm and contemporary upgrades. The living spaces are bright and inviting, featuring original hardwood floors that exude warmth and character. The kitchen boasts new gas stainless steel appliances, ensuring your culinary adventures are a pleasure. A tankless water heater provides endless hot water, and the included washer and dryer add convenience to your daily routine. Rest easy knowing your home is equipped with a custom security system, providing peace of mind for you and your loved ones. The fenced-in backyard is perfect for pets, children, or hosting gatherings. Enjoy leisurely mornings and evenings on the covered porch, a serene spot to unwind. The seller is motivated and ready to help make your homeownership dreams come true. They are offering up to $2,500 towards your closing costs and pre-paids, reducing your out-of-pocket expenses. Additionally, you’ll receive a $3,500 budget for brand-new ceiling fans and window units, allowing you to customize the home to your liking.This home is not just a place to live, but a lifestyle. Imagine waking up each day in a beautiful, character-filled home, enjoying coffee on your covered porch, and exploring the vibrant neighborhood. 1600 Myrtle Walk Avenue is more than just an address; it’s a place where memories are made.
Build Your Team
Quickly find investor-friendly professionals who can help you succeed in real estate investing at any stage of the investing journey.


Agents
Match with investor-friendly agents who can help you find, analyze, and close your next deal


Lenders
Get the best funding…find investor-friendly lenders who specialize in your deal strategy


Property Managers
Transition to passive investing. Find a trusted property management partnership that lasts.


Tax Pros & Accountants
Taxes and financial reporting made easy—find experts to create tax savings strategies, file taxes, and more
Location
Property Details
Parking
- Description: 4+ Cars Park
- Garage Spaces: 0
- Spaces Total: 4
Bedroom Information
- # of Bedrooms: 3
Bathroom Information
- # of Baths (Full): 1
- # of Baths (Total): 1.0
Interior Features
- # of Stories: 1
Exterior Features
- Roof Material: Shingle
Land Information
- Land Use: Residential
- Land Use Subtype: Single Family Residential
Lot Information
- Parcel ID: 98450
- Lot Size: 5227 sqft
Property Information
- Property Type: Single Family Residence
- Style: Traditional
- Year Built: 1980
Tax Information
- Annual Tax: $0
Utilities
- Water & Sewer: Public
- Cooling: Ceiling Fan(s)
Location
- County: East Baton Rouge Parish
Listing Details
Investment Summary
We noticed that property taxes are missing—this is a standard expense and should be considered in your estimate.
- Monthly Cash Flow
- $432
- Cap Rate
- 9.3%
- Cash-on-Cash Return
- 15.9%
- Debt Coverage Ratio
- 1.64
- Internal Rate of Return (5 years)
- 19.5%
Cash Flow
Net Operating Income (NOI) minus mortgage payments.
Calculation:
NOI - Mortgage Payments
Cap Rate (Market Value)
Capitalization Rate is a rate of return that compares the yearly Net Operating Income (NOI) to the market value.
Calculation:
NOI / Market Value
Cash-on-Cash Return (CoC)
Annual Cash Flow / Cash Invested
Calculation:
Annual cash flow divided by initial cash invested.
Debt Coverage Ratio (DCR)
Net Operating Income (NOI) divided by total debt payments.
Calculation:
NOI / Total Debt Payments
Internal Rate of Return (IRR)
A metric for assessing profitability over time. IRR is the discount rate at which the net present value (NPV) of all future cash flows (positive and negative) from an investment equals zero — including both periodic cash flow (such as rent) and a projected sale at the end of the holding period. It represents the expected annualized return, accounting for income, expenses, and the recovery of capital through a future sale.
Purchase Details
Purchase PriceThe price paid for the property. Purchase price:
| $142,000 |
|---|---|
Amount FinancedThe amount of the purchase financed through a loan. Amount financed:
| -$113,600 |
Down paymentThe initial payment made towards the purchase. Down payment:
| $28,400 |
Closing CostsFees and expenses associated with purchasing a property, typically ranging from 2% to 5% of the home’s purchase price, paid at the end of a home purchase to cover services like lending, title transfer, and taxes. Closing costs:
| $4,260 |
Rehab CostsCosts incurred to repair or improve the property, including: roof, flooring, exterior siding, kitchen, exterior paint, bathrooms, etc. Rehab costs:
| $0 |
Initial Cash InvestedThe total initial cash invested in the property. Calculation:Down payment + Buying costs + Rehab costs Initial cash invested:
| $32,660 |
Square Feet (SQFT)The total square footage of the property. Square feet:
| 1,250 |
Cost Per Square FootCost per square foot of the property. Calculation:Purchase Price / Square Feet Cost per square foot:
| $114 |
Monthly Rent Per Square FootMonthly rent divided by the number of square feet. This ratio helps investors compare rental income efficiency across properties, markets, and unit sizes Calculation:Monthly Rent / Square Feet Monthly rent per square foot:
| $1.28 |
Financing Details
Loan AmountThe total sum of money borrowed from a lender to finance a property purchase. Calculation:Purchase Price - Down Payment
Loan amount:
| $113,600 |
|---|---|
Loan to Value Ratio (LTV)Loan amount divided by the market value of the property. Calculation:Loan Amount / Market Value
Loan to value ratio:
| 80.0% |
Loan TypeThe type of loan (e.g., fixed, adjustable).
Loan type:
| Amortizing |
TermThe loan repayment period in years.
Term:
| 30 years |
Interest RateThe percentage a lender charges on the borrowed amount of a loan, determining the cost of borrowing money.
Interest rate:
| 5.875% |
Principal & Interest (PI)The principal is the portion of the loan payment that reduces the loan balance. The interest is the lender's charge for borrowing money. Calculation:(P * r * (1 + r) ** n) / ((1 + r) ** n - 1) Where:
P = Loan amount (principal)
Principal & interest:
| $672 |
Property TaxesAnnual taxes levied by local governments on real estate properties. These taxes fund public services like schools, roads, and emergency services.
Property tax:
| $0 |
InsuranceThe costs for insurance coverage to protect against financial losses due to risks like fire, natural disasters, theft, liability, or tenant-related damages. Calculation:Assumes 7% of gross rental income, unless insurance rates are specified.
Insurance:
| $112 |
Private Mortgage Insurance (PMI)A fee that borrowers pay when they take out a conventional loan with a loan-to-value (LTV) ratio above 80%.
Private mortgage insurance (PMI):
| $0 |
Monthly PaymentThe fixed amount a borrower pays each month to repay a loan. It typically includes principal and interest (P&I) and may also cover property taxes, insurance, HOA fees, and PMI if escrowed. Monthly payment:
| $784 |
Operating Income
| % Rent | Monthly | Yearly | |
|---|---|---|---|
Gross RentThe total rental income received from tenants before deducting any expenses. Includes base rent, late fees, pet fees, parking fees, and other recurring charges.
Gross rent:
| $1,600 | $19,200 | |
Vacancy LossExpected loss of rent due to vacancies.
Vacancy loss:
(6%)
| 6% | -$96 | -$1,152 |
Operating IncomeGross rental income minus vacancy loss. Calculation:Gross rent - Vacancy loss
Operating income:
| $1,504 | $18,048 |
Operating Expenses
| % Rent | Monthly | Yearly | |
|---|---|---|---|
Property TaxesAnnual taxes levied by local governments on real estate properties. These taxes fund public services like schools, roads, and emergency services.
We noticed that property taxes are missing—these are standard expenses and should be considered in your estimate. | n/a | n/a | n/a |
InsuranceThe costs for insurance coverage to protect against financial losses due to risks like fire, natural disasters, theft, liability, or tenant-related damages. Calculation:Assumes 7% of gross rental income, unless insurance rates are specified. | 7% | -$112 | -$1,344 |
Property ManagementThe costs associated with hiring a property manager to handle the day-to-day operations of a rental property. Includes management fees, leasing fes, eviction fees, etc. Calculation:Assumes 8% of gross rental income. | 8% | -$128 | -$1,536 |
Repairs & MaintenanceOngoing costs for routine upkeep and minor fixes needed to keep a property in good working condition. Calculation:Assumes 5% of gross rental income. Varies by property age and condition. | 5% | -$80 | -$960 |
Capital ExpensesLarge, infrequent costs for major improvements or replacements, like a new roof, HVAC system, or appliances. Calculation:Assumes 5% of gross rental income. Varies by property age. | 5% | -$80 | -$960 |
HOA FeesRegular dues paid to a Homeowners Association for community maintenance, amenities, and management. Similar fees include: Condo Association Fees, Co-op Maintenance Fees, etc. | n/a | n/a | n/a |
Operating ExpensesRecurring costs required to maintain and manage a rental property, including property taxes, insurance, maintenance, repairs, utilities (if paid by the owner), property management fees, and other day-to-day expenses. Calculation:Insurance + Property Taxes + Property Management + Repairs & Maintenance + Capital Expenditures + HOA Fees | 25% | -$400 | -$4,800 |
Cash Flow
| Monthly | Yearly | |
|---|---|---|
Net Operating Income (NOI)The income generated from a property after deducting all operating expenses but before deducting mortgage payments, taxes, and capital expenditures. Calculation:Gross Operating Income - Operating Expenses
Net operating income:
| $1,104 | $13,248 |
Mortgage PaymentThe fixed amount a borrower pays each month to repay a loan. It typically includes principal and interest (P&I) and may also cover property taxes, insurance, HOA fees, and PMI if escrowed. | -$672 | -$8,064 |
Cash FlowNet Operating Income (NOI) minus mortgage payments. Calculation:NOI - Mortgage Payments | $432 | $5,184 |