$1,980,000
Investment Summary
- Monthly Cash Flow
- -$10,882
- Cap Rate
- -0.5%
- Cash-on-Cash Return
- -28.7%
- Debt Coverage Ratio
- -0.09
- Internal Rate of Return (5 years)
- -23.6%
Cash Flow
Net Operating Income (NOI) minus mortgage payments.
Calculation:
NOI - Mortgage Payments
Cap Rate (Market Value)
Capitalization Rate is a rate of return that compares the yearly Net Operating Income (NOI) to the market value.
Calculation:
NOI / Market Value
Cash-on-Cash Return (CoC)
Annual Cash Flow / Cash Invested
Calculation:
Annual cash flow divided by initial cash invested.
Debt Coverage Ratio (DCR)
Net Operating Income (NOI) divided by total debt payments.
Calculation:
NOI / Total Debt Payments
Internal Rate of Return (IRR)
A metric for assessing profitability over time. IRR is the discount rate at which the net present value (NPV) of all future cash flows (positive and negative) from an investment equals zero — including both periodic cash flow (such as rent) and a projected sale at the end of the holding period. It represents the expected annualized return, accounting for income, expenses, and the recovery of capital through a future sale.
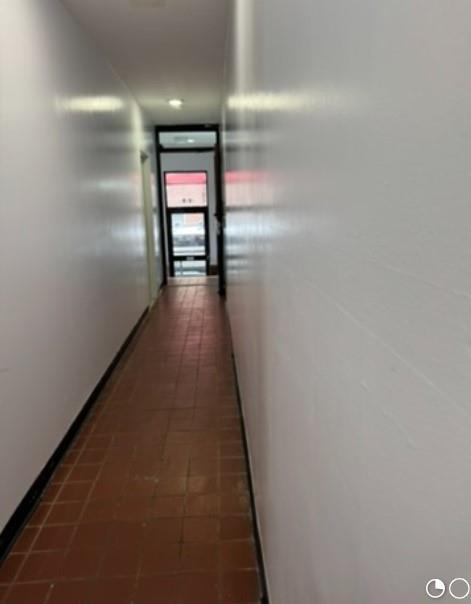
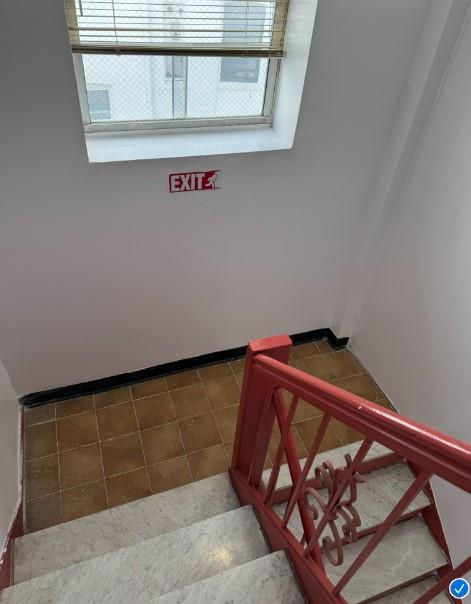
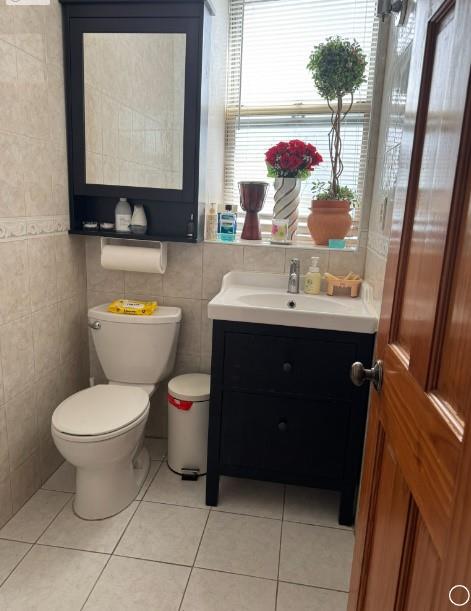
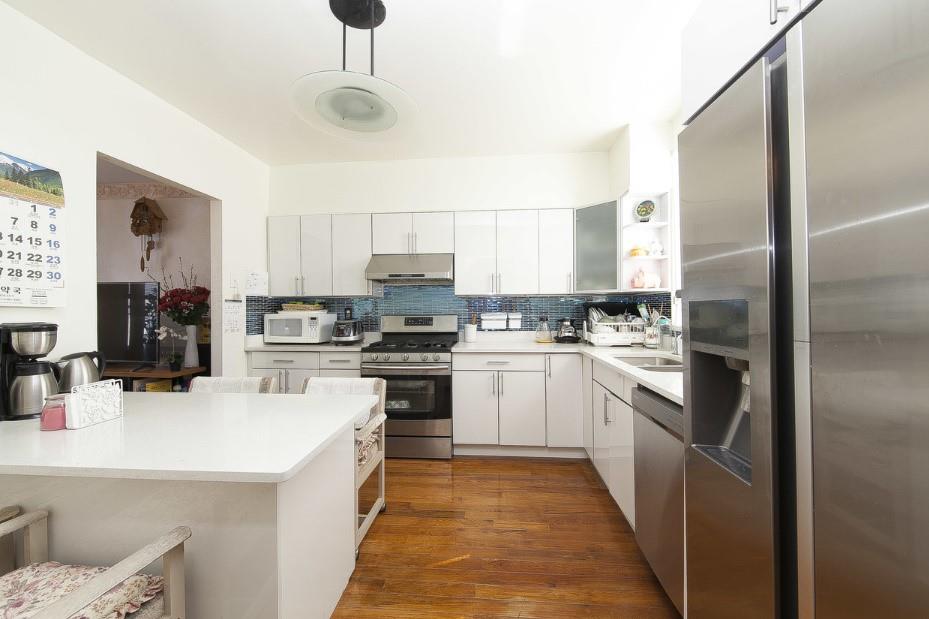
Property Description
Built in 1985 off King's highway within the Homecrest neighborhood of Brooklyn. Well maintained, sunny four family income producing duplex brick town house facing the eastern sunrise with a total of around 5,250 square feet. Each unit is around 1,312 sq ft with three bedrooms, one & a half bathrooms and their own washer dryer. One year leases with separate meters & utilities except water. Unit A rented for $2,600 per month + utilities. Unit B rented for $2,900 per month + utilities. Unit C rented for $3,050 per month + utilities. Owner's Unit D located on both the second and third floor to be delivered vacant upon closing. Yearly property taxes of $40,243. Current yearly rental income: $102,600. Current yearly net income: $55k. Proforma with full occupancy market rents: Potential yearly rental income $148,800. Potential yearly net income: $98,800 @ 5% cap. Significant income and value add opportunity as a neighboring nearly identical quadruplex townhome was converted to 8 family units! (Conservative proforma with 8 total units fully renovated, split and occupied as 4 - two bedroom, one bathroom units of around 800 sq ft and 4 - one bedroom, one bathroom units around 500 sq ft) Potential yearly income: $200K+ Potential yearly net income: around $140k+ @ 7% cap Commuter, walker and food lover paradise next to B & Q subways (38 minutes to Manhattan Canal Street financial district!) B2, B7, B31, B49, B68, B82, B100 buses, Target, Marshalls, TJ Maxx, 7-11, family owned groceries and pharmacies, CVS, Sunflower cafe, Forefeathers chicken, Mabat, Bordeaux steakhouse, Argo, Look Deer, Jersey Shore Sushi, Edo, Meshuga, Tokyo, My Grill bar, Rondel, Vesuvius, J&R pizza, Family Uz Restobar, Village cafe, X Factory, Tacos Linos, Best Halal gyro, Affy's grill, Casa Maria's, Blueberry Mexican grill bakery, Gong Cha bubble tea, shopping mall, Harbor fitness, banks, shops, salons, spas, post office, Brooklyn public library and the newly renovated Kelly park playground. Near world renowned Michelin approved Tanoreen, Neta Shari, Ayat, East Harbor Seafood Palace, Chuan Tian Xia restaurants, 530 acre Marine park, playgrounds, biking greenways, dog friendly areas, wifi spots, soccer, handball, tennis, skating, basketball, baseball, football, bocce, cricket, fitness equipment, hiking, canoeing, kayaking, paddleboating, model aircraft fields, great trees, salt marsh nature trail hosts 325 bird, 50 butterfly, 100 finfish species, unique regional flora, fauna, 18 hole Championship golf course, water views, country club quality greens, fairways, driving range, Aviator sports events center, Floyd Bennett camping field, Gerritson, Kiddie, Manhattan, Plum, Brighton & Coney Island beaches, boardwalk, marinas, fishing, Belt parkway, Verrazzano & Marine parkway bridges, hospitals, police and fire stations. 18 minute non rush hour drive to Manhattan, 20 mins to LaGuardia, 24 mins to JFK and 35 mins to Newark international airports! Zoning R5B. Please do not disturb tenants.
Build Your Team
Quickly find investor-friendly professionals who can help you succeed in real estate investing at any stage of the investing journey.


Agents
Match with investor-friendly agents who can help you find, analyze, and close your next deal


Lenders
Get the best funding…find investor-friendly lenders who specialize in your deal strategy


Property Managers
Transition to passive investing. Find a trusted property management partnership that lasts.


Tax Pros & Accountants
Taxes and financial reporting made easy—find experts to create tax savings strategies, file taxes, and more
Location
Property Details
Parking
- Garage Spaces: 0
- Spaces Total: 0
Bedroom Information
- # of Bedrooms: 12
Bathroom Information
- # of Baths (Full): 8
- # of Baths (Partial): 4
- # of Baths (Total): 8.0
Interior Features
- # of Stories: 3
- Basement: Yes
- Basement Description: Finished, Full
Land Information
- Land Use: Residential Income
- Land Use Subtype: Quadruplex
Lot Information
- Parcel ID: 067970082
- Lot Size: 2500 sqft
Property Information
- Property Type: Quadruplex
- Year Built: 1985
Tax Information
- Annual Tax: $40,242
Utilities
- Water & Sewer: Public
- Heating: Hot Water, Natural Gas
- Cooling: Wall/Window Unit(s)
Location
- County: Kings
Listing Details
Investment Summary
- Monthly Cash Flow
- -$10,882
- Cap Rate
- -0.5%
- Cash-on-Cash Return
- -28.7%
- Debt Coverage Ratio
- -0.09
- Internal Rate of Return (5 years)
- -23.6%
Cash Flow
Net Operating Income (NOI) minus mortgage payments.
Calculation:
NOI - Mortgage Payments
Cap Rate (Market Value)
Capitalization Rate is a rate of return that compares the yearly Net Operating Income (NOI) to the market value.
Calculation:
NOI / Market Value
Cash-on-Cash Return (CoC)
Annual Cash Flow / Cash Invested
Calculation:
Annual cash flow divided by initial cash invested.
Debt Coverage Ratio (DCR)
Net Operating Income (NOI) divided by total debt payments.
Calculation:
NOI / Total Debt Payments
Internal Rate of Return (IRR)
A metric for assessing profitability over time. IRR is the discount rate at which the net present value (NPV) of all future cash flows (positive and negative) from an investment equals zero — including both periodic cash flow (such as rent) and a projected sale at the end of the holding period. It represents the expected annualized return, accounting for income, expenses, and the recovery of capital through a future sale.
Purchase Details
Purchase PriceThe price paid for the property. Purchase price:
| $1,980,000 |
|---|---|
Amount FinancedThe amount of the purchase financed through a loan. Amount financed:
| -$1,584,000 |
Down paymentThe initial payment made towards the purchase. Down payment:
| $396,000 |
Closing CostsFees and expenses associated with purchasing a property, typically ranging from 2% to 5% of the home’s purchase price, paid at the end of a home purchase to cover services like lending, title transfer, and taxes. Closing costs:
| $59,400 |
Rehab CostsCosts incurred to repair or improve the property, including: roof, flooring, exterior siding, kitchen, exterior paint, bathrooms, etc. Rehab costs:
| $0 |
Initial Cash InvestedThe total initial cash invested in the property. Calculation:Down payment + Buying costs + Rehab costs Initial cash invested:
| $455,400 |
Square Feet (SQFT)The total square footage of the property. Square feet:
| 0 |
Cost Per Square FootCost per square foot of the property. Calculation:Purchase Price / Square Feet Cost per square foot:
| n/a |
Monthly Rent Per Square FootMonthly rent divided by the number of square feet. This ratio helps investors compare rental income efficiency across properties, markets, and unit sizes Calculation:Monthly Rent / Square Feet Monthly rent per square foot:
| n/a |
Financing Details
Loan AmountThe total sum of money borrowed from a lender to finance a property purchase. Calculation:Purchase Price - Down Payment
Loan amount:
| $1,584,000 |
|---|---|
Loan to Value Ratio (LTV)Loan amount divided by the market value of the property. Calculation:Loan Amount / Market Value
Loan to value ratio:
| 80.0% |
Loan TypeThe type of loan (e.g., fixed, adjustable).
Loan type:
| Amortizing |
TermThe loan repayment period in years.
Term:
| 30 years |
Interest RateThe percentage a lender charges on the borrowed amount of a loan, determining the cost of borrowing money.
Interest rate:
| 6.500% |
Principal & Interest (PI)The principal is the portion of the loan payment that reduces the loan balance. The interest is the lender's charge for borrowing money. Calculation:(P * r * (1 + r) ** n) / ((1 + r) ** n - 1) Where:
P = Loan amount (principal)
Principal & interest:
| $10,012 |
Property TaxesAnnual taxes levied by local governments on real estate properties. These taxes fund public services like schools, roads, and emergency services.
Property tax:
| $3,354 |
InsuranceThe costs for insurance coverage to protect against financial losses due to risks like fire, natural disasters, theft, liability, or tenant-related damages. Calculation:Assumes 7% of gross rental income, unless insurance rates are specified.
Insurance:
| $252 |
Private Mortgage Insurance (PMI)A fee that borrowers pay when they take out a conventional loan with a loan-to-value (LTV) ratio above 80%.
Private mortgage insurance (PMI):
| $0 |
Monthly PaymentThe fixed amount a borrower pays each month to repay a loan. It typically includes principal and interest (P&I) and may also cover property taxes, insurance, HOA fees, and PMI if escrowed. Monthly payment:
| $13,618 |
Operating Income
| % Rent | Monthly | Yearly | |
|---|---|---|---|
Gross RentThe total rental income received from tenants before deducting any expenses. Includes base rent, late fees, pet fees, parking fees, and other recurring charges.
Gross rent:
| $3,600 | $43,200 | |
Vacancy LossExpected loss of rent due to vacancies.
Vacancy loss:
(6%)
| 6% | -$216 | -$2,592 |
Operating IncomeGross rental income minus vacancy loss. Calculation:Gross rent - Vacancy loss
Operating income:
| $3,384 | $40,608 |
Operating Expenses
| % Rent | Monthly | Yearly | |
|---|---|---|---|
Property TaxesAnnual taxes levied by local governments on real estate properties. These taxes fund public services like schools, roads, and emergency services. | 93% | -$3,354 | -$40,242 |
InsuranceThe costs for insurance coverage to protect against financial losses due to risks like fire, natural disasters, theft, liability, or tenant-related damages. Calculation:Assumes 7% of gross rental income, unless insurance rates are specified. | 7% | -$252 | -$3,024 |
Property ManagementThe costs associated with hiring a property manager to handle the day-to-day operations of a rental property. Includes management fees, leasing fes, eviction fees, etc. Calculation:Assumes 8% of gross rental income. | 8% | -$288 | -$3,456 |
Repairs & MaintenanceOngoing costs for routine upkeep and minor fixes needed to keep a property in good working condition. Calculation:Assumes 5% of gross rental income. Varies by property age and condition. | 5% | -$180 | -$2,160 |
Capital ExpensesLarge, infrequent costs for major improvements or replacements, like a new roof, HVAC system, or appliances. Calculation:Assumes 5% of gross rental income. Varies by property age. | 5% | -$180 | -$2,160 |
HOA FeesRegular dues paid to a Homeowners Association for community maintenance, amenities, and management. Similar fees include: Condo Association Fees, Co-op Maintenance Fees, etc. | n/a | n/a | n/a |
Operating ExpensesRecurring costs required to maintain and manage a rental property, including property taxes, insurance, maintenance, repairs, utilities (if paid by the owner), property management fees, and other day-to-day expenses. Calculation:Insurance + Property Taxes + Property Management + Repairs & Maintenance + Capital Expenditures + HOA Fees | 118% | -$4,254 | -$51,042 |
Cash Flow
| Monthly | Yearly | |
|---|---|---|
Net Operating Income (NOI)The income generated from a property after deducting all operating expenses but before deducting mortgage payments, taxes, and capital expenditures. Calculation:Gross Operating Income - Operating Expenses
Net operating income:
| -$870 | -$10,440 |
Mortgage PaymentThe fixed amount a borrower pays each month to repay a loan. It typically includes principal and interest (P&I) and may also cover property taxes, insurance, HOA fees, and PMI if escrowed. | -$10,012 | -$120,144 |
Cash FlowNet Operating Income (NOI) minus mortgage payments. Calculation:NOI - Mortgage Payments | $10,882 | $130,584 |