$474,400
Investment Summary
- Monthly Cash Flow
- -$571
- Cap Rate
- 4.8%
- Cash-on-Cash Return
- -6.3%
- Debt Coverage Ratio
- 0.77
- Internal Rate of Return (5 years)
- -2.1%
Cash Flow
Net Operating Income (NOI) minus mortgage payments.
Calculation:
NOI - Mortgage Payments
Cap Rate (Market Value)
Capitalization Rate is a rate of return that compares the yearly Net Operating Income (NOI) to the market value.
Calculation:
NOI / Market Value
Cash-on-Cash Return (CoC)
Annual Cash Flow / Cash Invested
Calculation:
Annual cash flow divided by initial cash invested.
Debt Coverage Ratio (DCR)
Net Operating Income (NOI) divided by total debt payments.
Calculation:
NOI / Total Debt Payments
Internal Rate of Return (IRR)
A metric for assessing profitability over time. IRR is the discount rate at which the net present value (NPV) of all future cash flows (positive and negative) from an investment equals zero — including both periodic cash flow (such as rent) and a projected sale at the end of the holding period. It represents the expected annualized return, accounting for income, expenses, and the recovery of capital through a future sale.
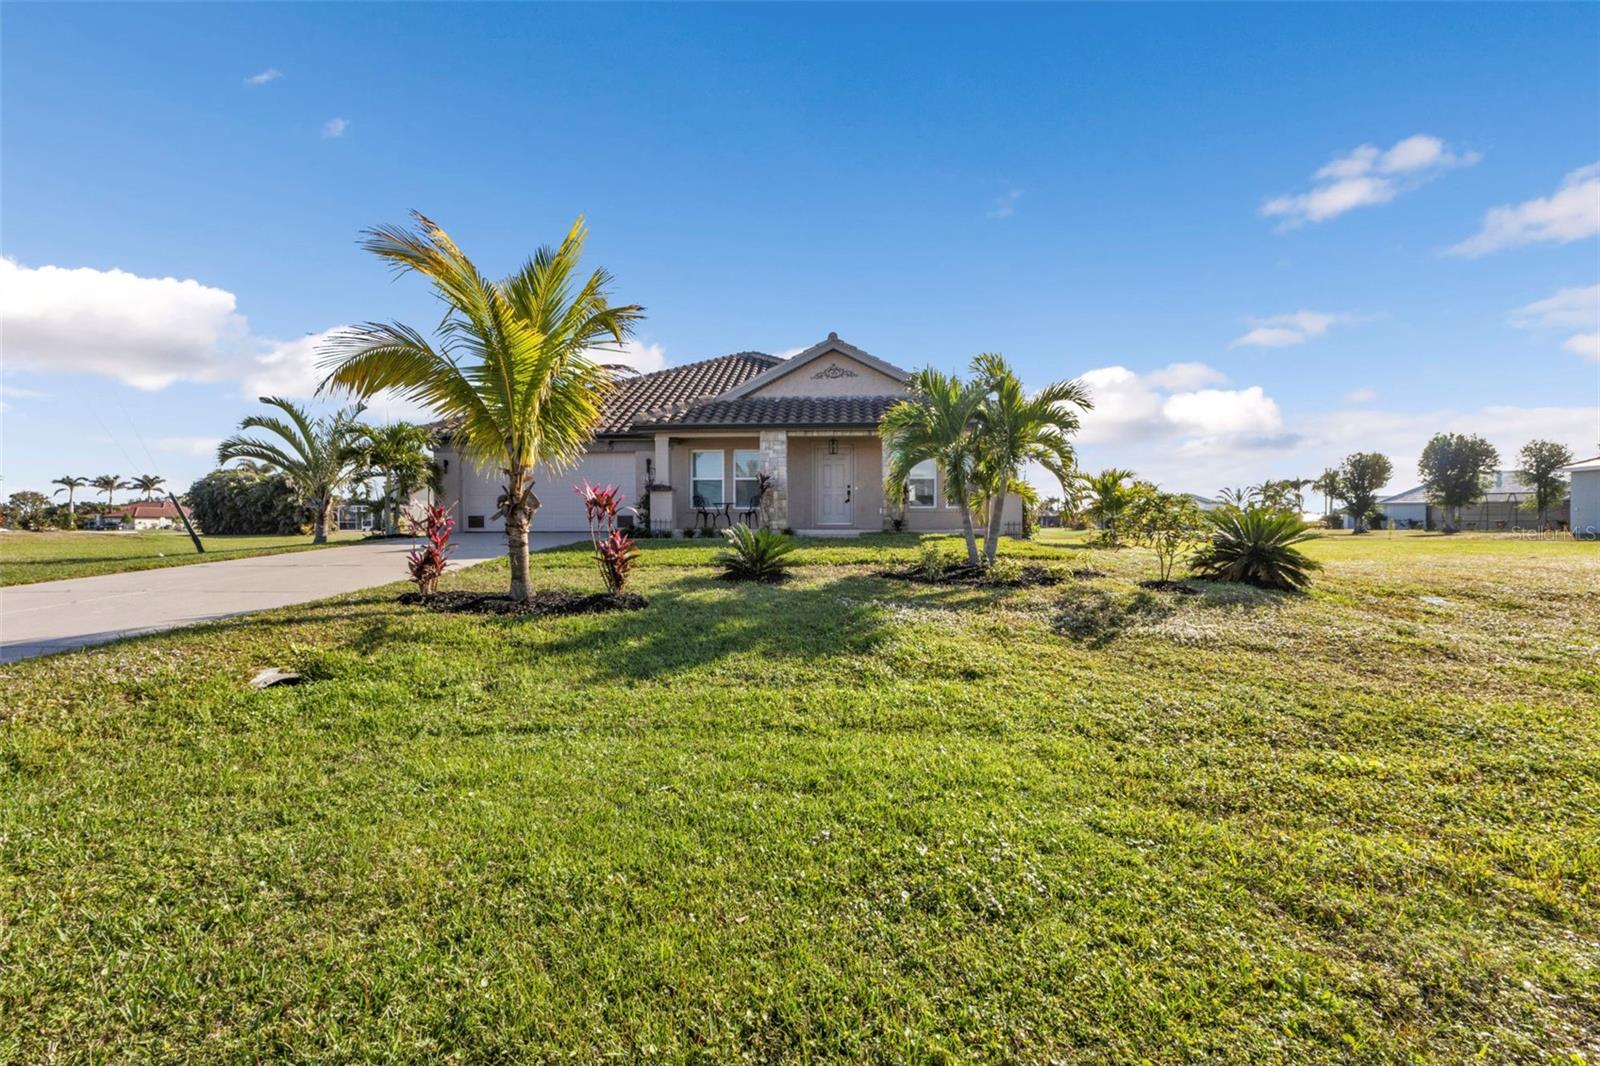
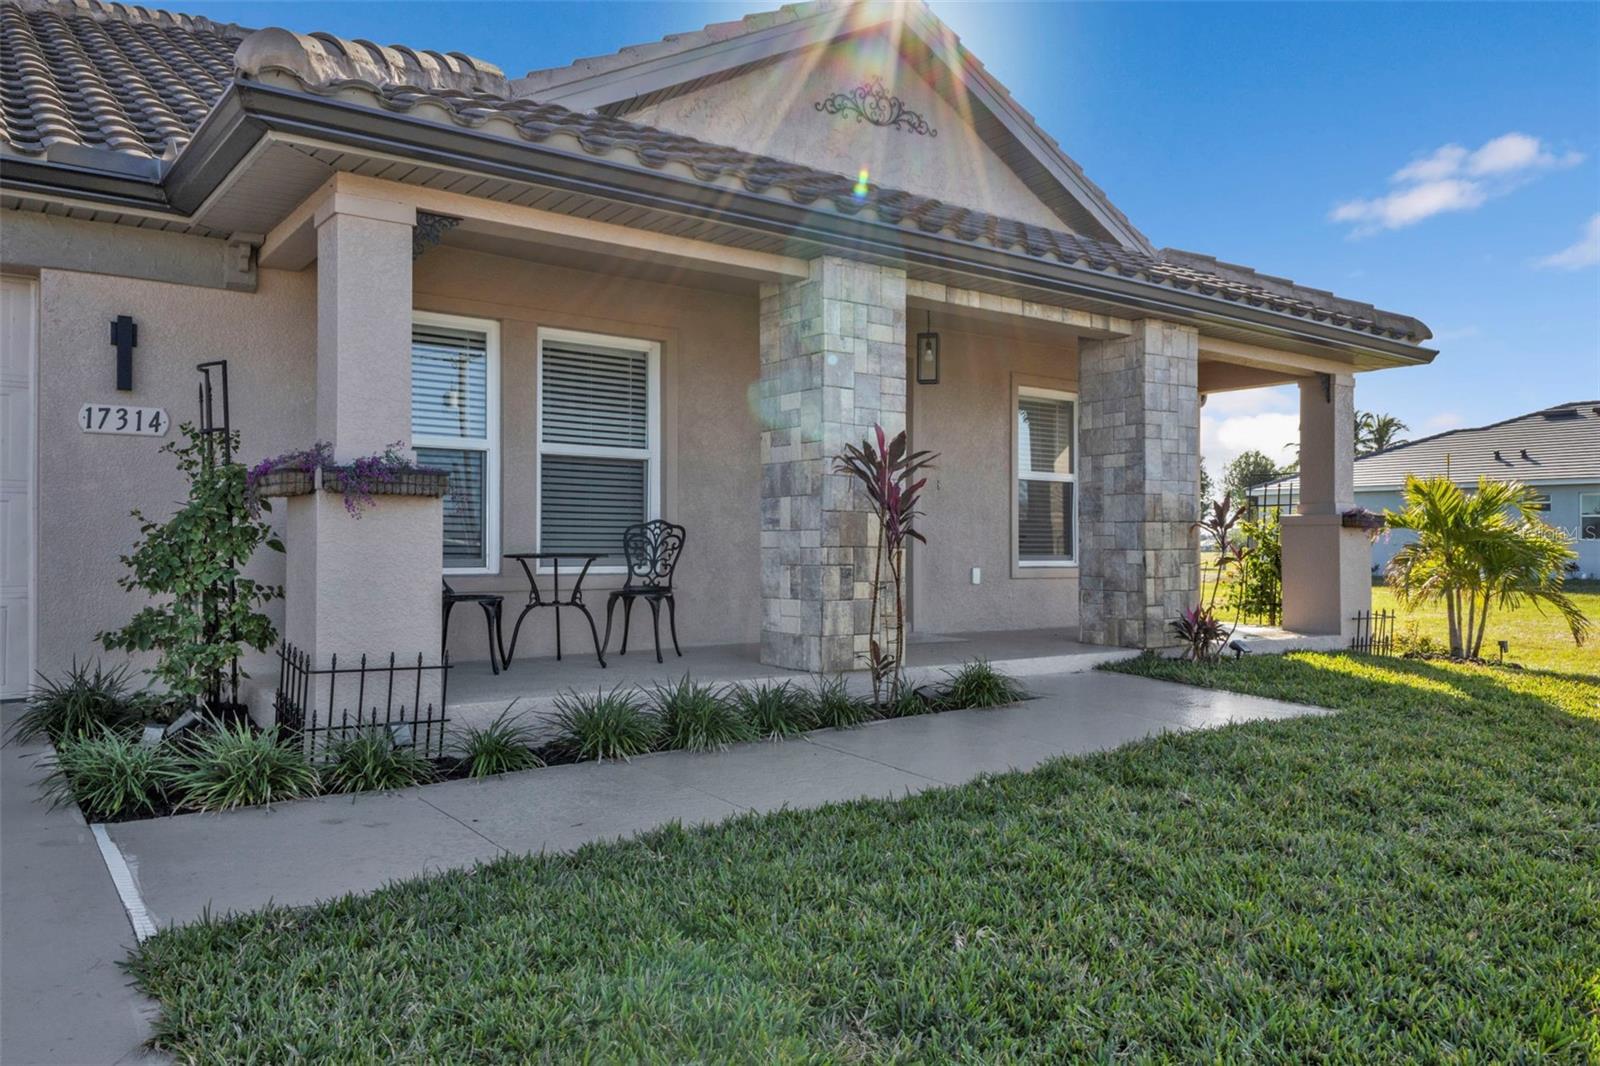
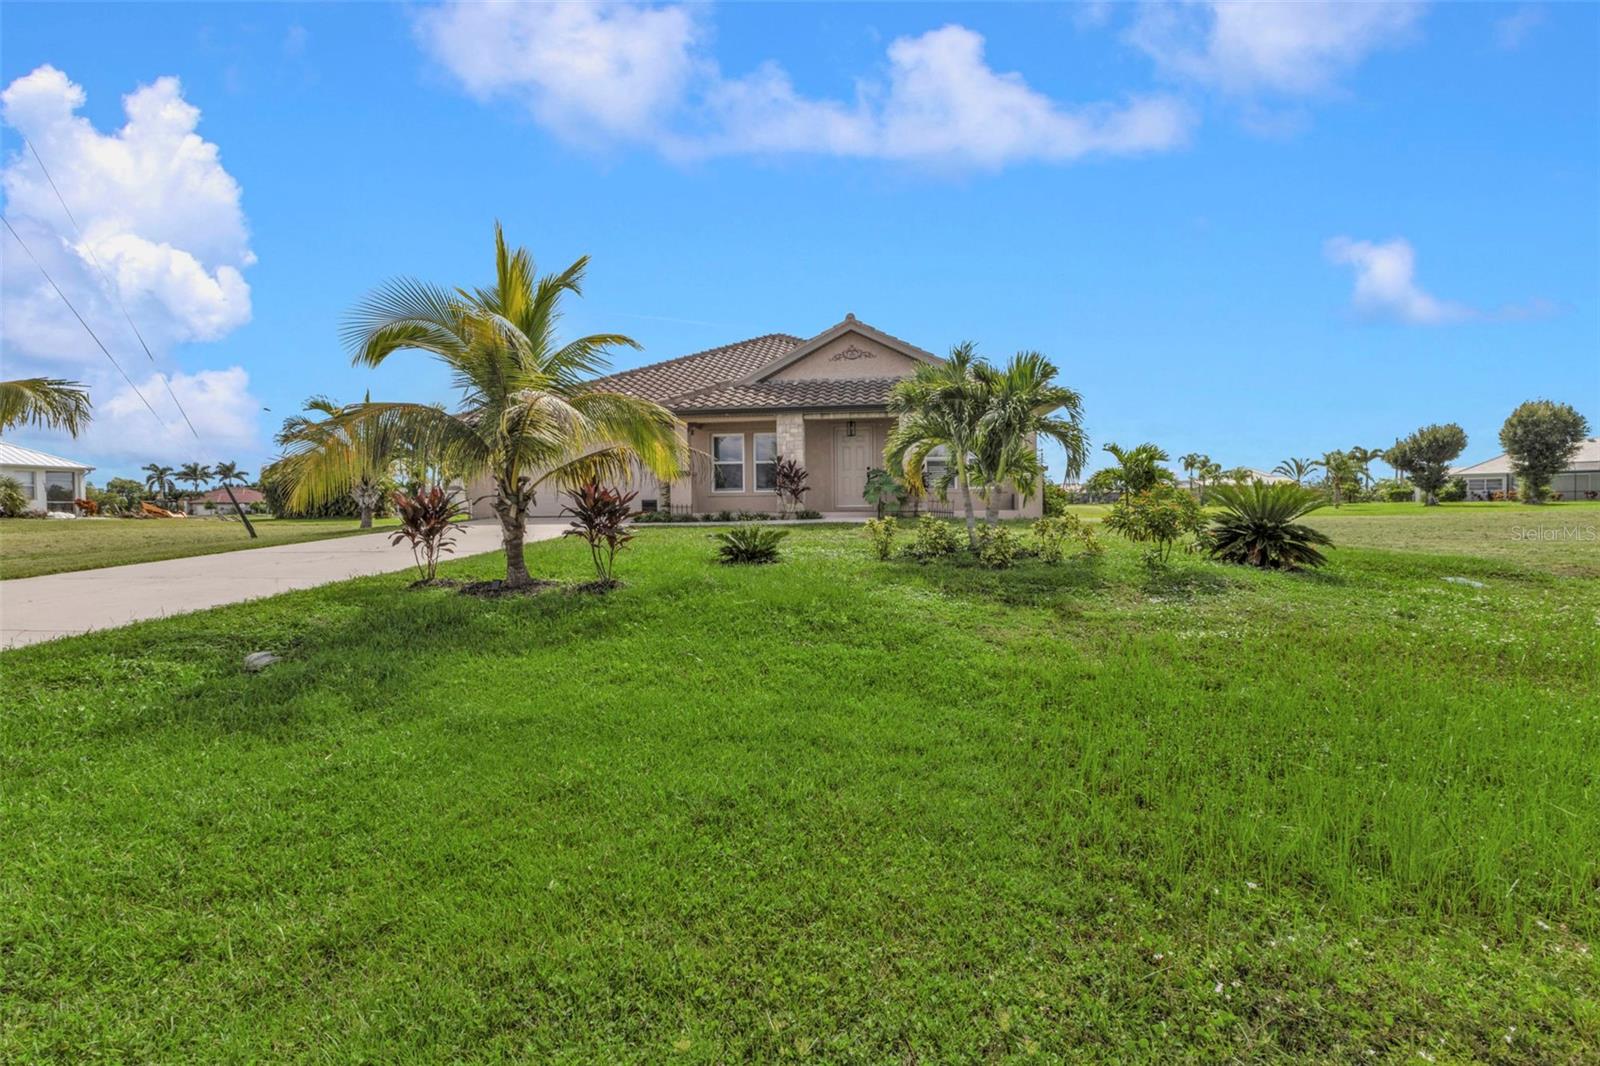
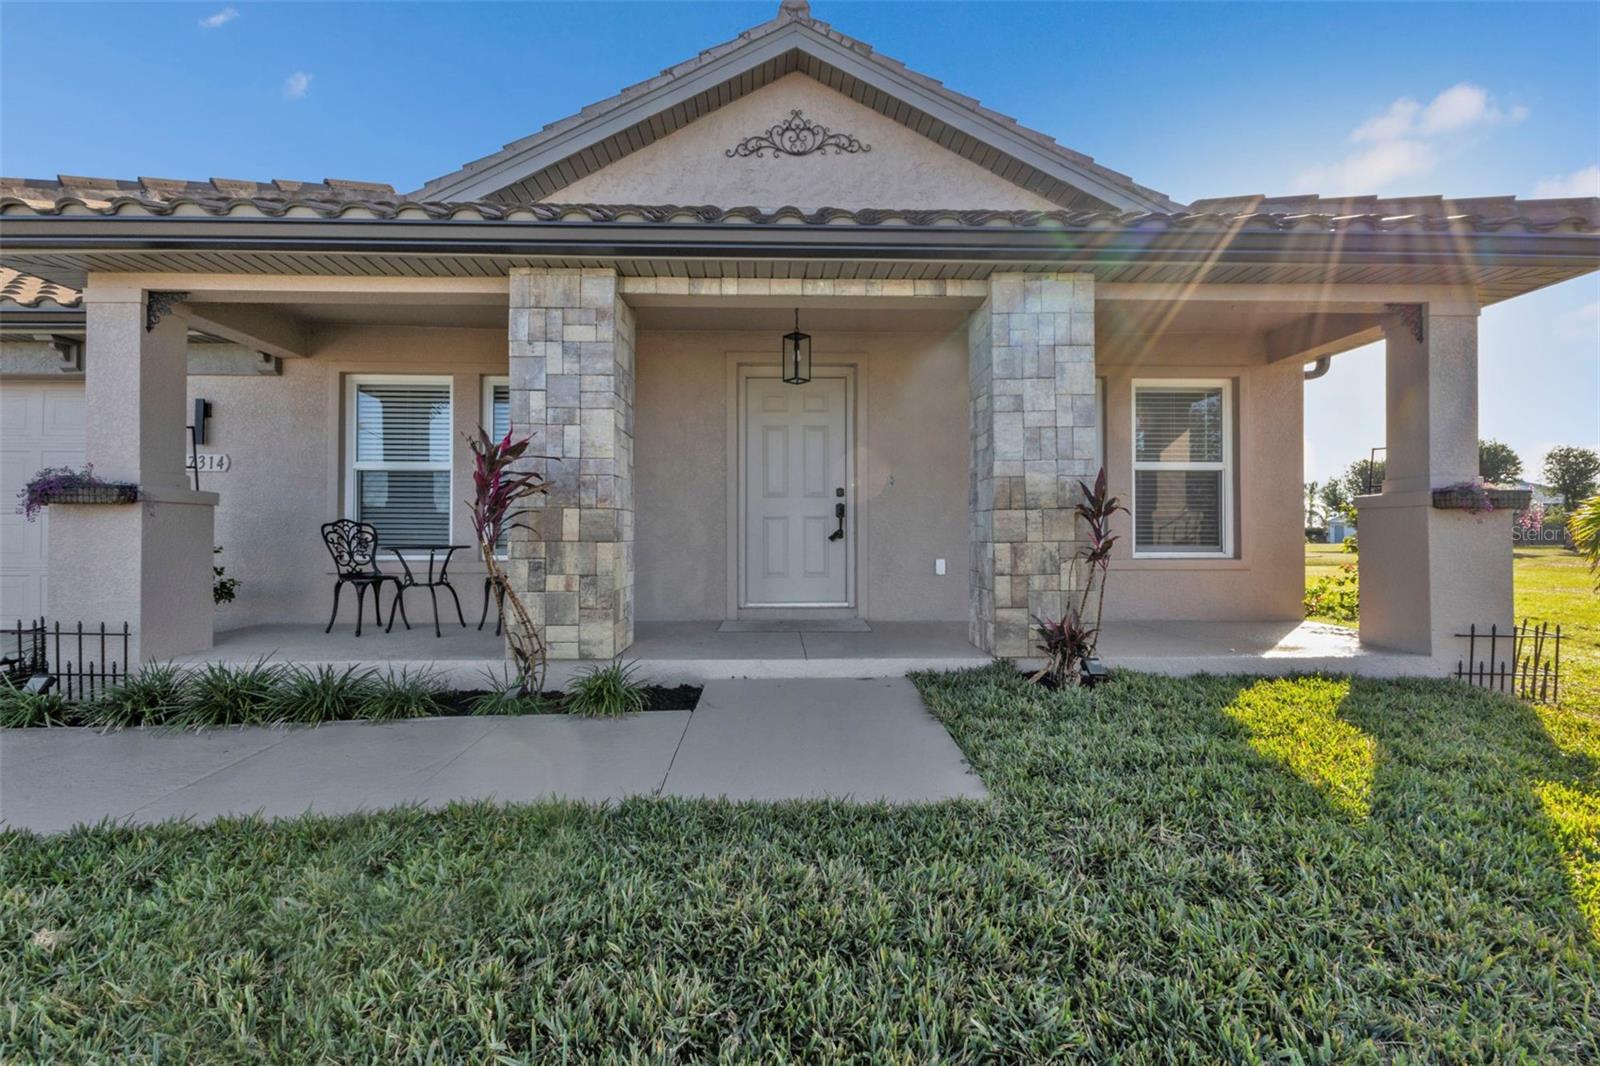
Property Description
LIKE NEW CONSTRUCTION & OWNER FINANCING BEING OFFERED: - Located in the GORGEOUS GOLF CART FRIENDLY COMMUNITY OF BURNT STORE LAKES - 3 Bed+ Den / 2 Bath Home - Nearly $200,000 has been invested in thoughtful renovations, making this home feel like new construction. The elevated curb appeal is immediately evident with the new stone covering on the columns, providing a beautiful & stately appeal as you approach the home. Experience modern luxury in this exquisitely renovated residence situated in this highly sought-after community. This meticulously remodeled home provides ample space & comfort with its open floor plan, creating an expansively inviting atmosphere, perfect for both entertaining & daily living. As you step inside, the entryway flows seamlessly into a spacious living area, where large sliding glass doors open up to a beautifully pavered patio. This transition fluidly connects indoor & outdoor spaces, making it ideal for hosting gatherings or enjoying tranquil evenings. The living room, with its high ceilings & abundant natural light, creates a bright and airy ambiance, while the adjacent dining area offers a perfect space for formal meals or casual dining. The kitchen is a chef’s dream, featuring sleek stainless steel appliances, including a new stove and microwave, along with luxurious stone countertops & solid wood cabinetry. The kitchen effortlessly blends into the living area, allowing for easy interaction with guests while preparing meals. The master suite is a private retreat, featuring a spacious bedroom with large windows that let in plenty of natural light. The en-suite bathroom has been tastefully updated & remodeled with modern finishes & fixtures, providing a spa-like experience. Two additional bedrooms & a den provide flexibility for guests or a home office, each room showcasing new luxury vinyl flooring & contemporary light fixtures. Key upgrades include impact windows and front door, a new irrigation system, and exquisitely updated landscaping that enhances curb appeal. The exterior proudly features two elegant stone columns & fresh, vibrant paint, while the garage, driveway, and sidewalk are finished with durable epoxy flooring. (Full list of renovations and cost breakdown can be found in attachments). Located in Burnt Store Lakes, residents enjoy a serene, nature-rich environment with 11 lakes & abundant wildlife. The community offers a park with pavilions, a playground, and a canoe/kayak launch ramp, providing plenty of opportunities for outdoor activities. Additionally, the convenience of nearby amenities includes Safe Harbor Burnt Store Marina, which is just a Golf Cart drive away where you can enjoy access to the second-largest saltwater estuary in Florida. This world-class marina offers both wet slips & dry stack storage, ensuring your boating needs are fully met. The marina also features the delightful Cass Cay Restaurant, where you can enjoy waterfront dining, and the Burnt Store Boat Ramp for easy access to water activities. Enjoy the best of both worlds with this prime location nestled right between Cape Coral and Punta Gorda. Nearby development is bringing grocery stores, shopping centers, & restaurants, adding to the convenience and appeal of the area. With its inviting layout, luxurious upgrades, and prime location, this home is a rare find. It's time to stop dreaming and start actually living your slice of Florida Paradise Sunshine Home Dreams!
Build Your Team
Quickly find investor-friendly professionals who can help you succeed in real estate investing at any stage of the investing journey.


Agents
Match with investor-friendly agents who can help you find, analyze, and close your next deal


Lenders
Get the best funding…find investor-friendly lenders who specialize in your deal strategy


Property Managers
Transition to passive investing. Find a trusted property management partnership that lasts.


Tax Pros & Accountants
Taxes and financial reporting made easy—find experts to create tax savings strategies, file taxes, and more
Location
Property Details
Parking
- Description: Attached, Garage
- Details: Attached
- Garage Spaces: 2
- Spaces Total: 0
Bedroom Information
- # of Bedrooms: 3
Bathroom Information
- # of Baths (Full): 2
- # of Baths (Total): 2.0
Interior Features
- # of Rooms: 7
- # of Stories: 1
Exterior Features
- Exterior Walls Materials: Stucco
- Foundation: Slab
- Roof Material: Tile
HOA
- Has HOA: Yes
- Association: BURNT STORE LAKES PROPERTY OWNERS ASSOCIATION
- HOA Fee: $494/annually
Land Information
- Land Use: Residential
- Land Use Subtype: Single Family Residential
Lot Information
- Parcel ID: 422331402004
- Lot Size: 9598 sqft
Property Information
- Property Type: Single Family Residence
- Style: Florida, Ranch
- Year Built: 2006
Tax Information
- Annual Tax: $3,135
Utilities
- Water & Sewer: Public
- Heating: Central, Electric
- Cooling: Central Air
Location
- County: Charlotte
Listing Details
Investment Summary
- Monthly Cash Flow
- -$571
- Cap Rate
- 4.8%
- Cash-on-Cash Return
- -6.3%
- Debt Coverage Ratio
- 0.77
- Internal Rate of Return (5 years)
- -2.1%
Cash Flow
Net Operating Income (NOI) minus mortgage payments.
Calculation:
NOI - Mortgage Payments
Cap Rate (Market Value)
Capitalization Rate is a rate of return that compares the yearly Net Operating Income (NOI) to the market value.
Calculation:
NOI / Market Value
Cash-on-Cash Return (CoC)
Annual Cash Flow / Cash Invested
Calculation:
Annual cash flow divided by initial cash invested.
Debt Coverage Ratio (DCR)
Net Operating Income (NOI) divided by total debt payments.
Calculation:
NOI / Total Debt Payments
Internal Rate of Return (IRR)
A metric for assessing profitability over time. IRR is the discount rate at which the net present value (NPV) of all future cash flows (positive and negative) from an investment equals zero — including both periodic cash flow (such as rent) and a projected sale at the end of the holding period. It represents the expected annualized return, accounting for income, expenses, and the recovery of capital through a future sale.
Purchase Details
Purchase PriceThe price paid for the property. Purchase price:
| $474,400 |
|---|---|
Amount FinancedThe amount of the purchase financed through a loan. Amount financed:
| -$379,520 |
Down paymentThe initial payment made towards the purchase. Down payment:
| $94,880 |
Closing CostsFees and expenses associated with purchasing a property, typically ranging from 2% to 5% of the home’s purchase price, paid at the end of a home purchase to cover services like lending, title transfer, and taxes. Closing costs:
| $14,232 |
Rehab CostsCosts incurred to repair or improve the property, including: roof, flooring, exterior siding, kitchen, exterior paint, bathrooms, etc. Rehab costs:
| $0 |
Initial Cash InvestedThe total initial cash invested in the property. Calculation:Down payment + Buying costs + Rehab costs Initial cash invested:
| $109,112 |
Square Feet (SQFT)The total square footage of the property. Square feet:
| 2,216 |
Cost Per Square FootCost per square foot of the property. Calculation:Purchase Price / Square Feet Cost per square foot:
| $214 |
Monthly Rent Per Square FootMonthly rent divided by the number of square feet. This ratio helps investors compare rental income efficiency across properties, markets, and unit sizes Calculation:Monthly Rent / Square Feet Monthly rent per square foot:
| $1.44 |
Financing Details
Loan AmountThe total sum of money borrowed from a lender to finance a property purchase. Calculation:Purchase Price - Down Payment
Loan amount:
| $379,520 |
|---|---|
Loan to Value Ratio (LTV)Loan amount divided by the market value of the property. Calculation:Loan Amount / Market Value
Loan to value ratio:
| 80.0% |
Loan TypeThe type of loan (e.g., fixed, adjustable).
Loan type:
| Amortizing |
TermThe loan repayment period in years.
Term:
| 30 years |
Interest RateThe percentage a lender charges on the borrowed amount of a loan, determining the cost of borrowing money.
Interest rate:
| 6.810% |
Principal & Interest (PI)The principal is the portion of the loan payment that reduces the loan balance. The interest is the lender's charge for borrowing money. Calculation:(P * r * (1 + r) ** n) / ((1 + r) ** n - 1) Where:
P = Loan amount (principal)
Principal & interest:
| $2,477 |
Property TaxesAnnual taxes levied by local governments on real estate properties. These taxes fund public services like schools, roads, and emergency services.
Property tax:
| $261 |
InsuranceThe costs for insurance coverage to protect against financial losses due to risks like fire, natural disasters, theft, liability, or tenant-related damages. Calculation:Assumes 7% of gross rental income, unless insurance rates are specified.
Insurance:
| $224 |
Private Mortgage Insurance (PMI)A fee that borrowers pay when they take out a conventional loan with a loan-to-value (LTV) ratio above 80%.
Private mortgage insurance (PMI):
| $0 |
Monthly PaymentThe fixed amount a borrower pays each month to repay a loan. It typically includes principal and interest (P&I) and may also cover property taxes, insurance, HOA fees, and PMI if escrowed. Monthly payment:
| $2,962 |
Operating Income
| % Rent | Monthly | Yearly | |
|---|---|---|---|
Gross RentThe total rental income received from tenants before deducting any expenses. Includes base rent, late fees, pet fees, parking fees, and other recurring charges.
Gross rent:
| $3,200 | $38,400 | |
Vacancy LossExpected loss of rent due to vacancies.
Vacancy loss:
(6%)
| 6% | -$192 | -$2,304 |
Operating IncomeGross rental income minus vacancy loss. Calculation:Gross rent - Vacancy loss
Operating income:
| $3,008 | $36,096 |
Operating Expenses
| % Rent | Monthly | Yearly | |
|---|---|---|---|
Property TaxesAnnual taxes levied by local governments on real estate properties. These taxes fund public services like schools, roads, and emergency services. | 8% | -$261 | -$3,135 |
InsuranceThe costs for insurance coverage to protect against financial losses due to risks like fire, natural disasters, theft, liability, or tenant-related damages. Calculation:Assumes 7% of gross rental income, unless insurance rates are specified. | 7% | -$224 | -$2,688 |
Property ManagementThe costs associated with hiring a property manager to handle the day-to-day operations of a rental property. Includes management fees, leasing fes, eviction fees, etc. Calculation:Assumes 8% of gross rental income. | 8% | -$256 | -$3,072 |
Repairs & MaintenanceOngoing costs for routine upkeep and minor fixes needed to keep a property in good working condition. Calculation:Assumes 5% of gross rental income. Varies by property age and condition. | 5% | -$160 | -$1,920 |
Capital ExpensesLarge, infrequent costs for major improvements or replacements, like a new roof, HVAC system, or appliances. Calculation:Assumes 5% of gross rental income. Varies by property age. | 5% | -$160 | -$1,920 |
HOA FeesRegular dues paid to a Homeowners Association for community maintenance, amenities, and management. Similar fees include: Condo Association Fees, Co-op Maintenance Fees, etc. | 1% | -$41 | -$492 |
Operating ExpensesRecurring costs required to maintain and manage a rental property, including property taxes, insurance, maintenance, repairs, utilities (if paid by the owner), property management fees, and other day-to-day expenses. Calculation:Insurance + Property Taxes + Property Management + Repairs & Maintenance + Capital Expenditures + HOA Fees | 34% | -$1,102 | -$13,227 |
Cash Flow
| Monthly | Yearly | |
|---|---|---|
Net Operating Income (NOI)The income generated from a property after deducting all operating expenses but before deducting mortgage payments, taxes, and capital expenditures. Calculation:Gross Operating Income - Operating Expenses
Net operating income:
| $1,906 | $22,872 |
Mortgage PaymentThe fixed amount a borrower pays each month to repay a loan. It typically includes principal and interest (P&I) and may also cover property taxes, insurance, HOA fees, and PMI if escrowed. | -$2,477 | -$29,724 |
Cash FlowNet Operating Income (NOI) minus mortgage payments. Calculation:NOI - Mortgage Payments | $571 | $6,852 |