$649,900
Investment Summary
- Monthly Cash Flow
- -$1,434
- Cap Rate
- 3.5%
- Cash-on-Cash Return
- -11.5%
- Debt Coverage Ratio
- 0.57
- Internal Rate of Return (5 years)
- -7.1%
Cash Flow
Net Operating Income (NOI) minus mortgage payments.
Calculation:
NOI - Mortgage Payments
Cap Rate (Market Value)
Capitalization Rate is a rate of return that compares the yearly Net Operating Income (NOI) to the market value.
Calculation:
NOI / Market Value
Cash-on-Cash Return (CoC)
Annual Cash Flow / Cash Invested
Calculation:
Annual cash flow divided by initial cash invested.
Debt Coverage Ratio (DCR)
Net Operating Income (NOI) divided by total debt payments.
Calculation:
NOI / Total Debt Payments
Internal Rate of Return (IRR)
A metric for assessing profitability over time. IRR is the discount rate at which the net present value (NPV) of all future cash flows (positive and negative) from an investment equals zero — including both periodic cash flow (such as rent) and a projected sale at the end of the holding period. It represents the expected annualized return, accounting for income, expenses, and the recovery of capital through a future sale.
Property Description
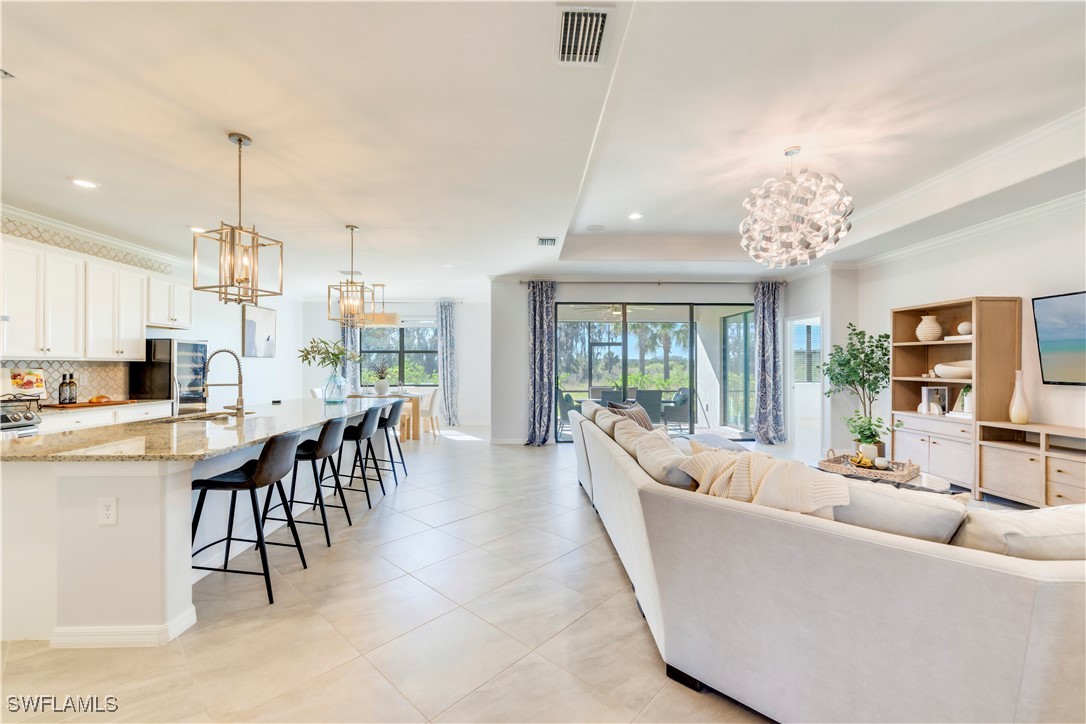
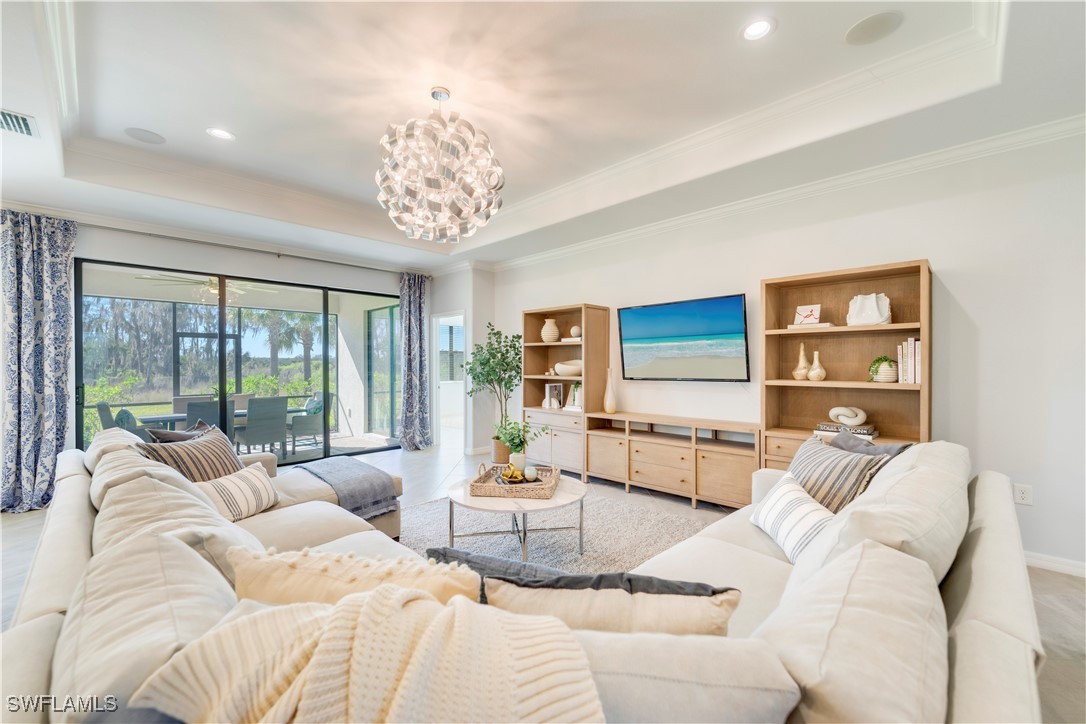
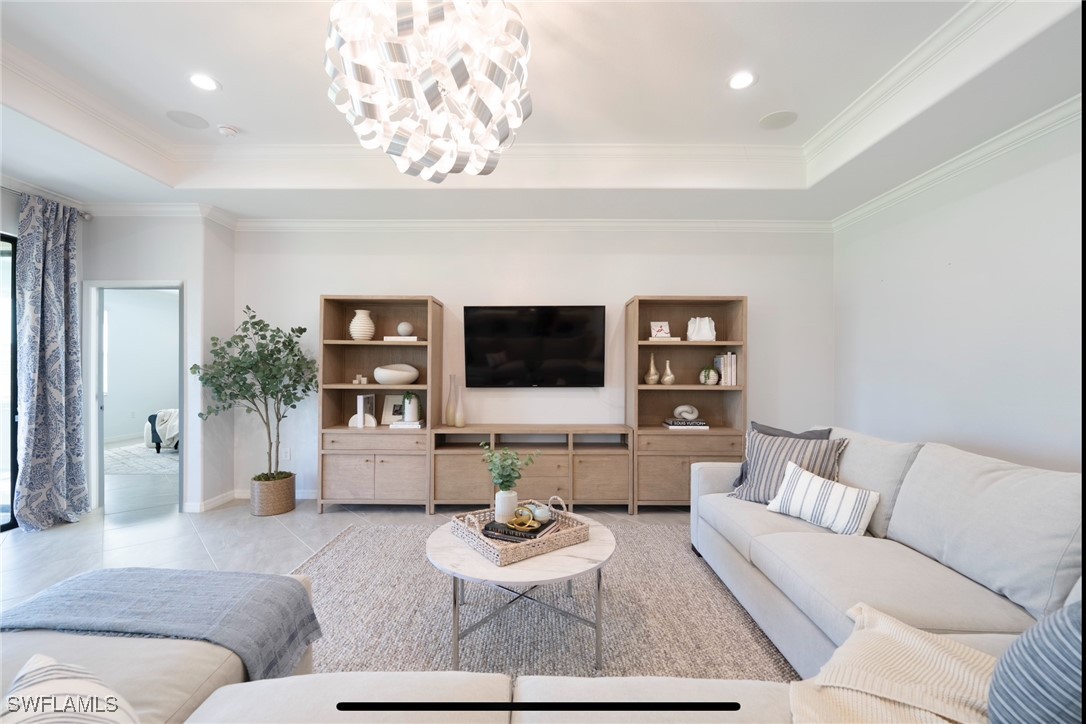
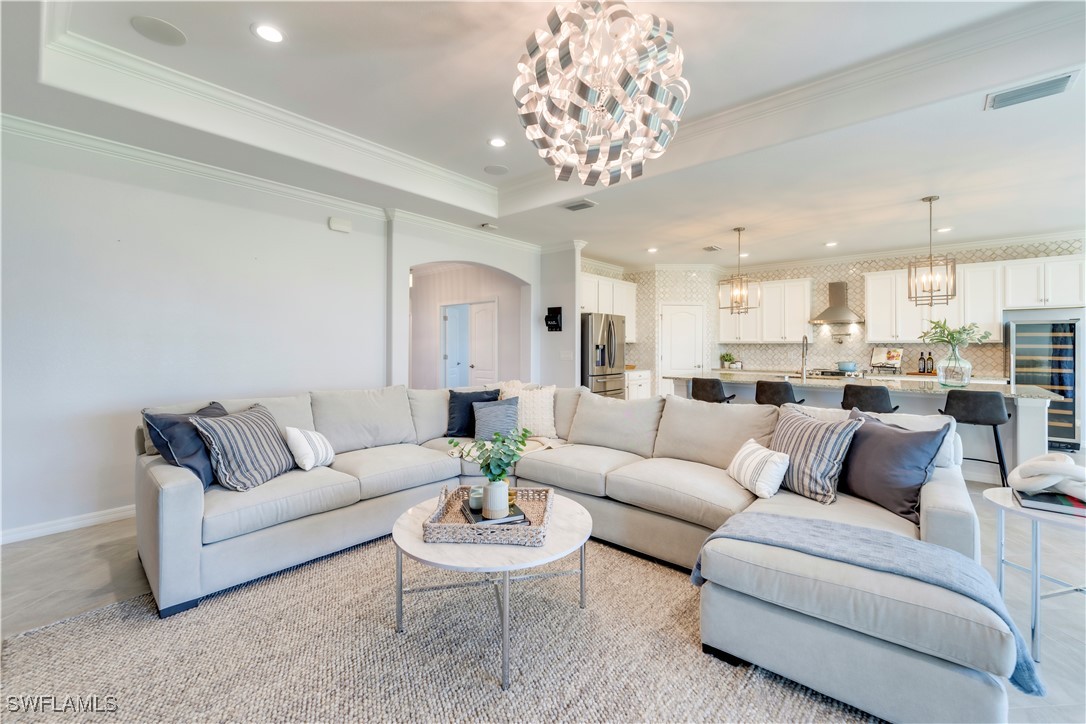
MASSIVE $50K PRICE REDUCTION for a QUICK SALE! This beautifully UPGRADED SUMMERVILLE, offers 2,445 sqft of interior living space, 3 BEDROOMS, 3 FULL BATHS, a DEN WITH DOUBLE DOORS, & a SPACIOUS 3-CAR GARAGE could be all yours! Located in the highly desirable community of THE PLACE AT CORKSCREW, this home sits on an OVERSIZED WESTERN-FACING LOT w/ UNOBSTRUCTED SUNSET VIEWS over a PROTECTED NATURE PRESERVE. Step through the DOUBLE GLASS ENTRY DOORS into a LIGHT-FILLED FOYER with TILE FLOORING THROUGHOUT & elegant CROWN MOULDING. The open-concept layout showcases soft NEUTRAL COLOR TONES that create a calming, SPA-LIKE ATMOSPHERE. The GOURMET KITCHEN features a FLOOR-TO-CEILING MARBLE BACKSPLASH, LUXURY RANGE HOOD, POT FILLER, OVERSIZED ISLAND, HIGH-END KITCHEN FAUCET, & EXTENDED CABINETRY with a WINE AND BEVERAGE COOLER. Enjoy PREMIUM STAINLESS STEEL APPLIANCES including a SAMSUNG SMART AIR-FRYING STOVE & a FRENCH DOOR SAMSUNG FRIDGE & FREEZER. The spacious LIVING AREA includes RECESSED LIGHTING, a DESIGNER CHANDELIER, TRAY CEILING, and a YAMAHA SURROUND SOUND SYSTEM with 4 IN-CEILING SPEAKERS, perfect for entertaining or relaxing movie nights. Just off the kitchen, a generous DINING AREA offers gorgeous VIEWS OF THE PRESERVE. The PRIMARY SUITE is a peaceful retreat with DIRECT LANAI ACCESS, TWO WALK-IN CLOSETS, SPLIT DUAL VANITIES, and a LARGE SPA-LIKE SHOWER. The FIRST GUEST BEDROOM is located at the front of the home with a nearby FULL BATHROOM featuring a TUB AND SHOWER COMBINATION. The SECOND GUEST BEDROOM includes ITS OWN EN SUITE BATHROOM with a WALK-IN SHOWER, ideal for visitors or family members seeking extra privacy. The DEN WITH DOUBLE DOORS provides a FLEXIBLE SPACE for a HOME OFFICE, MEDIA ROOM, or ADDITIONAL GUEST ROOM. Step outside to enjoy a COVERED SCREENED LANAI plus a CUSTOM PAVER PATIO perfect for grilling out, a fire pit or sunbathing. Enjoy WESTERN SUNSET VIEWS with AMPLE SPACE TO ADD A CUSTOM POOL! This backyard offers endless possibilities for outdoor living. Additional features include TILE FLOORING THROUGHOUT—NO CARPET, HIGH-END CHANDELIERS AND DESIGNER LIGHT FIXTURES, SAMSUNG FRONT-LOAD WASHER AND DRYER ON PEDESTALS, CEILING FANS IN EVERY ROOM, FULL-HOUSE GUTTERS, and a 3-CAR EPOXY-COATED GARAGE with 2 YAMAHA IN-CEILING SPEAKERS. Don't miss the VIRTUAL TOUR attached to this listing - ask your agent for the link! The Place at Corkscrew offers unmatched RESORT-STYLE AMENITIES including a ZERO-ENTRY POOL, 100-FOOT WATERSLIDE, 2-STORY FITNESS CENTER, RESTAURANT, CAFE, BOURBON BAR, PICKLEBALL, TENNIS, BOCCE, DOG PARK, SAND VOLLEYBALL, FIRE PIT AREA, and so much more! Just across the street is the JACK NICKLAUS-DESIGNED OLD CORKSCREW GOLF COURSE. Plus, a NEW PUBLIX SHOPPING CENTER with DINING, COFFEE, BANKING, AND RETAIL is only 1 mile away. Just 15 MINUTES FROM RSW AIRPORT, 10 mins to GULF COAST TOWN CENTER & MIROMAR OUTLETS, and 40 mins to SWFL BEACHES—while staying OUTSIDE OF HIGH-TRAFFIC AND FLOOD ZONES.
Build Your Team
Quickly find investor-friendly professionals who can help you succeed in real estate investing at any stage of the investing journey.


Agents
Match with investor-friendly agents who can help you find, analyze, and close your next deal


Lenders
Get the best funding…find investor-friendly lenders who specialize in your deal strategy


Property Managers
Transition to passive investing. Find a trusted property management partnership that lasts.


Tax Pros & Accountants
Taxes and financial reporting made easy—find experts to create tax savings strategies, file taxes, and more
Location
Property Details
Parking
- Description: 2+ Spaces, Driveway Paved
- Details: Attached, Driveway, Garage, Paved, Garage Door Opener
- Garage Spaces: 3
- Spaces Total: 0
Bedroom Information
- # of Bedrooms: 3
Bathroom Information
- # of Baths (Full): 3
- # of Baths (Total): 3.0
Interior Features
- # of Rooms: 0
- # of Stories: 1
Exterior Features
- Exterior Walls Materials: Stucco
- Roof Type: IRR/Cathedral
- Roof Material: Tile
HOA
- Has HOA: Yes
- HOA Fee: $1,364/quarterly
Land Information
- Land Use: Residential
- Land Use Subtype: Single Family Residential
Lot Information
- Parcel ID: 244626L20800B.6910
- Lot Size: 0 sqft
Property Information
- Property Type: Single Family Residence
- Style: Ranch, One Story
- Year Built: 2020
Tax Information
- Annual Tax: $8,225
Utilities
- Water & Sewer: Public
- Heating: Central, Electric
- Cooling: Central Air, Ceiling Fan(s), Electric
Location
- County: Lee
Listing Details
Investment Summary
- Monthly Cash Flow
- -$1,434
- Cap Rate
- 3.5%
- Cash-on-Cash Return
- -11.5%
- Debt Coverage Ratio
- 0.57
- Internal Rate of Return (5 years)
- -7.1%
Cash Flow
Net Operating Income (NOI) minus mortgage payments.
Calculation:
NOI - Mortgage Payments
Cap Rate (Market Value)
Capitalization Rate is a rate of return that compares the yearly Net Operating Income (NOI) to the market value.
Calculation:
NOI / Market Value
Cash-on-Cash Return (CoC)
Annual Cash Flow / Cash Invested
Calculation:
Annual cash flow divided by initial cash invested.
Debt Coverage Ratio (DCR)
Net Operating Income (NOI) divided by total debt payments.
Calculation:
NOI / Total Debt Payments
Internal Rate of Return (IRR)
A metric for assessing profitability over time. IRR is the discount rate at which the net present value (NPV) of all future cash flows (positive and negative) from an investment equals zero — including both periodic cash flow (such as rent) and a projected sale at the end of the holding period. It represents the expected annualized return, accounting for income, expenses, and the recovery of capital through a future sale.
Purchase Details
Purchase PriceThe price paid for the property. Purchase price:
| $649,900 |
|---|---|
Amount FinancedThe amount of the purchase financed through a loan. Amount financed:
| -$519,920 |
Down paymentThe initial payment made towards the purchase. Down payment:
| $129,980 |
Closing CostsFees and expenses associated with purchasing a property, typically ranging from 2% to 5% of the home’s purchase price, paid at the end of a home purchase to cover services like lending, title transfer, and taxes. Closing costs:
| $19,497 |
Rehab CostsCosts incurred to repair or improve the property, including: roof, flooring, exterior siding, kitchen, exterior paint, bathrooms, etc. Rehab costs:
| $0 |
Initial Cash InvestedThe total initial cash invested in the property. Calculation:Down payment + Buying costs + Rehab costs Initial cash invested:
| $149,477 |
Square Feet (SQFT)The total square footage of the property. Square feet:
| 2,445 |
Cost Per Square FootCost per square foot of the property. Calculation:Purchase Price / Square Feet Cost per square foot:
| $266 |
Monthly Rent Per Square FootMonthly rent divided by the number of square feet. This ratio helps investors compare rental income efficiency across properties, markets, and unit sizes Calculation:Monthly Rent / Square Feet Monthly rent per square foot:
| $1.80 |
Financing Details
Loan AmountThe total sum of money borrowed from a lender to finance a property purchase. Calculation:Purchase Price - Down Payment
Loan amount:
| $519,920 |
|---|---|
Loan to Value Ratio (LTV)Loan amount divided by the market value of the property. Calculation:Loan Amount / Market Value
Loan to value ratio:
| 80.0% |
Loan TypeThe type of loan (e.g., fixed, adjustable).
Loan type:
| Amortizing |
TermThe loan repayment period in years.
Term:
| 30 years |
Interest RateThe percentage a lender charges on the borrowed amount of a loan, determining the cost of borrowing money.
Interest rate:
| 6.625% |
Principal & Interest (PI)The principal is the portion of the loan payment that reduces the loan balance. The interest is the lender's charge for borrowing money. Calculation:(P * r * (1 + r) ** n) / ((1 + r) ** n - 1) Where:
P = Loan amount (principal)
Principal & interest:
| $3,329 |
Property TaxesAnnual taxes levied by local governments on real estate properties. These taxes fund public services like schools, roads, and emergency services.
Property tax:
| $686 |
InsuranceThe costs for insurance coverage to protect against financial losses due to risks like fire, natural disasters, theft, liability, or tenant-related damages. Calculation:Assumes 7% of gross rental income, unless insurance rates are specified.
Insurance:
| $308 |
Private Mortgage Insurance (PMI)A fee that borrowers pay when they take out a conventional loan with a loan-to-value (LTV) ratio above 80%.
Private mortgage insurance (PMI):
| $0 |
Monthly PaymentThe fixed amount a borrower pays each month to repay a loan. It typically includes principal and interest (P&I) and may also cover property taxes, insurance, HOA fees, and PMI if escrowed. Monthly payment:
| $4,323 |
Operating Income
| % Rent | Monthly | Yearly | |
|---|---|---|---|
Gross RentThe total rental income received from tenants before deducting any expenses. Includes base rent, late fees, pet fees, parking fees, and other recurring charges.
Gross rent:
| $4,400 | $52,800 | |
Vacancy LossExpected loss of rent due to vacancies.
Vacancy loss:
(6%)
| 6% | -$264 | -$3,168 |
Operating IncomeGross rental income minus vacancy loss. Calculation:Gross rent - Vacancy loss
Operating income:
| $4,136 | $49,632 |
Operating Expenses
| % Rent | Monthly | Yearly | |
|---|---|---|---|
Property TaxesAnnual taxes levied by local governments on real estate properties. These taxes fund public services like schools, roads, and emergency services. | 16% | -$686 | -$8,226 |
InsuranceThe costs for insurance coverage to protect against financial losses due to risks like fire, natural disasters, theft, liability, or tenant-related damages. Calculation:Assumes 7% of gross rental income, unless insurance rates are specified. | 7% | -$308 | -$3,696 |
Property ManagementThe costs associated with hiring a property manager to handle the day-to-day operations of a rental property. Includes management fees, leasing fes, eviction fees, etc. Calculation:Assumes 8% of gross rental income. | 8% | -$352 | -$4,224 |
Repairs & MaintenanceOngoing costs for routine upkeep and minor fixes needed to keep a property in good working condition. Calculation:Assumes 5% of gross rental income. Varies by property age and condition. | 5% | -$220 | -$2,640 |
Capital ExpensesLarge, infrequent costs for major improvements or replacements, like a new roof, HVAC system, or appliances. Calculation:Assumes 5% of gross rental income. Varies by property age. | 5% | -$220 | -$2,640 |
HOA FeesRegular dues paid to a Homeowners Association for community maintenance, amenities, and management. Similar fees include: Condo Association Fees, Co-op Maintenance Fees, etc. | 10% | -$455 | -$5,460 |
Operating ExpensesRecurring costs required to maintain and manage a rental property, including property taxes, insurance, maintenance, repairs, utilities (if paid by the owner), property management fees, and other day-to-day expenses. Calculation:Insurance + Property Taxes + Property Management + Repairs & Maintenance + Capital Expenditures + HOA Fees | 51% | -$2,241 | -$26,886 |
Cash Flow
| Monthly | Yearly | |
|---|---|---|
Net Operating Income (NOI)The income generated from a property after deducting all operating expenses but before deducting mortgage payments, taxes, and capital expenditures. Calculation:Gross Operating Income - Operating Expenses
Net operating income:
| $1,895 | $22,740 |
Mortgage PaymentThe fixed amount a borrower pays each month to repay a loan. It typically includes principal and interest (P&I) and may also cover property taxes, insurance, HOA fees, and PMI if escrowed. | -$3,329 | -$39,948 |
Cash FlowNet Operating Income (NOI) minus mortgage payments. Calculation:NOI - Mortgage Payments | $1,434 | $17,208 |