
$600,000
Investment Summary
- Monthly Cash Flow
- -$1,689
- Cap Rate
- 2.9%
- Cash-on-Cash Return
- -14.7%
- Debt Coverage Ratio
- 0.46
- Internal Rate of Return (5 years)
- -10.2%
Cash Flow
Net Operating Income (NOI) minus mortgage payments.
Calculation:
NOI - Mortgage Payments
Cap Rate (Market Value)
Capitalization Rate is a rate of return that compares the yearly Net Operating Income (NOI) to the market value.
Calculation:
NOI / Market Value
Cash-on-Cash Return (CoC)
Annual Cash Flow / Cash Invested
Calculation:
Annual cash flow divided by initial cash invested.
Debt Coverage Ratio (DCR)
Net Operating Income (NOI) divided by total debt payments.
Calculation:
NOI / Total Debt Payments
Internal Rate of Return (IRR)
A metric for assessing profitability over time. IRR is the discount rate at which the net present value (NPV) of all future cash flows (positive and negative) from an investment equals zero — including both periodic cash flow (such as rent) and a projected sale at the end of the holding period. It represents the expected annualized return, accounting for income, expenses, and the recovery of capital through a future sale.
Property Description
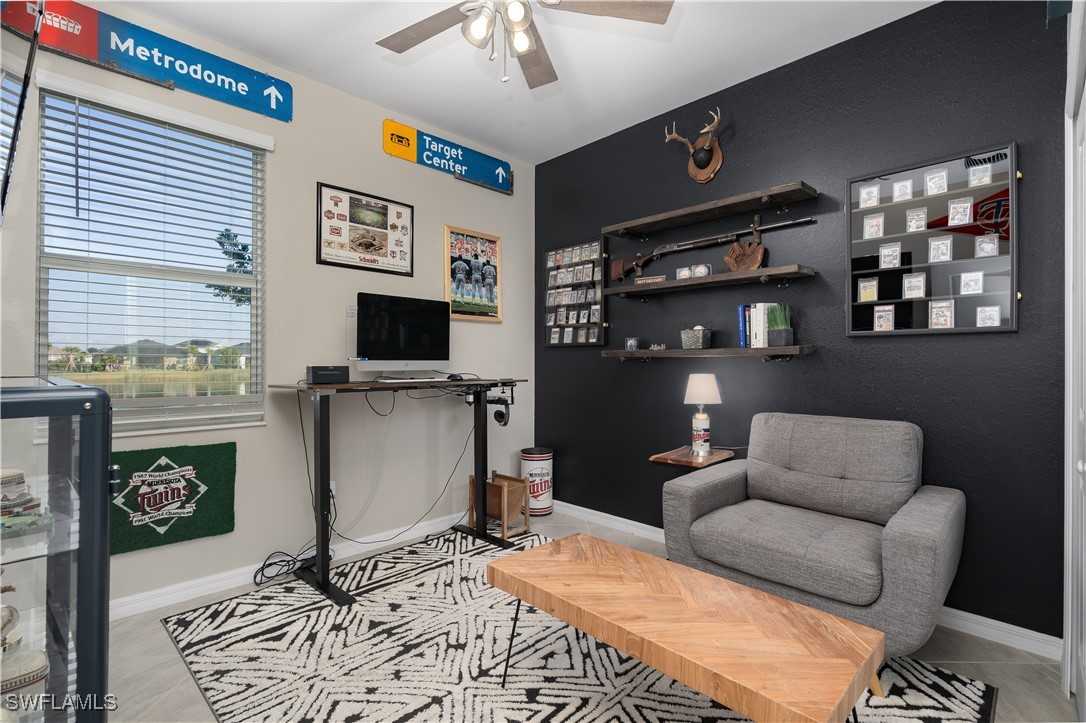
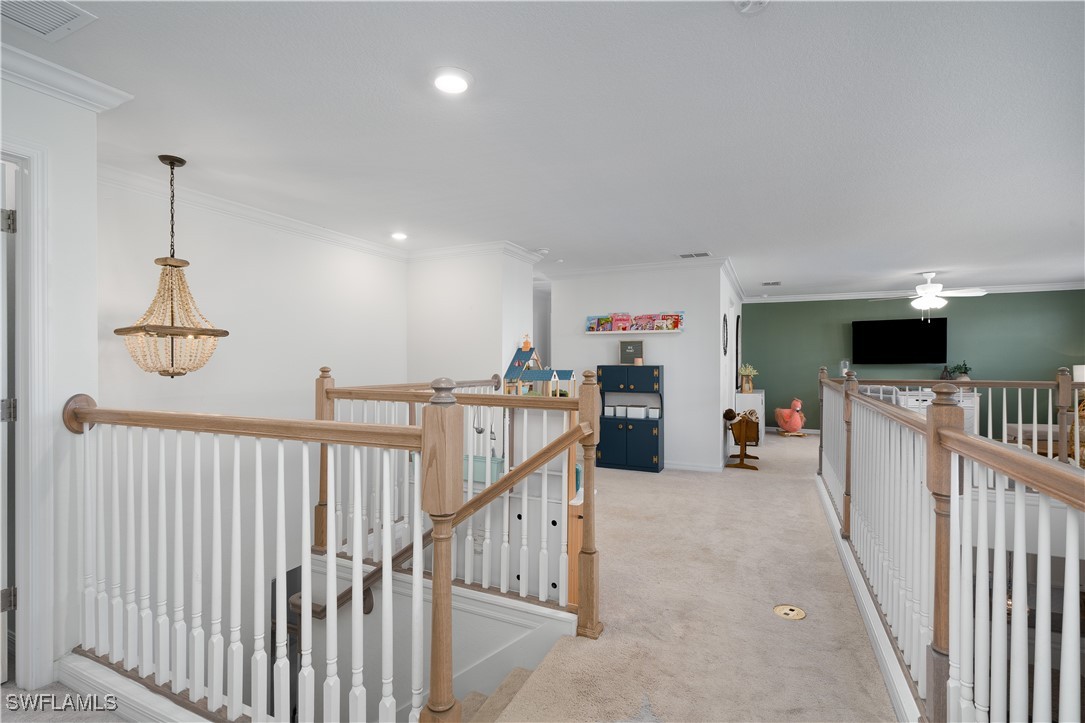
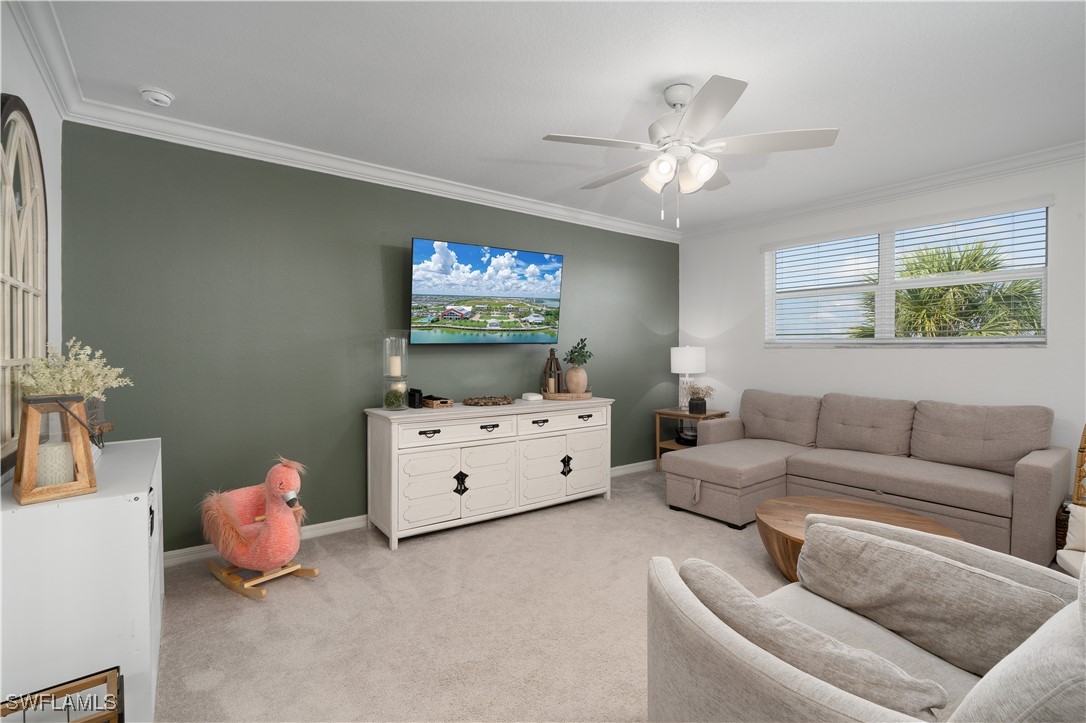
***Seller offering a 1-Year Interest Rate Buydown for qualified buyers on this Stunning Majestica model home in Babcock Ranch! Enjoy lower monthly mortgage payments for the first 12 months, saving you hundreds each month. This seller incentive creates an affordable entry point in today’s market without sacrificing home value. LOW HOA fees in Trails Edge too. Experience the WOW factor the moment you step into this breathtaking 5-bedroom, 4.5-bathroom, 3,283 sq. ft. home! With soaring 18-ft ceilings in the great room, this home is designed to impress. Thoughtfully upgraded with a herringbone tile kitchen backsplash, a custom-designed pantry, and a Pinterest-inspired laundry room, this home blends style with function. Cozy up by the shiplap fireplace, complete with built-in shelves and cabinets, adding charm and character to your living space. Located in a family-friendly neighborhood, this home is surrounded by community schools, multiple parks, and miles of sidewalks perfect for bike rides. Babcock Ranch is golf cart friendly community, making having your own golf cart perfect for cruising the neighborhood or heading to one of Babcock's community pools, taking the kids to one of our new and amazing parks, to play a game of pickleball/tennis, to the skatepark, Publix, farmers market, Starbucks, Food Trucks, and so much more! Babcock Ranch continues to grow year over year. With many exciting new shopping and dining options coming in 2025, this home truly would make an excellent investment. Recognized on 60 Minutes for its hurricane resilience, Babcock Ranch is situated 30 miles inland and 30 feet above sea level, meaning LOW insurance costs and NO Flood insurance required! Additional Home and Community Highlights: Tons of storage & closet space, Plenty of room to add a pool and the outdoor oasis of your dreams, Two Resort Style heated community pools for year-round relaxation, shaded Cabanas, BBQ grills and gas fireplaces, perfect for hosting poolside get-togethers with friends and family, new 3.5-mile linear park system with splash pad play areas for kids, a fishing lagoon, covered basketball courts, treehouse-themed playground, explorers park, and even and outdoor fitness space to get in an outdoor workout! Babcock Ranch also has fabulous dog parks for your furry friends to run and play too. Now is your chance to own this incredible home in America’s first solar-powered town! Call today to schedule your private tour.
Build Your Team
Quickly find investor-friendly professionals who can help you succeed in real estate investing at any stage of the investing journey.


Agents
Match with investor-friendly agents who can help you find, analyze, and close your next deal


Lenders
Get the best funding…find investor-friendly lenders who specialize in your deal strategy


Property Managers
Transition to passive investing. Find a trusted property management partnership that lasts.


Tax Pros & Accountants
Taxes and financial reporting made easy—find experts to create tax savings strategies, file taxes, and more
Location
Property Details
Parking
- Description: Attached, Driveway, Garage, Paved, ElectricVehicleChargingStations, GarageDoorOpener
- Details: Attached, Driveway, Garage, Paved, Electric Vehicle Charging Station(s), Garage Door Opener
- Garage Spaces: 3
- Spaces Total: 0
Bedroom Information
- # of Bedrooms: 5
Bathroom Information
- # of Baths (Full): 4
- # of Baths (Partial): 1
- # of Baths (Total): 5.0
Interior Features
- # of Rooms: 8
- # of Stories: 2
- Fireplace: Yes
Exterior Features
- Exterior Walls Materials: Composition/Composite
- Roof Material: Shingle
- Pool Community: Yes
HOA
- Has HOA: Yes
- HOA Fee: $888/quarterly
Land Information
- Land Use: Residential
- Land Use Subtype: Single Family Residential
Lot Information
- Parcel ID: 422632235016
- Lot Size: 0 sqft
Property Information
- Property Type: Single Family Residence
- Style: Two Story
- Year Built: 2022
Tax Information
- Annual Tax: $8,936
Utilities
- Water & Sewer: Public
- Heating: Central, Electric
- Cooling: Central Air, Ceiling Fan(s), Electric
Location
- County: Charlotte
Listing Details
Investment Summary
- Monthly Cash Flow
- -$1,689
- Cap Rate
- 2.9%
- Cash-on-Cash Return
- -14.7%
- Debt Coverage Ratio
- 0.46
- Internal Rate of Return (5 years)
- -10.2%
Cash Flow
Net Operating Income (NOI) minus mortgage payments.
Calculation:
NOI - Mortgage Payments
Cap Rate (Market Value)
Capitalization Rate is a rate of return that compares the yearly Net Operating Income (NOI) to the market value.
Calculation:
NOI / Market Value
Cash-on-Cash Return (CoC)
Annual Cash Flow / Cash Invested
Calculation:
Annual cash flow divided by initial cash invested.
Debt Coverage Ratio (DCR)
Net Operating Income (NOI) divided by total debt payments.
Calculation:
NOI / Total Debt Payments
Internal Rate of Return (IRR)
A metric for assessing profitability over time. IRR is the discount rate at which the net present value (NPV) of all future cash flows (positive and negative) from an investment equals zero — including both periodic cash flow (such as rent) and a projected sale at the end of the holding period. It represents the expected annualized return, accounting for income, expenses, and the recovery of capital through a future sale.
Purchase Details
Purchase PriceThe price paid for the property. Purchase price:
| $600,000 |
|---|---|
Amount FinancedThe amount of the purchase financed through a loan. Amount financed:
| -$480,000 |
Down paymentThe initial payment made towards the purchase. Down payment:
| $120,000 |
Closing CostsFees and expenses associated with purchasing a property, typically ranging from 2% to 5% of the home’s purchase price, paid at the end of a home purchase to cover services like lending, title transfer, and taxes. Closing costs:
| $18,000 |
Rehab CostsCosts incurred to repair or improve the property, including: roof, flooring, exterior siding, kitchen, exterior paint, bathrooms, etc. Rehab costs:
| $0 |
Initial Cash InvestedThe total initial cash invested in the property. Calculation:Down payment + Buying costs + Rehab costs Initial cash invested:
| $138,000 |
Square Feet (SQFT)The total square footage of the property. Square feet:
| 3,283 |
Cost Per Square FootCost per square foot of the property. Calculation:Purchase Price / Square Feet Cost per square foot:
| $183 |
Monthly Rent Per Square FootMonthly rent divided by the number of square feet. This ratio helps investors compare rental income efficiency across properties, markets, and unit sizes Calculation:Monthly Rent / Square Feet Monthly rent per square foot:
| $1.10 |
Financing Details
Loan AmountThe total sum of money borrowed from a lender to finance a property purchase. Calculation:Purchase Price - Down Payment
Loan amount:
| $480,000 |
|---|---|
Loan to Value Ratio (LTV)Loan amount divided by the market value of the property. Calculation:Loan Amount / Market Value
Loan to value ratio:
| 80.0% |
Loan TypeThe type of loan (e.g., fixed, adjustable).
Loan type:
| Amortizing |
TermThe loan repayment period in years.
Term:
| 30 years |
Interest RateThe percentage a lender charges on the borrowed amount of a loan, determining the cost of borrowing money.
Interest rate:
| 6.810% |
Principal & Interest (PI)The principal is the portion of the loan payment that reduces the loan balance. The interest is the lender's charge for borrowing money. Calculation:(P * r * (1 + r) ** n) / ((1 + r) ** n - 1) Where:
P = Loan amount (principal)
Principal & interest:
| $3,132 |
Property TaxesAnnual taxes levied by local governments on real estate properties. These taxes fund public services like schools, roads, and emergency services.
Property tax:
| $745 |
InsuranceThe costs for insurance coverage to protect against financial losses due to risks like fire, natural disasters, theft, liability, or tenant-related damages. Calculation:Assumes 7% of gross rental income, unless insurance rates are specified.
Insurance:
| $252 |
Private Mortgage Insurance (PMI)A fee that borrowers pay when they take out a conventional loan with a loan-to-value (LTV) ratio above 80%.
Private mortgage insurance (PMI):
| $0 |
Monthly PaymentThe fixed amount a borrower pays each month to repay a loan. It typically includes principal and interest (P&I) and may also cover property taxes, insurance, HOA fees, and PMI if escrowed. Monthly payment:
| $4,129 |
Operating Income
| % Rent | Monthly | Yearly | |
|---|---|---|---|
Gross RentThe total rental income received from tenants before deducting any expenses. Includes base rent, late fees, pet fees, parking fees, and other recurring charges.
Gross rent:
| $3,600 | $43,200 | |
Vacancy LossExpected loss of rent due to vacancies.
Vacancy loss:
(6%)
| 6% | -$216 | -$2,592 |
Operating IncomeGross rental income minus vacancy loss. Calculation:Gross rent - Vacancy loss
Operating income:
| $3,384 | $40,608 |
Operating Expenses
| % Rent | Monthly | Yearly | |
|---|---|---|---|
Property TaxesAnnual taxes levied by local governments on real estate properties. These taxes fund public services like schools, roads, and emergency services. | 21% | -$745 | -$8,936 |
InsuranceThe costs for insurance coverage to protect against financial losses due to risks like fire, natural disasters, theft, liability, or tenant-related damages. Calculation:Assumes 7% of gross rental income, unless insurance rates are specified. | 7% | -$252 | -$3,024 |
Property ManagementThe costs associated with hiring a property manager to handle the day-to-day operations of a rental property. Includes management fees, leasing fes, eviction fees, etc. Calculation:Assumes 8% of gross rental income. | 8% | -$288 | -$3,456 |
Repairs & MaintenanceOngoing costs for routine upkeep and minor fixes needed to keep a property in good working condition. Calculation:Assumes 5% of gross rental income. Varies by property age and condition. | 5% | -$180 | -$2,160 |
Capital ExpensesLarge, infrequent costs for major improvements or replacements, like a new roof, HVAC system, or appliances. Calculation:Assumes 5% of gross rental income. Varies by property age. | 5% | -$180 | -$2,160 |
HOA FeesRegular dues paid to a Homeowners Association for community maintenance, amenities, and management. Similar fees include: Condo Association Fees, Co-op Maintenance Fees, etc. | 8% | -$296 | -$3,552 |
Operating ExpensesRecurring costs required to maintain and manage a rental property, including property taxes, insurance, maintenance, repairs, utilities (if paid by the owner), property management fees, and other day-to-day expenses. Calculation:Insurance + Property Taxes + Property Management + Repairs & Maintenance + Capital Expenditures + HOA Fees | 54% | -$1,941 | -$23,288 |
Cash Flow
| Monthly | Yearly | |
|---|---|---|
Net Operating Income (NOI)The income generated from a property after deducting all operating expenses but before deducting mortgage payments, taxes, and capital expenditures. Calculation:Gross Operating Income - Operating Expenses
Net operating income:
| $1,443 | $17,316 |
Mortgage PaymentThe fixed amount a borrower pays each month to repay a loan. It typically includes principal and interest (P&I) and may also cover property taxes, insurance, HOA fees, and PMI if escrowed. | -$3,132 | -$37,584 |
Cash FlowNet Operating Income (NOI) minus mortgage payments. Calculation:NOI - Mortgage Payments | $1,689 | $20,268 |