$524,900
Investment Summary
- Monthly Cash Flow
- -$950
- Cap Rate
- 4.0%
- Cash-on-Cash Return
- -9.4%
- Debt Coverage Ratio
- 0.65
- Internal Rate of Return (5 years)
- -5.1%
Cash Flow
Net Operating Income (NOI) minus mortgage payments.
Calculation:
NOI - Mortgage Payments
Cap Rate (Market Value)
Capitalization Rate is a rate of return that compares the yearly Net Operating Income (NOI) to the market value.
Calculation:
NOI / Market Value
Cash-on-Cash Return (CoC)
Annual Cash Flow / Cash Invested
Calculation:
Annual cash flow divided by initial cash invested.
Debt Coverage Ratio (DCR)
Net Operating Income (NOI) divided by total debt payments.
Calculation:
NOI / Total Debt Payments
Internal Rate of Return (IRR)
A metric for assessing profitability over time. IRR is the discount rate at which the net present value (NPV) of all future cash flows (positive and negative) from an investment equals zero — including both periodic cash flow (such as rent) and a projected sale at the end of the holding period. It represents the expected annualized return, accounting for income, expenses, and the recovery of capital through a future sale.
Property Description
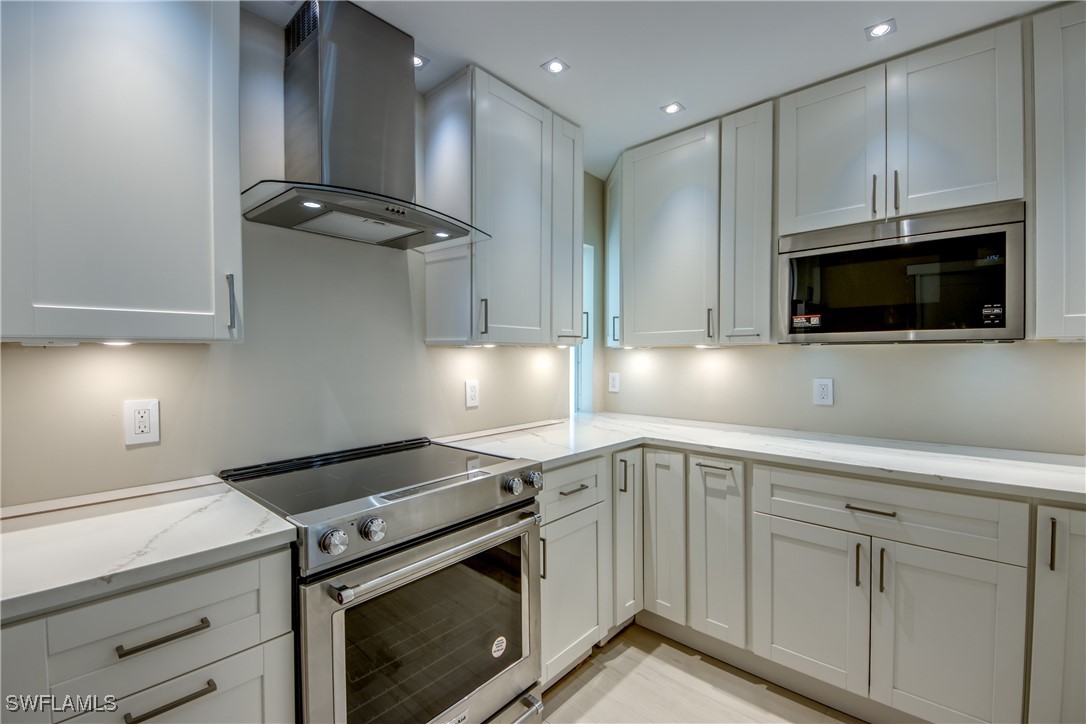
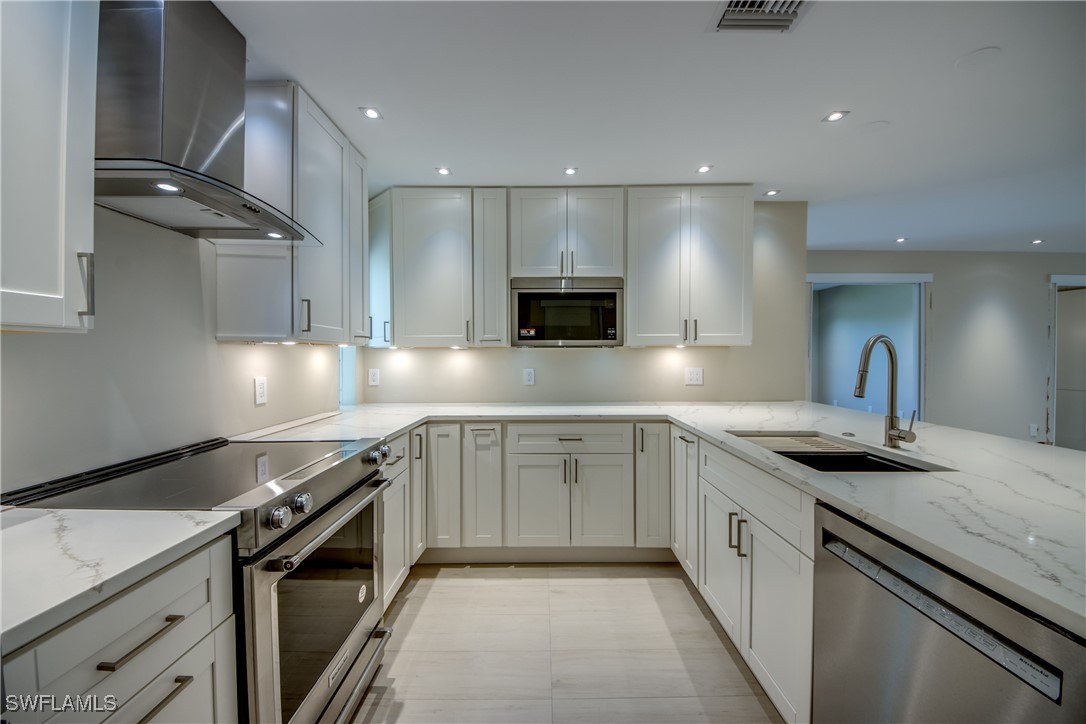
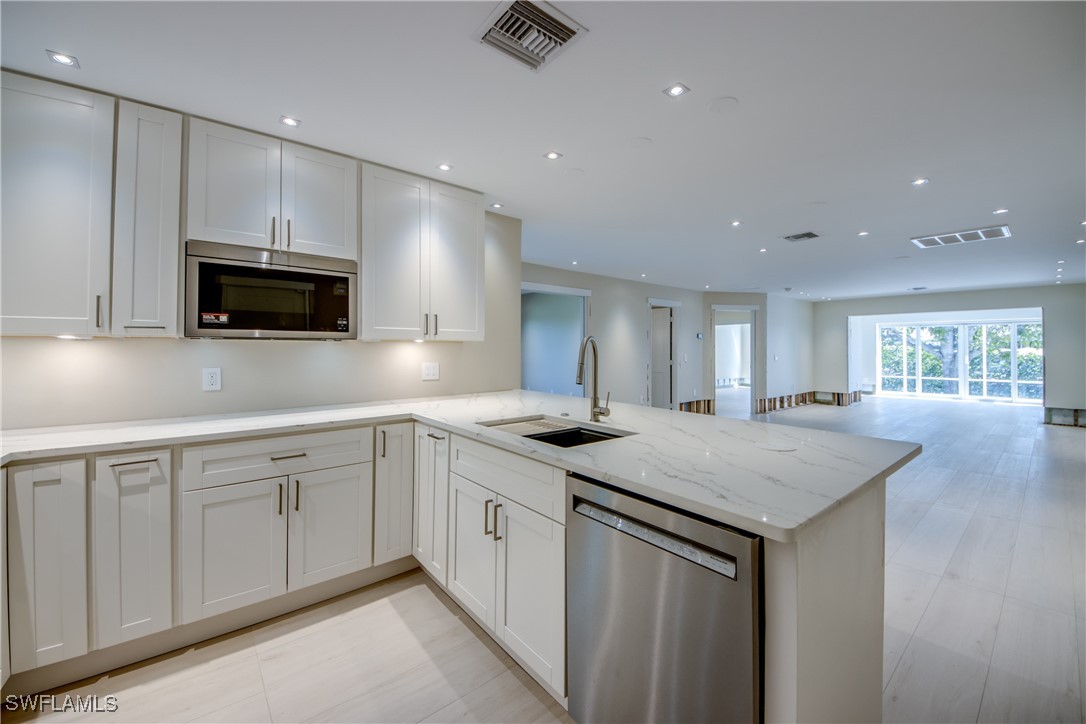
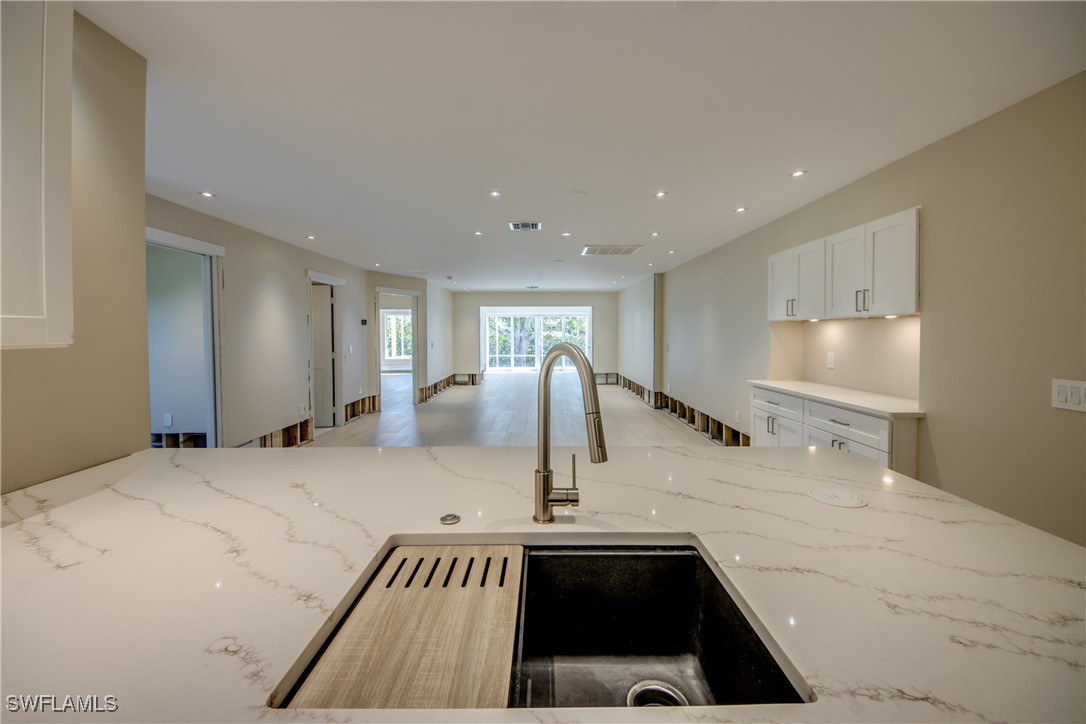
COASTAL LIVING MEETS SMART INVESTING! An abundance of elegance, a splash of potential, and a location that does the talking… You won’t believe how close this OPPORTUNITY gets you to Fort Myers Beach—at a price that’s almost TOO GOOD TO BE TRUE! Located on a wide 100’ sailboat-access, saltwater canal, this waterfront gem is just minutes from the back bay waters of Fort Myers Beach by boat or car. Whether dreaming of sandy toes or sunset cruises, this address delivers BIG on LIFESTYLE without the luxury price tag. Enjoy early 1,800 square feet of smartly designed living space—no wasted area here! You’ll find three bedrooms, two stylishly renovated bathrooms, a versatile den and a one-car garage. The seller has already invested in high-end upgrades and finishes, leaving just a little more to finish—and we’ve got a solid quote under $20K to wrap it all up (attached to MLS). Your GOLDEN OPPORTUNITY. Step into a show-stopping kitchen that’s as functional as it is fabulous. We’re talking soft-close shaker cabinets, luxurious Quartz counters, pull-out spice racks and drawers, wine cooler, trash roll-out, pop-up charging station and a gourmet sink with built-in strainer. Add in a top-of-the-line appliance package featuring a four-door fridge, steam bake oven, convection features, and a high-tech microwave and you’re cooking with style. The bathrooms are equally impressive—especially the guest bath, where a wall of granite doubles as a piece of art. Throughout the home, you’ll find thoughtful recessed lighting, all tile flooring, premium finishes and updates that matter: dimensional shingle roof (2023), HVAC (2023), updated electrica (2023), fresh paint inside and out and impact glass windows and doors for peace of mind. Pocketing sliders from the great room lead to your expansive lanai, the perfect spot to add a jacuzzi and unwind and take in the waterfront view. And yes—the oversized composite dock is already in place, ready for your boat, your fishing pole, or your morning coffee. Your dock isn’t just a place to tie up a boat—it’s your front-row seat to nature’s daily performance, featuring playful dolphins, curious manatees, acrobatic fish and a vibrant cast of coastal birds. They all LOVE TO PLAY at the beach too! RV? Boat? Trailer? Bring them all—this part of Lee County is boat and RV friendly, so bring your toys. With an oversized circle driveway, RV pad and 30 AMP hook up there’s plenty of room for it all. The seller has transferrable flood insurance if desired. Affordable Gulf-access living this close to Fort Myers Beach? You better believe it! Come see what smart investing—and a little sweat equity—can do for your future. Here, you’ll discover endless possibilities—whether you’re seeking a full-time residence, a winter escape or the perfect vacation rental investment. Southwest Florida’s best location—just minutes from world-class beaches and dining, renowned fishing destinations and the convenience of Southwest Florida International Airport.
Build Your Team
Quickly find investor-friendly professionals who can help you succeed in real estate investing at any stage of the investing journey.


Agents
Match with investor-friendly agents who can help you find, analyze, and close your next deal


Lenders
Get the best funding…find investor-friendly lenders who specialize in your deal strategy


Property Managers
Transition to passive investing. Find a trusted property management partnership that lasts.


Tax Pros & Accountants
Taxes and financial reporting made easy—find experts to create tax savings strategies, file taxes, and more
Location
Property Details
Parking
- Description: Garage
- Details: Attached, Circular Driveway, Garage, RV Access/Parking
- Garage Spaces: 1
- Spaces Total: 0
Bedroom Information
- # of Bedrooms: 3
Bathroom Information
- # of Baths (Full): 2
- # of Baths (Partial): 1
- # of Baths (Total): 2.0
Interior Features
- # of Stories: 1
Exterior Features
- Exterior Walls Materials: Stucco
- Roof Type: Gable
- Roof Material: Shingle
Land Information
- Land Use: Residential
- Land Use Subtype: Single Family Residential
Lot Information
- Parcel ID: 0746240300000.0020
- Lot Size: 0 sqft
Property Information
- Property Type: Single Family Residence
- Style: Ranch, One Story
- Year Built: 1972
Tax Information
- Annual Tax: $5,633
Utilities
- Water & Sewer: Public
- Heating: Central, Electric
- Cooling: Central Air, Electric
Location
- County: Lee
Listing Details
Investment Summary
- Monthly Cash Flow
- -$950
- Cap Rate
- 4.0%
- Cash-on-Cash Return
- -9.4%
- Debt Coverage Ratio
- 0.65
- Internal Rate of Return (5 years)
- -5.1%
Cash Flow
Net Operating Income (NOI) minus mortgage payments.
Calculation:
NOI - Mortgage Payments
Cap Rate (Market Value)
Capitalization Rate is a rate of return that compares the yearly Net Operating Income (NOI) to the market value.
Calculation:
NOI / Market Value
Cash-on-Cash Return (CoC)
Annual Cash Flow / Cash Invested
Calculation:
Annual cash flow divided by initial cash invested.
Debt Coverage Ratio (DCR)
Net Operating Income (NOI) divided by total debt payments.
Calculation:
NOI / Total Debt Payments
Internal Rate of Return (IRR)
A metric for assessing profitability over time. IRR is the discount rate at which the net present value (NPV) of all future cash flows (positive and negative) from an investment equals zero — including both periodic cash flow (such as rent) and a projected sale at the end of the holding period. It represents the expected annualized return, accounting for income, expenses, and the recovery of capital through a future sale.
Purchase Details
Purchase PriceThe price paid for the property. Purchase price:
| $524,900 |
|---|---|
Amount FinancedThe amount of the purchase financed through a loan. Amount financed:
| -$419,920 |
Down paymentThe initial payment made towards the purchase. Down payment:
| $104,980 |
Closing CostsFees and expenses associated with purchasing a property, typically ranging from 2% to 5% of the home’s purchase price, paid at the end of a home purchase to cover services like lending, title transfer, and taxes. Closing costs:
| $15,747 |
Rehab CostsCosts incurred to repair or improve the property, including: roof, flooring, exterior siding, kitchen, exterior paint, bathrooms, etc. Rehab costs:
| $0 |
Initial Cash InvestedThe total initial cash invested in the property. Calculation:Down payment + Buying costs + Rehab costs Initial cash invested:
| $120,727 |
Square Feet (SQFT)The total square footage of the property. Square feet:
| 1,753 |
Cost Per Square FootCost per square foot of the property. Calculation:Purchase Price / Square Feet Cost per square foot:
| $299 |
Monthly Rent Per Square FootMonthly rent divided by the number of square feet. This ratio helps investors compare rental income efficiency across properties, markets, and unit sizes Calculation:Monthly Rent / Square Feet Monthly rent per square foot:
| $1.83 |
Financing Details
Loan AmountThe total sum of money borrowed from a lender to finance a property purchase. Calculation:Purchase Price - Down Payment
Loan amount:
| $419,920 |
|---|---|
Loan to Value Ratio (LTV)Loan amount divided by the market value of the property. Calculation:Loan Amount / Market Value
Loan to value ratio:
| 80.0% |
Loan TypeThe type of loan (e.g., fixed, adjustable).
Loan type:
| Amortizing |
TermThe loan repayment period in years.
Term:
| 30 years |
Interest RateThe percentage a lender charges on the borrowed amount of a loan, determining the cost of borrowing money.
Interest rate:
| 6.625% |
Principal & Interest (PI)The principal is the portion of the loan payment that reduces the loan balance. The interest is the lender's charge for borrowing money. Calculation:(P * r * (1 + r) ** n) / ((1 + r) ** n - 1) Where:
P = Loan amount (principal)
Principal & interest:
| $2,689 |
Property TaxesAnnual taxes levied by local governments on real estate properties. These taxes fund public services like schools, roads, and emergency services.
Property tax:
| $469 |
InsuranceThe costs for insurance coverage to protect against financial losses due to risks like fire, natural disasters, theft, liability, or tenant-related damages. Calculation:Assumes 7% of gross rental income, unless insurance rates are specified.
Insurance:
| $224 |
Private Mortgage Insurance (PMI)A fee that borrowers pay when they take out a conventional loan with a loan-to-value (LTV) ratio above 80%.
Private mortgage insurance (PMI):
| $0 |
Monthly PaymentThe fixed amount a borrower pays each month to repay a loan. It typically includes principal and interest (P&I) and may also cover property taxes, insurance, HOA fees, and PMI if escrowed. Monthly payment:
| $3,382 |
Operating Income
| % Rent | Monthly | Yearly | |
|---|---|---|---|
Gross RentThe total rental income received from tenants before deducting any expenses. Includes base rent, late fees, pet fees, parking fees, and other recurring charges.
Gross rent:
| $3,200 | $38,400 | |
Vacancy LossExpected loss of rent due to vacancies.
Vacancy loss:
(6%)
| 6% | -$192 | -$2,304 |
Operating IncomeGross rental income minus vacancy loss. Calculation:Gross rent - Vacancy loss
Operating income:
| $3,008 | $36,096 |
Operating Expenses
| % Rent | Monthly | Yearly | |
|---|---|---|---|
Property TaxesAnnual taxes levied by local governments on real estate properties. These taxes fund public services like schools, roads, and emergency services. | 15% | -$469 | -$5,633 |
InsuranceThe costs for insurance coverage to protect against financial losses due to risks like fire, natural disasters, theft, liability, or tenant-related damages. Calculation:Assumes 7% of gross rental income, unless insurance rates are specified. | 7% | -$224 | -$2,688 |
Property ManagementThe costs associated with hiring a property manager to handle the day-to-day operations of a rental property. Includes management fees, leasing fes, eviction fees, etc. Calculation:Assumes 8% of gross rental income. | 8% | -$256 | -$3,072 |
Repairs & MaintenanceOngoing costs for routine upkeep and minor fixes needed to keep a property in good working condition. Calculation:Assumes 5% of gross rental income. Varies by property age and condition. | 5% | -$160 | -$1,920 |
Capital ExpensesLarge, infrequent costs for major improvements or replacements, like a new roof, HVAC system, or appliances. Calculation:Assumes 5% of gross rental income. Varies by property age. | 5% | -$160 | -$1,920 |
HOA FeesRegular dues paid to a Homeowners Association for community maintenance, amenities, and management. Similar fees include: Condo Association Fees, Co-op Maintenance Fees, etc. | n/a | n/a | n/a |
Operating ExpensesRecurring costs required to maintain and manage a rental property, including property taxes, insurance, maintenance, repairs, utilities (if paid by the owner), property management fees, and other day-to-day expenses. Calculation:Insurance + Property Taxes + Property Management + Repairs & Maintenance + Capital Expenditures + HOA Fees | 40% | -$1,269 | -$15,233 |
Cash Flow
| Monthly | Yearly | |
|---|---|---|
Net Operating Income (NOI)The income generated from a property after deducting all operating expenses but before deducting mortgage payments, taxes, and capital expenditures. Calculation:Gross Operating Income - Operating Expenses
Net operating income:
| $1,739 | $20,868 |
Mortgage PaymentThe fixed amount a borrower pays each month to repay a loan. It typically includes principal and interest (P&I) and may also cover property taxes, insurance, HOA fees, and PMI if escrowed. | -$2,689 | -$32,268 |
Cash FlowNet Operating Income (NOI) minus mortgage payments. Calculation:NOI - Mortgage Payments | $950 | $11,400 |