
$599,000
Investment Summary
- Monthly Cash Flow
- -$863
- Cap Rate
- 4.6%
- Cash-on-Cash Return
- -7.5%
- Debt Coverage Ratio
- 0.72
- Internal Rate of Return (5 years)
- -3.3%
Cash Flow
Net Operating Income (NOI) minus mortgage payments.
Calculation:
NOI - Mortgage Payments
Cap Rate (Market Value)
Capitalization Rate is a rate of return that compares the yearly Net Operating Income (NOI) to the market value.
Calculation:
NOI / Market Value
Cash-on-Cash Return (CoC)
Annual Cash Flow / Cash Invested
Calculation:
Annual cash flow divided by initial cash invested.
Debt Coverage Ratio (DCR)
Net Operating Income (NOI) divided by total debt payments.
Calculation:
NOI / Total Debt Payments
Internal Rate of Return (IRR)
A metric for assessing profitability over time. IRR is the discount rate at which the net present value (NPV) of all future cash flows (positive and negative) from an investment equals zero — including both periodic cash flow (such as rent) and a projected sale at the end of the holding period. It represents the expected annualized return, accounting for income, expenses, and the recovery of capital through a future sale.
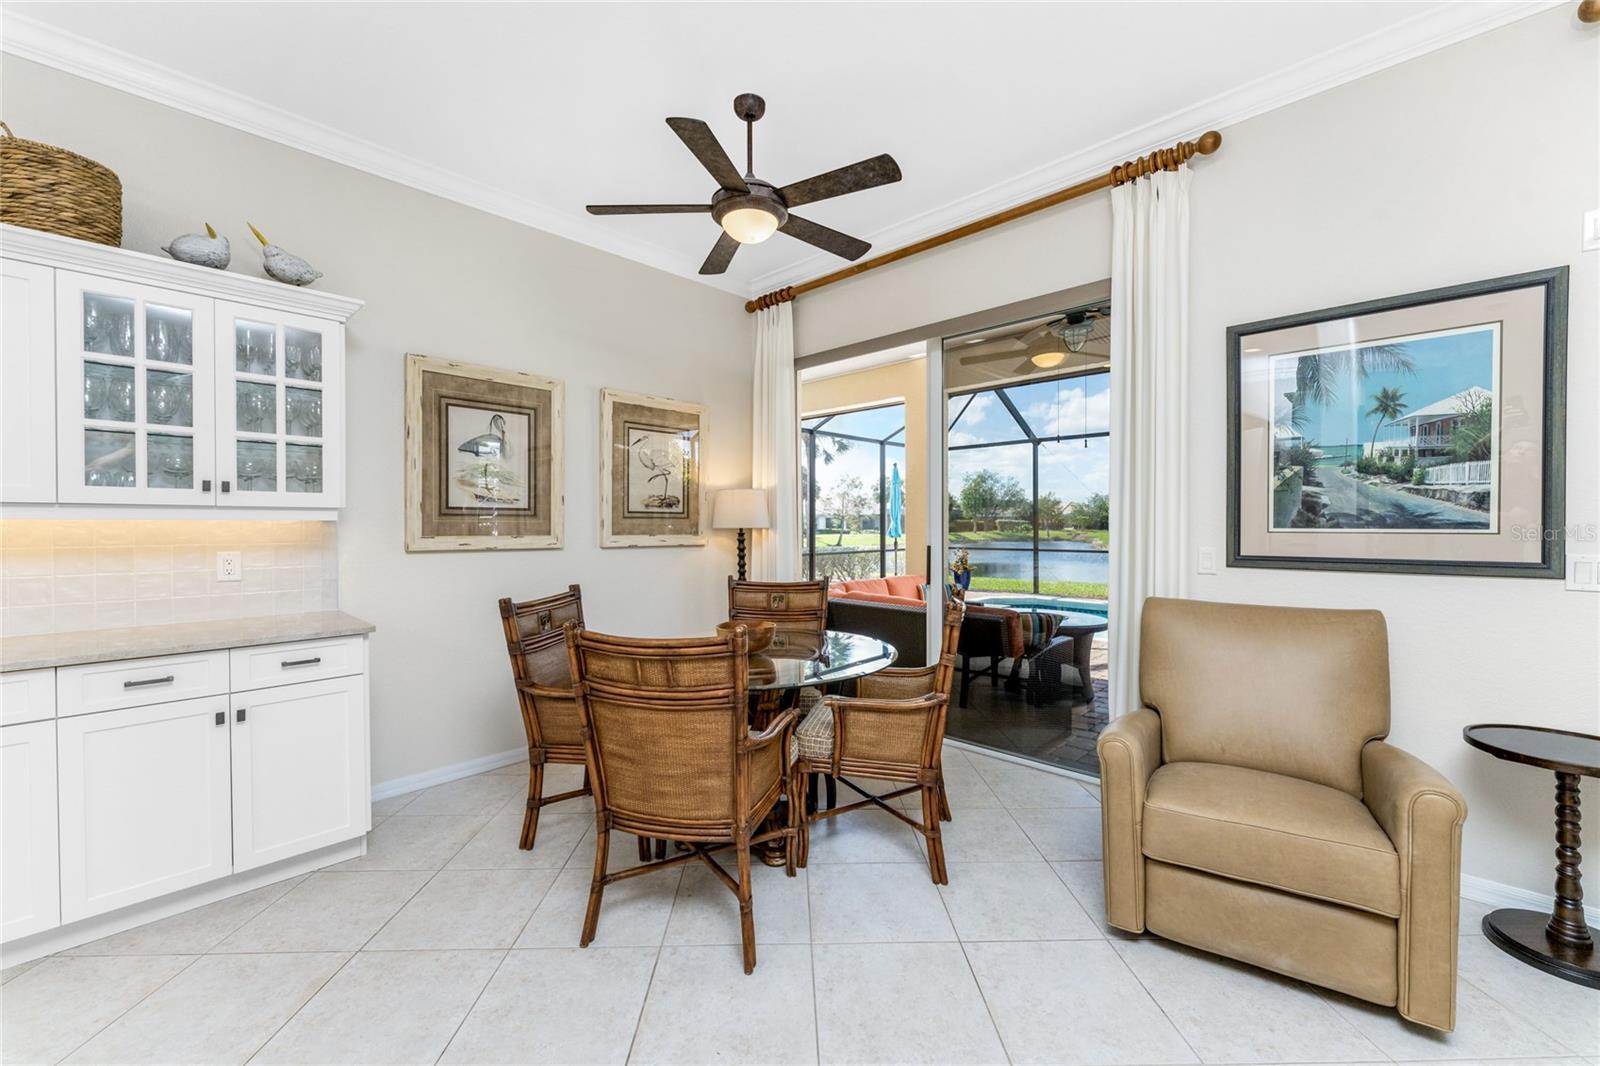
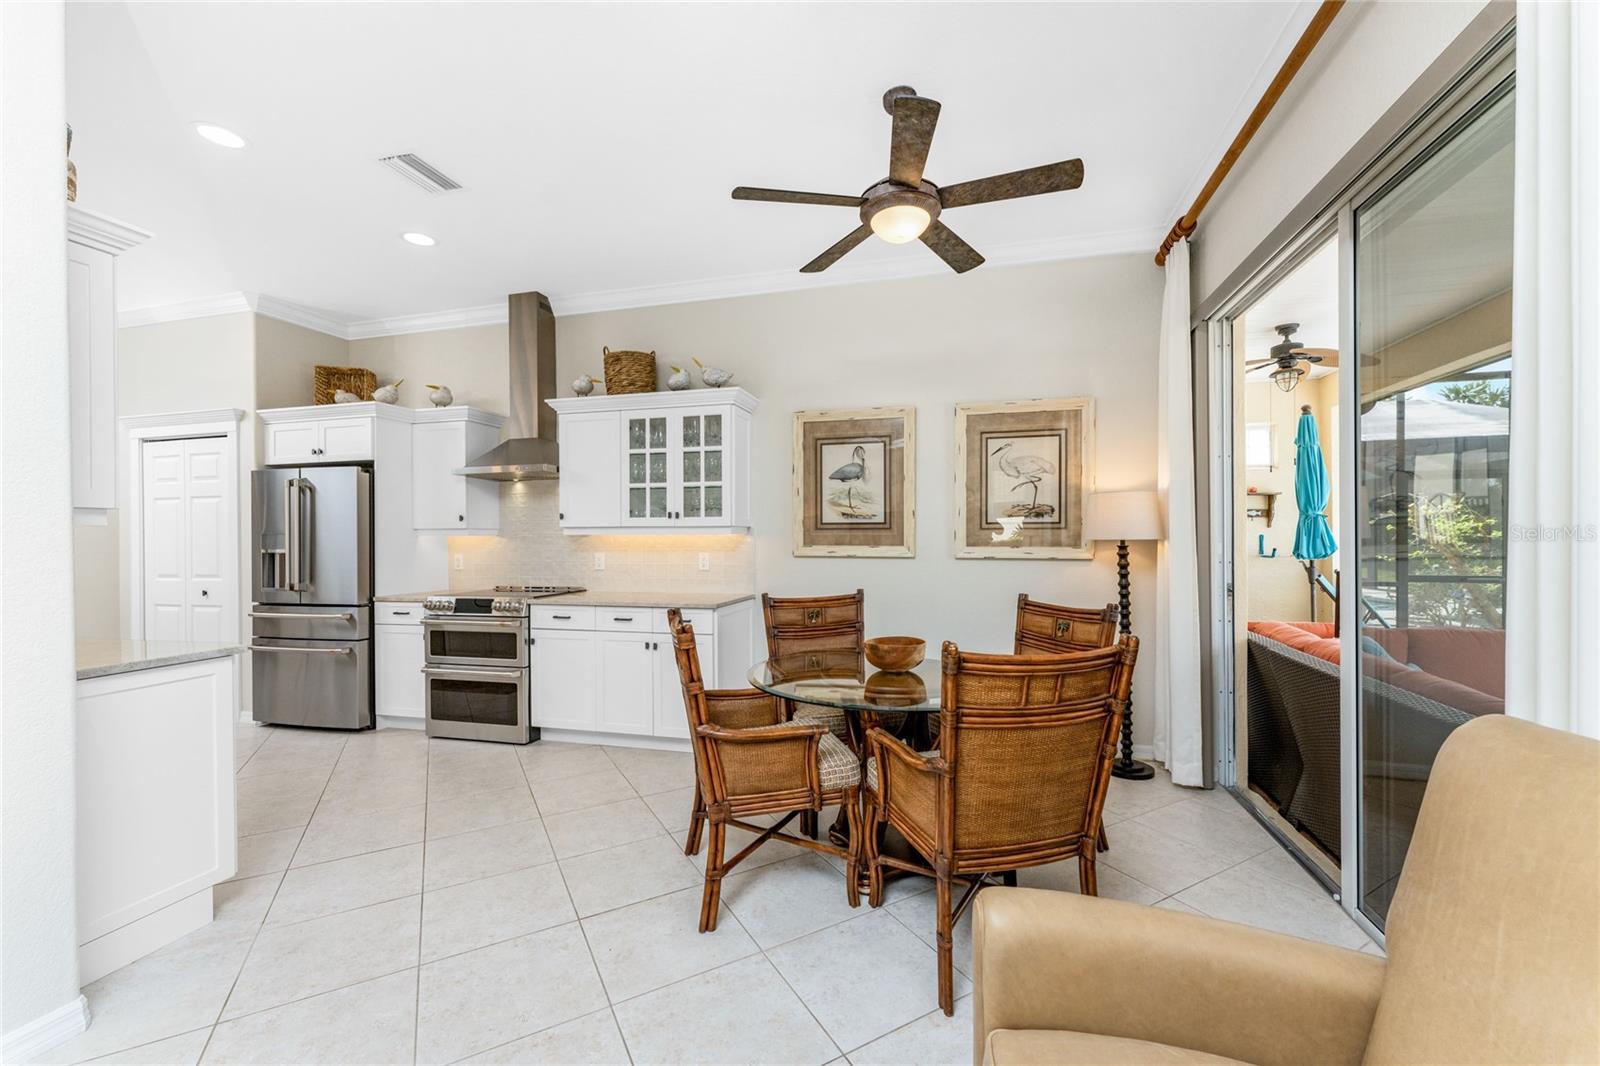
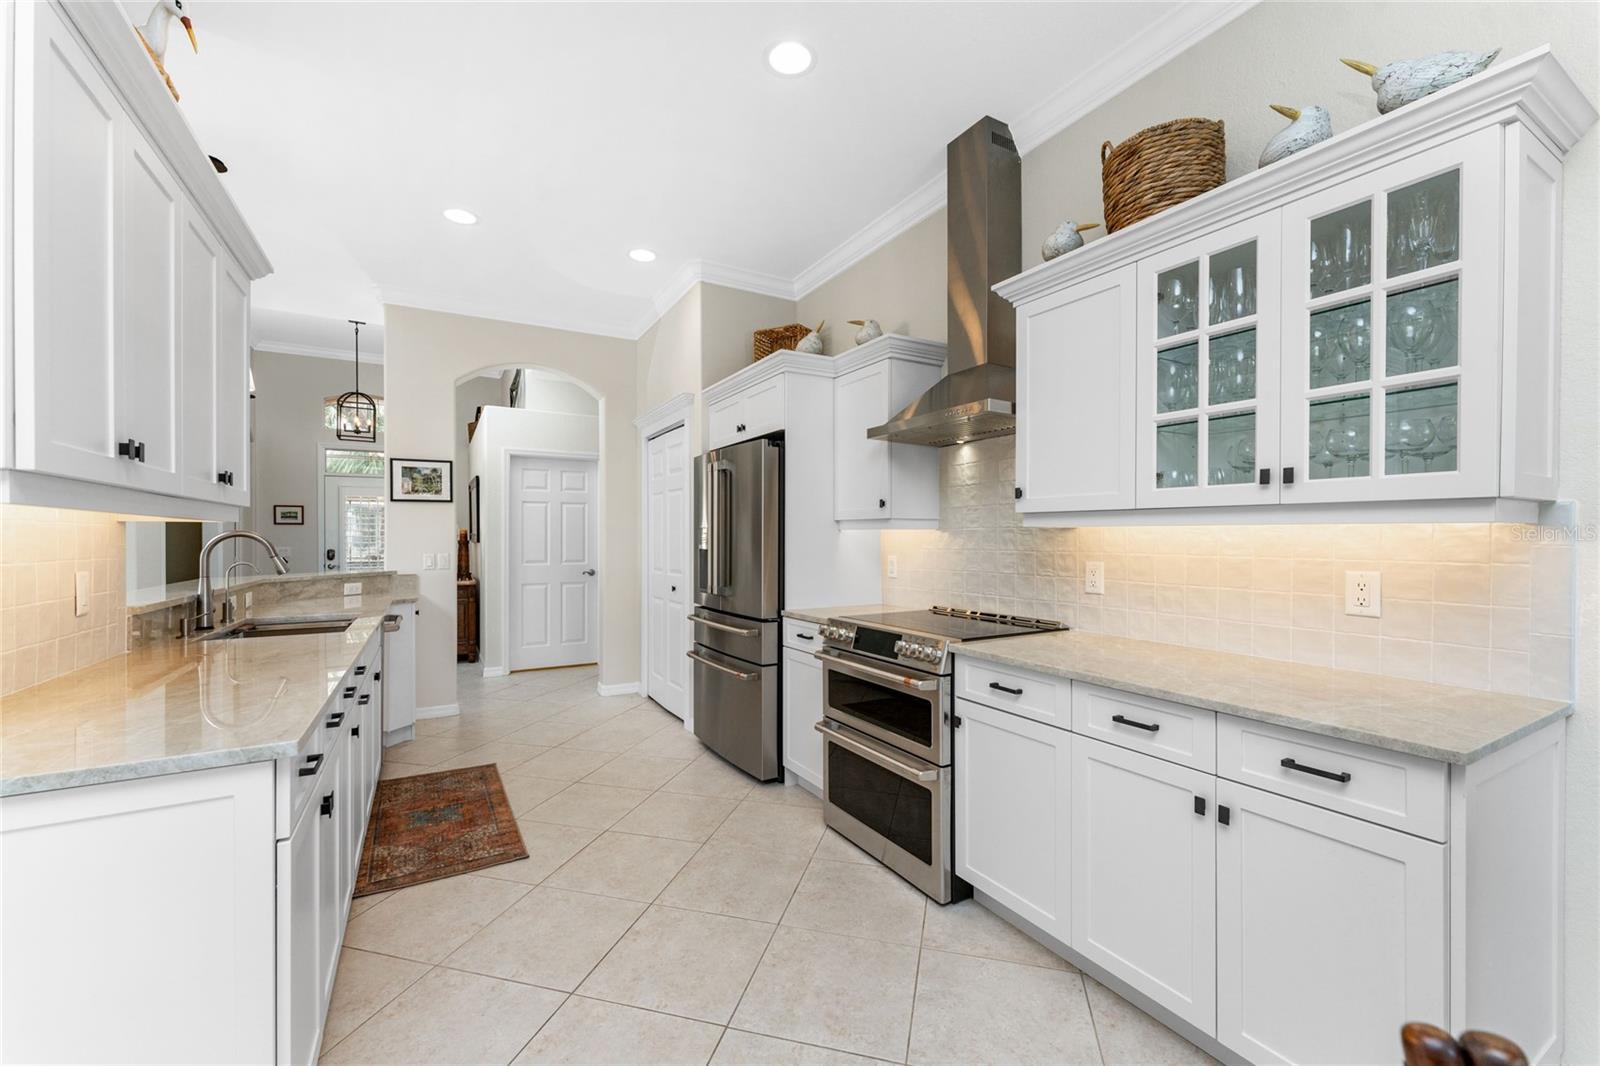
Property Description
No detail has been overlooked in this brilliantly updated lakefront home, located in the coveted neighborhood of Courtside Landings in Burnt Store Marina. Nestled in the heart of the community, this home is just a short walk to Cass Cay waterfront restaurant, the Trading Post, the south marina basin, fitness, pickleball and tennis. As you approach this charming retreat, you are sure to appreciate the paver drive, pleasing landscape and the handsome new roof - installed in 2023. This stunning Lacoste floor plan is being offered partially furnished, so you can move right in and begin living the vibrant Florida lifestyle you’ve been dreaming of! You are sure to be impressed with the striking architecture from the moment you enter the inviting foyer. At the heart of the home, the freshly renovated kitchen showcases impeccable craftsmanship by Cornerstone Builders. Extensive white shaker cabinetry is adorned with Taj Mahal quartzite countertops, zellige tile backsplash, and sleek GE Café stainless steel appliances, including a double oven and induction cooktop with stainless hood…a true chef’s delight! Crisp white cabinetry is accentuated by decorative glass insets, pull out shelving and a handy touch faucet that add sophistication to this stylish space. The main living area exudes refinement, featuring crown molding, diamond-set tile flooring, custom drapery, and plenty of natural light through three sets of sliding doors. Step outside to the expansive paver pool deck, where a large pool with double waterfall, promises endless relaxation and entertainment, all set against the serene backdrop of the lake. The home’s thoughtful layout includes two bedrooms plus a den, providing flexible space for guests or a home office. Your guests will be delighted to stay in the attractive guest suite which enjoys abundant sunshine, laminate flooring and a tasteful bath updated by Cornerstone. The spacious primary suite is a private retreat with tasteful tray ceiling, laminate flooring and pool and pond views framed by sliding doors that lead out to the lanai. Two closets flank the hall leading to the luxurious en-suite bath with dual sinks and a spacious tiled walk-in shower. Full hurricane protection provides peace of mind, including convenient motorized storm screens on the lanai, and an upgraded hurricane grade garage door. Step outside and enjoy easy access to the community’s friendly social and recreational culture. The gated community of Burnt Store Marina boasts a 27-hole golf course, clubhouse with tiki bar, two on-site restaurants, tennis, pickleball, fitness center, and lots of great people! Come for the lifestyle…stay for life!
Build Your Team
Quickly find investor-friendly professionals who can help you succeed in real estate investing at any stage of the investing journey.


Agents
Match with investor-friendly agents who can help you find, analyze, and close your next deal


Lenders
Get the best funding…find investor-friendly lenders who specialize in your deal strategy


Property Managers
Transition to passive investing. Find a trusted property management partnership that lasts.


Tax Pros & Accountants
Taxes and financial reporting made easy—find experts to create tax savings strategies, file taxes, and more
Location
Property Details
Parking
- Description: Driveway, Garage Door Opener, Ground Level
- Details: Driveway, Garage Door Opener, Attached
- Garage Spaces: 2
- Spaces Total: 0
Bedroom Information
- # of Bedrooms: 2
Bathroom Information
- # of Baths (Full): 2
- # of Baths (Total): 2.0
Interior Features
- # of Rooms: 12
- # of Stories: 1
Exterior Features
- Exterior Walls Materials: Stucco
- Foundation: Slab
- Roof Type: IRR/Cathedral
- Roof Material: Tile
- Pool: Yes
HOA
- Has HOA: Yes
- Association: Compass Rose Management/Amy Conte
- Additional Association: Sec 22 Burnt Store Marina
- Additional HOA Fee: $1,065/annually
Land Information
- Land Use: Residential
- Land Use Subtype: Single Family Residential
Lot Information
- Parcel ID: 0643232800000.0410
- Lot Size: 4008 sqft
Property Information
- Property Type: Single Family Residence
- Style: Florida
- Year Built: 2000
Tax Information
- Annual Tax: $3,935
Utilities
- Water & Sewer: Public
- Heating: Central, Electric
- Cooling: Central Air, Humidity Control
Location
- County: Lee
Listing Details
Investment Summary
- Monthly Cash Flow
- -$863
- Cap Rate
- 4.6%
- Cash-on-Cash Return
- -7.5%
- Debt Coverage Ratio
- 0.72
- Internal Rate of Return (5 years)
- -3.3%
Cash Flow
Net Operating Income (NOI) minus mortgage payments.
Calculation:
NOI - Mortgage Payments
Cap Rate (Market Value)
Capitalization Rate is a rate of return that compares the yearly Net Operating Income (NOI) to the market value.
Calculation:
NOI / Market Value
Cash-on-Cash Return (CoC)
Annual Cash Flow / Cash Invested
Calculation:
Annual cash flow divided by initial cash invested.
Debt Coverage Ratio (DCR)
Net Operating Income (NOI) divided by total debt payments.
Calculation:
NOI / Total Debt Payments
Internal Rate of Return (IRR)
A metric for assessing profitability over time. IRR is the discount rate at which the net present value (NPV) of all future cash flows (positive and negative) from an investment equals zero — including both periodic cash flow (such as rent) and a projected sale at the end of the holding period. It represents the expected annualized return, accounting for income, expenses, and the recovery of capital through a future sale.
Purchase Details
Purchase PriceThe price paid for the property. Purchase price:
| $599,000 |
|---|---|
Amount FinancedThe amount of the purchase financed through a loan. Amount financed:
| -$479,200 |
Down paymentThe initial payment made towards the purchase. Down payment:
| $119,800 |
Closing CostsFees and expenses associated with purchasing a property, typically ranging from 2% to 5% of the home’s purchase price, paid at the end of a home purchase to cover services like lending, title transfer, and taxes. Closing costs:
| $17,970 |
Rehab CostsCosts incurred to repair or improve the property, including: roof, flooring, exterior siding, kitchen, exterior paint, bathrooms, etc. Rehab costs:
| $0 |
Initial Cash InvestedThe total initial cash invested in the property. Calculation:Down payment + Buying costs + Rehab costs Initial cash invested:
| $137,770 |
Square Feet (SQFT)The total square footage of the property. Square feet:
| 1,820 |
Cost Per Square FootCost per square foot of the property. Calculation:Purchase Price / Square Feet Cost per square foot:
| $329 |
Monthly Rent Per Square FootMonthly rent divided by the number of square feet. This ratio helps investors compare rental income efficiency across properties, markets, and unit sizes Calculation:Monthly Rent / Square Feet Monthly rent per square foot:
| $2.14 |
Financing Details
Loan AmountThe total sum of money borrowed from a lender to finance a property purchase. Calculation:Purchase Price - Down Payment
Loan amount:
| $479,200 |
|---|---|
Loan to Value Ratio (LTV)Loan amount divided by the market value of the property. Calculation:Loan Amount / Market Value
Loan to value ratio:
| 80.0% |
Loan TypeThe type of loan (e.g., fixed, adjustable).
Loan type:
| Amortizing |
TermThe loan repayment period in years.
Term:
| 30 years |
Interest RateThe percentage a lender charges on the borrowed amount of a loan, determining the cost of borrowing money.
Interest rate:
| 6.840% |
Principal & Interest (PI)The principal is the portion of the loan payment that reduces the loan balance. The interest is the lender's charge for borrowing money. Calculation:(P * r * (1 + r) ** n) / ((1 + r) ** n - 1) Where:
P = Loan amount (principal)
Principal & interest:
| $3,137 |
Property TaxesAnnual taxes levied by local governments on real estate properties. These taxes fund public services like schools, roads, and emergency services.
Property tax:
| $328 |
InsuranceThe costs for insurance coverage to protect against financial losses due to risks like fire, natural disasters, theft, liability, or tenant-related damages. Calculation:Assumes 7% of gross rental income, unless insurance rates are specified.
Insurance:
| $273 |
Private Mortgage Insurance (PMI)A fee that borrowers pay when they take out a conventional loan with a loan-to-value (LTV) ratio above 80%.
Private mortgage insurance (PMI):
| $0 |
Monthly PaymentThe fixed amount a borrower pays each month to repay a loan. It typically includes principal and interest (P&I) and may also cover property taxes, insurance, HOA fees, and PMI if escrowed. Monthly payment:
| $3,738 |
Operating Income
| % Rent | Monthly | Yearly | |
|---|---|---|---|
Gross RentThe total rental income received from tenants before deducting any expenses. Includes base rent, late fees, pet fees, parking fees, and other recurring charges.
Gross rent:
| $3,900 | $46,800 | |
Vacancy LossExpected loss of rent due to vacancies.
Vacancy loss:
(6%)
| 6% | -$234 | -$2,808 |
Operating IncomeGross rental income minus vacancy loss. Calculation:Gross rent - Vacancy loss
Operating income:
| $3,666 | $43,992 |
Operating Expenses
| % Rent | Monthly | Yearly | |
|---|---|---|---|
Property TaxesAnnual taxes levied by local governments on real estate properties. These taxes fund public services like schools, roads, and emergency services. | 8% | -$328 | -$3,936 |
InsuranceThe costs for insurance coverage to protect against financial losses due to risks like fire, natural disasters, theft, liability, or tenant-related damages. Calculation:Assumes 7% of gross rental income, unless insurance rates are specified. | 7% | -$273 | -$3,276 |
Property ManagementThe costs associated with hiring a property manager to handle the day-to-day operations of a rental property. Includes management fees, leasing fes, eviction fees, etc. Calculation:Assumes 8% of gross rental income. | 8% | -$312 | -$3,744 |
Repairs & MaintenanceOngoing costs for routine upkeep and minor fixes needed to keep a property in good working condition. Calculation:Assumes 5% of gross rental income. Varies by property age and condition. | 5% | -$195 | -$2,340 |
Capital ExpensesLarge, infrequent costs for major improvements or replacements, like a new roof, HVAC system, or appliances. Calculation:Assumes 5% of gross rental income. Varies by property age. | 5% | -$195 | -$2,340 |
HOA FeesRegular dues paid to a Homeowners Association for community maintenance, amenities, and management. Similar fees include: Condo Association Fees, Co-op Maintenance Fees, etc. | 2% | -$89 | -$1,068 |
Operating ExpensesRecurring costs required to maintain and manage a rental property, including property taxes, insurance, maintenance, repairs, utilities (if paid by the owner), property management fees, and other day-to-day expenses. Calculation:Insurance + Property Taxes + Property Management + Repairs & Maintenance + Capital Expenditures + HOA Fees | 36% | -$1,392 | -$16,704 |
Cash Flow
| Monthly | Yearly | |
|---|---|---|
Net Operating Income (NOI)The income generated from a property after deducting all operating expenses but before deducting mortgage payments, taxes, and capital expenditures. Calculation:Gross Operating Income - Operating Expenses
Net operating income:
| $2,274 | $27,288 |
Mortgage PaymentThe fixed amount a borrower pays each month to repay a loan. It typically includes principal and interest (P&I) and may also cover property taxes, insurance, HOA fees, and PMI if escrowed. | -$3,137 | -$37,644 |
Cash FlowNet Operating Income (NOI) minus mortgage payments. Calculation:NOI - Mortgage Payments | $863 | $10,356 |