$1,075,000
Investment Summary
- Monthly Cash Flow
- -$2,482
- Cap Rate
- 3.1%
- Cash-on-Cash Return
- -12.0%
- Debt Coverage Ratio
- 0.53
- Internal Rate of Return (5 years)
- -7.7%
Cash Flow
Net Operating Income (NOI) minus mortgage payments.
Calculation:
NOI - Mortgage Payments
Cap Rate (Market Value)
Capitalization Rate is a rate of return that compares the yearly Net Operating Income (NOI) to the market value.
Calculation:
NOI / Market Value
Cash-on-Cash Return (CoC)
Annual Cash Flow / Cash Invested
Calculation:
Annual cash flow divided by initial cash invested.
Debt Coverage Ratio (DCR)
Net Operating Income (NOI) divided by total debt payments.
Calculation:
NOI / Total Debt Payments
Internal Rate of Return (IRR)
A metric for assessing profitability over time. IRR is the discount rate at which the net present value (NPV) of all future cash flows (positive and negative) from an investment equals zero — including both periodic cash flow (such as rent) and a projected sale at the end of the holding period. It represents the expected annualized return, accounting for income, expenses, and the recovery of capital through a future sale.
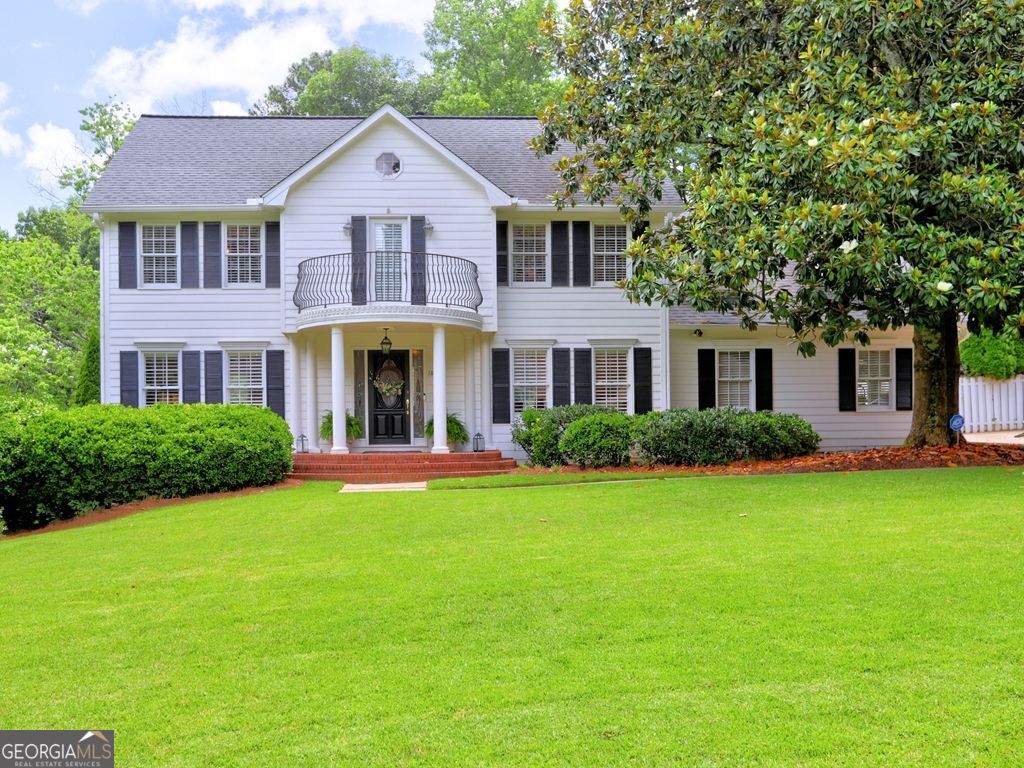
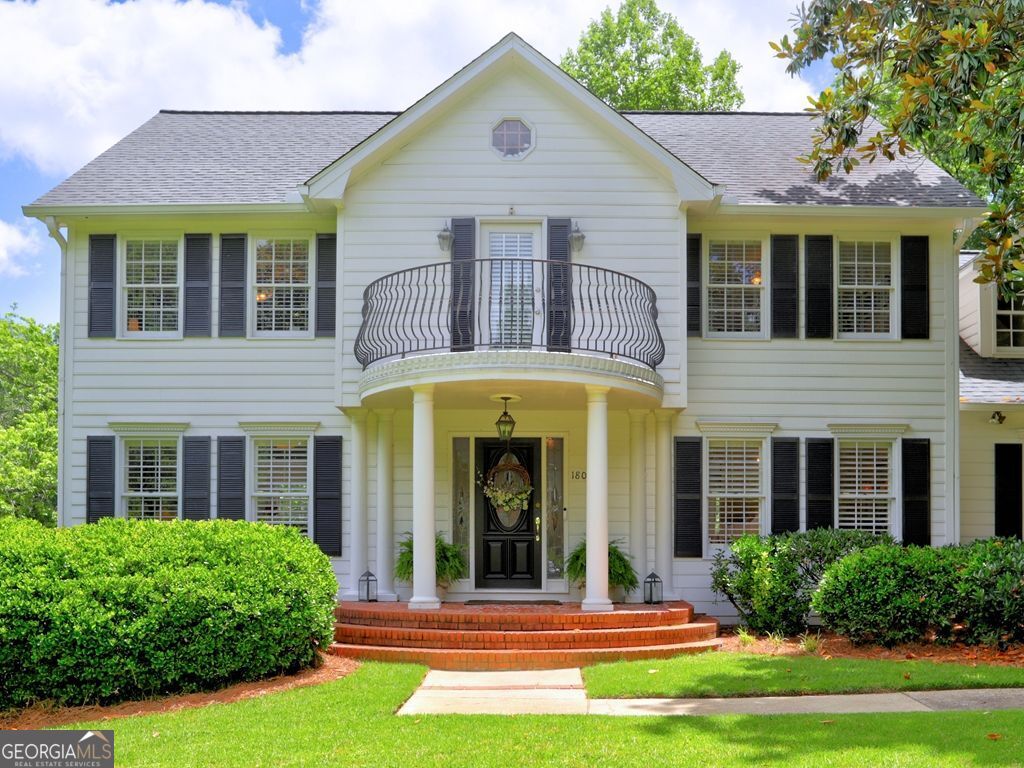
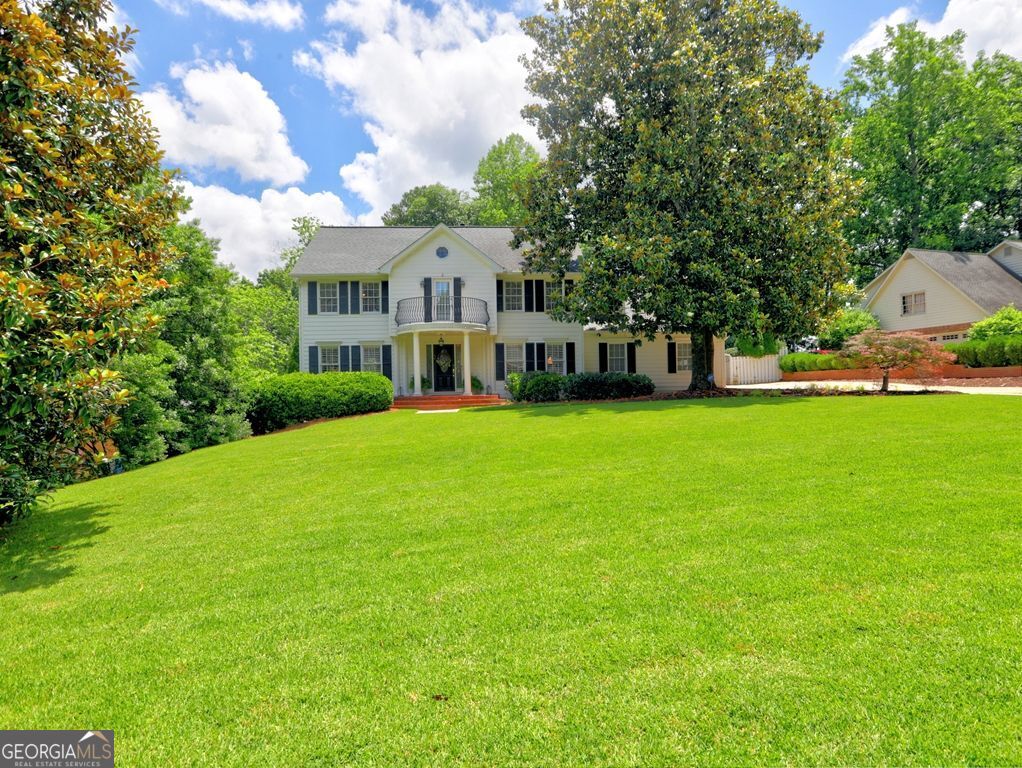
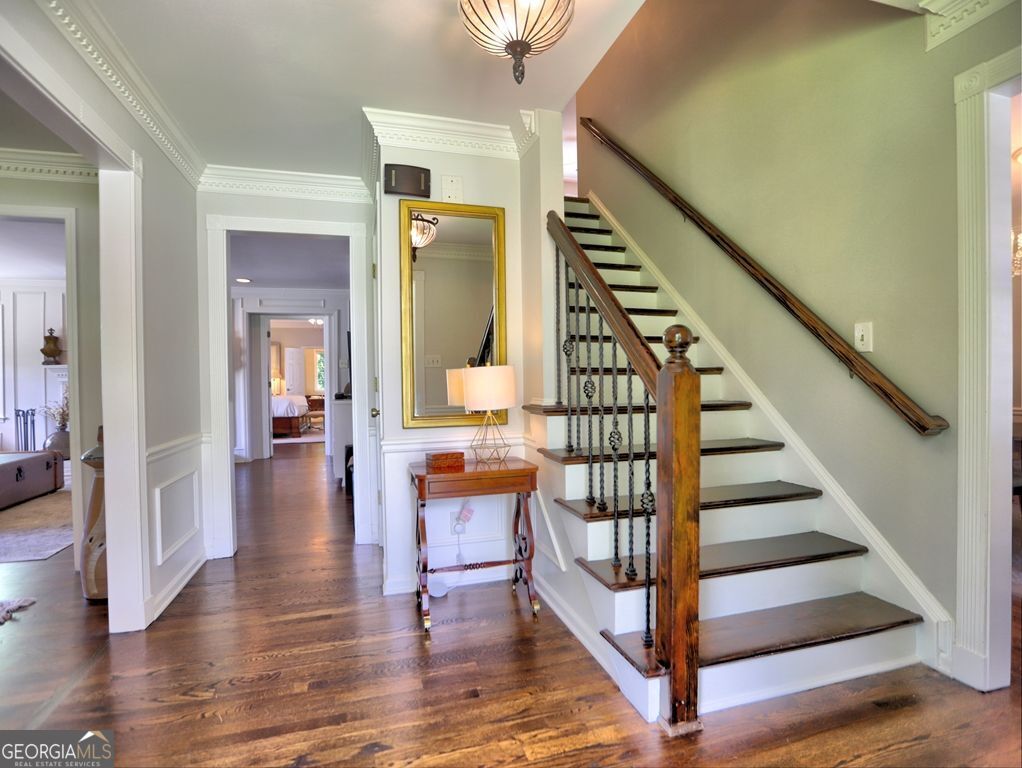
Property Description
Welcome home to this gracious colonial home that captures the essence of timeless elegance while having abundant space for family and entertaining, along with a refreshing pool to enjoy in your own backyard oasis. The lovely flat front yard beckons you to come inside to take a closer look. This 7 bedroom, 6 bath home is a perfect fit for large or multi generational families and is located within the coveted Timber Ridge, Dickerson and Walton school district. An expansive primary suite addition (1991) on the main level offers a soaring trey ceiling, marble surround fireplace, and French door access to the deck, pool area and private, peaceful backyard. The large ensuite bath features his and hers closets, his and hers vanities, a separate spacious shower and jetted garden tub. The thoughtfully designed kitchen with cherry cabinetry, granite countertops, double pantry storage and stainless appliances make cooking a breeze. A breakfast nook bathed in sunlight offers the perfect spot for casual dining, making it a delightful place to enjoy your morning coffee. Adjacent to the kitchen is a comfortable dining room that can accommodate festive gatherings and holiday celebrations. The generously sized family room and office/living room offer additional space for everyone in your family too. The second floor bedrooms are generously sized. The original primary bedroom offers a private ensuite bath and walk in closet. 3 additional bedrooms, another full bathroom, bonus room/playroom and laundry area closet finish out the second story. A back stairway to the main level and gleaming hardwood floors run throughout this captivating home. The fully finished daylight terrace level truly expands your living space. It offers 2 additional bedrooms, 3 full bathrooms, a large recreation room, second kitchen/bar area, an exercise room, 2 patios and lots of storage space. Venture outside to discover an enchanting backyard, ideal for entertaining, play or simply unwinding on a sunny afternoon by the pool after a long day with a good book. Walk, run or bike to popular spots like the Roswell Boardwalk, Chattahoochee River and Nature Center, Azalea Park and Gold Branch Park. Conveniently located close to shopping, grocery stores, restaurants, and all major transportation corridors. Only minutes away from historic Roswell/Canton Street shops, bars and restaurants. Jacksons Creek is one of East Cobb's favorite neighborhoods with an active HOA offering swim, tennis, pickleball, clubhouse and a serene neighborhood lake that is a perfect spot for launching your own canoe or kayak. Come experience the perfect blend of community, convenience, location and award winning schools of excellence.
Build Your Team
Quickly find investor-friendly professionals who can help you succeed in real estate investing at any stage of the investing journey.


Agents
Match with investor-friendly agents who can help you find, analyze, and close your next deal


Lenders
Get the best funding…find investor-friendly lenders who specialize in your deal strategy


Property Managers
Transition to passive investing. Find a trusted property management partnership that lasts.


Tax Pros & Accountants
Taxes and financial reporting made easy—find experts to create tax savings strategies, file taxes, and more
Location
Property Details
Parking
- Description: Attached, Garage, Garage Door Opener, Kitchen Level, Level Driveway
- Details: Attached, Garage, Kitchen Level
- Garage Spaces: 2
- Spaces Total: 2
Bedroom Information
- # of Bedrooms: 7
Bathroom Information
- # of Baths (Full): 6
- # of Baths (Partial): 1
- # of Baths (Total): 6.5
Interior Features
- # of Rooms: 7
- # of Stories: 2
- Basement: Yes
- Basement Description: Full
- Fireplace: Yes
Exterior Features
- Exterior Walls Materials: Wood
- Roof Material: Composition
- Pool: Yes
HOA
- Has HOA: Yes
- HOA Fee: $725/annually
Land Information
- Land Use: Residential
- Land Use Subtype: Single Family Residential
Lot Information
- Parcel ID: 01020700280
- Lot Size: 0 sqft
Property Information
- Property Type: Single Family Residence
- Style: Colonial
- Year Built: 1981
Tax Information
- Annual Tax: $8,634
Utilities
- Water & Sewer: Public
- Heating: Central
- Cooling: Ceiling Fan(s), Central Air
Location
- County: Cobb
Listing Details
Investment Summary
- Monthly Cash Flow
- -$2,482
- Cap Rate
- 3.1%
- Cash-on-Cash Return
- -12.0%
- Debt Coverage Ratio
- 0.53
- Internal Rate of Return (5 years)
- -7.7%
Cash Flow
Net Operating Income (NOI) minus mortgage payments.
Calculation:
NOI - Mortgage Payments
Cap Rate (Market Value)
Capitalization Rate is a rate of return that compares the yearly Net Operating Income (NOI) to the market value.
Calculation:
NOI / Market Value
Cash-on-Cash Return (CoC)
Annual Cash Flow / Cash Invested
Calculation:
Annual cash flow divided by initial cash invested.
Debt Coverage Ratio (DCR)
Net Operating Income (NOI) divided by total debt payments.
Calculation:
NOI / Total Debt Payments
Internal Rate of Return (IRR)
A metric for assessing profitability over time. IRR is the discount rate at which the net present value (NPV) of all future cash flows (positive and negative) from an investment equals zero — including both periodic cash flow (such as rent) and a projected sale at the end of the holding period. It represents the expected annualized return, accounting for income, expenses, and the recovery of capital through a future sale.
Purchase Details
Purchase PriceThe price paid for the property. Purchase price:
| $1,075,000 |
|---|---|
Amount FinancedThe amount of the purchase financed through a loan. Amount financed:
| -$860,000 |
Down paymentThe initial payment made towards the purchase. Down payment:
| $215,000 |
Closing CostsFees and expenses associated with purchasing a property, typically ranging from 2% to 5% of the home’s purchase price, paid at the end of a home purchase to cover services like lending, title transfer, and taxes. Closing costs:
| $32,250 |
Rehab CostsCosts incurred to repair or improve the property, including: roof, flooring, exterior siding, kitchen, exterior paint, bathrooms, etc. Rehab costs:
| $0 |
Initial Cash InvestedThe total initial cash invested in the property. Calculation:Down payment + Buying costs + Rehab costs Initial cash invested:
| $247,250 |
Square Feet (SQFT)The total square footage of the property. Square feet:
| 5,524 |
Cost Per Square FootCost per square foot of the property. Calculation:Purchase Price / Square Feet Cost per square foot:
| $195 |
Monthly Rent Per Square FootMonthly rent divided by the number of square feet. This ratio helps investors compare rental income efficiency across properties, markets, and unit sizes Calculation:Monthly Rent / Square Feet Monthly rent per square foot:
| $0.94 |
Financing Details
Loan AmountThe total sum of money borrowed from a lender to finance a property purchase. Calculation:Purchase Price - Down Payment
Loan amount:
| $860,000 |
|---|---|
Loan to Value Ratio (LTV)Loan amount divided by the market value of the property. Calculation:Loan Amount / Market Value
Loan to value ratio:
| 80.0% |
Loan TypeThe type of loan (e.g., fixed, adjustable).
Loan type:
| Amortizing |
TermThe loan repayment period in years.
Term:
| 30 years |
Interest RateThe percentage a lender charges on the borrowed amount of a loan, determining the cost of borrowing money.
Interest rate:
| 6.240% |
Principal & Interest (PI)The principal is the portion of the loan payment that reduces the loan balance. The interest is the lender's charge for borrowing money. Calculation:(P * r * (1 + r) ** n) / ((1 + r) ** n - 1) Where:
P = Loan amount (principal)
Principal & interest:
| $5,290 |
Property TaxesAnnual taxes levied by local governments on real estate properties. These taxes fund public services like schools, roads, and emergency services.
Property tax:
| $720 |
InsuranceThe costs for insurance coverage to protect against financial losses due to risks like fire, natural disasters, theft, liability, or tenant-related damages. Calculation:Assumes 7% of gross rental income, unless insurance rates are specified.
Insurance:
| $364 |
Private Mortgage Insurance (PMI)A fee that borrowers pay when they take out a conventional loan with a loan-to-value (LTV) ratio above 80%.
Private mortgage insurance (PMI):
| $0 |
Monthly PaymentThe fixed amount a borrower pays each month to repay a loan. It typically includes principal and interest (P&I) and may also cover property taxes, insurance, HOA fees, and PMI if escrowed. Monthly payment:
| $6,374 |
Operating Income
| % Rent | Monthly | Yearly | |
|---|---|---|---|
Gross RentThe total rental income received from tenants before deducting any expenses. Includes base rent, late fees, pet fees, parking fees, and other recurring charges.
Gross rent:
| $5,200 | $62,400 | |
Vacancy LossExpected loss of rent due to vacancies.
Vacancy loss:
(6%)
| 6% | -$312 | -$3,744 |
Operating IncomeGross rental income minus vacancy loss. Calculation:Gross rent - Vacancy loss
Operating income:
| $4,888 | $58,656 |
Operating Expenses
| % Rent | Monthly | Yearly | |
|---|---|---|---|
Property TaxesAnnual taxes levied by local governments on real estate properties. These taxes fund public services like schools, roads, and emergency services. | 14% | -$720 | -$8,634 |
InsuranceThe costs for insurance coverage to protect against financial losses due to risks like fire, natural disasters, theft, liability, or tenant-related damages. Calculation:Assumes 7% of gross rental income, unless insurance rates are specified. | 7% | -$364 | -$4,368 |
Property ManagementThe costs associated with hiring a property manager to handle the day-to-day operations of a rental property. Includes management fees, leasing fes, eviction fees, etc. Calculation:Assumes 8% of gross rental income. | 8% | -$416 | -$4,992 |
Repairs & MaintenanceOngoing costs for routine upkeep and minor fixes needed to keep a property in good working condition. Calculation:Assumes 5% of gross rental income. Varies by property age and condition. | 5% | -$260 | -$3,120 |
Capital ExpensesLarge, infrequent costs for major improvements or replacements, like a new roof, HVAC system, or appliances. Calculation:Assumes 5% of gross rental income. Varies by property age. | 5% | -$260 | -$3,120 |
HOA FeesRegular dues paid to a Homeowners Association for community maintenance, amenities, and management. Similar fees include: Condo Association Fees, Co-op Maintenance Fees, etc. | 1% | -$60 | -$720 |
Operating ExpensesRecurring costs required to maintain and manage a rental property, including property taxes, insurance, maintenance, repairs, utilities (if paid by the owner), property management fees, and other day-to-day expenses. Calculation:Insurance + Property Taxes + Property Management + Repairs & Maintenance + Capital Expenditures + HOA Fees | 40% | -$2,080 | -$24,954 |
Cash Flow
| Monthly | Yearly | |
|---|---|---|
Net Operating Income (NOI)The income generated from a property after deducting all operating expenses but before deducting mortgage payments, taxes, and capital expenditures. Calculation:Gross Operating Income - Operating Expenses
Net operating income:
| $2,808 | $33,696 |
Mortgage PaymentThe fixed amount a borrower pays each month to repay a loan. It typically includes principal and interest (P&I) and may also cover property taxes, insurance, HOA fees, and PMI if escrowed. | -$5,290 | -$63,480 |
Cash FlowNet Operating Income (NOI) minus mortgage payments. Calculation:NOI - Mortgage Payments | -$2,482 | -$29,784 |