
$505,000
Investment Summary
- Monthly Cash Flow
- -$1,383
- Cap Rate
- 3.0%
- Cash-on-Cash Return
- -14.3%
- Debt Coverage Ratio
- 0.48
- Internal Rate of Return (5 years)
- -9.8%
Cash Flow
Net Operating Income (NOI) minus mortgage payments.
Calculation:
NOI - Mortgage Payments
Cap Rate (Market Value)
Capitalization Rate is a rate of return that compares the yearly Net Operating Income (NOI) to the market value.
Calculation:
NOI / Market Value
Cash-on-Cash Return (CoC)
Annual Cash Flow / Cash Invested
Calculation:
Annual cash flow divided by initial cash invested.
Debt Coverage Ratio (DCR)
Net Operating Income (NOI) divided by total debt payments.
Calculation:
NOI / Total Debt Payments
Internal Rate of Return (IRR)
A metric for assessing profitability over time. IRR is the discount rate at which the net present value (NPV) of all future cash flows (positive and negative) from an investment equals zero — including both periodic cash flow (such as rent) and a projected sale at the end of the holding period. It represents the expected annualized return, accounting for income, expenses, and the recovery of capital through a future sale.
Property Description
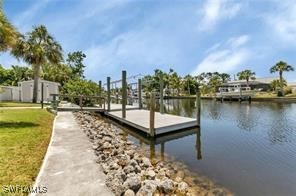
Indulge in waterfront living with southern exposure!! Charming 2-bed, 2-bath heated pool home, offering a comfortable 1,288 square feet of living space. Enjoy the convenience of CITY WATER! Upon arrival, you'll be greeted by a circular paved driveway leading to a one-car garage, adding to the home's curb appeal. The air-conditioned garage features an R-19 insulated door with an automatic deadbolt latch and a side-direct drive opener, ensuring both convenience and security. The double-entry, screened-in front lanai, secured by impact-resistant French doors, sets a welcoming tone. Inside, the living spaces blend seamlessly with the outdoors, courtesy of large windows that usher in natural light. Home features tile flooring throughout. The living room flows into the dining area, which offers access to lanai through the sliding doors. The kitchen is equipped with solid surface countertops, NEW dishwasher, kitchen sink features reverse osmosis, and ample of cabinet space. The master bedroom boasts a walk-in closet, Impact sliders to the lanai, and a private bath with a single sink and a beautifully tiled walk-in shower. The guest bedroom offers comfort and convenience, complemented by a guest bathroom featuring a shower/tub combo. The inside laundry room includes a washer and dryer, utility sink, desk, and additional storage closet. Step outside to discover a backyard paradise, featuring a sparkling heated pool with enchanting light features to illuminate your evenings, ensuring year-round enjoyment and an oversized lanai perfect space to entertain family & friends. Imagine spending warm summer days lounging by the pool or watching sunsets, creating memories that will last a lifetime. Fishing enthusiasts will appreciate the 80' of water frontage with concrete seawall with riprap protection, 10,000lb boat lift, and a high-quality 10X40 Trex dock equipped with electric & water. This home offers direct access to the waterways with one bridge out to open water, making it a boater’s dream. YOUR backyard area is enclosed by a vinyl fence, providing privacy without obstructing the view, while a separate chain-link back adds extra security for your pets. The outdoor space is further enhanced with exquisite landscaping, an irrigation system to maintain the lawn, and a brick paver walkway that winds through the backyard to the side of the house. Bonus shed for extra storage. This home is a true gem, blending comfort, and a prime waterfront location. Experience peace of mind with recent upgrades including: Roof "2022", Hot Water Heater "2024", Garage door replaced "2020"and Impact Windows/Doors "2019". No deed restrictions and not located in a HOA. This home is conveniently located in a nice neighborhood but close to restaurants, shopping, beaches and much more!!! Don’t miss the opportunity to own this beautiful waterfront pool home, where every day feels like a vacation! Ask to see this one first...make YOUR appointment today!!!
Build Your Team
Quickly find investor-friendly professionals who can help you succeed in real estate investing at any stage of the investing journey.


Agents
Match with investor-friendly agents who can help you find, analyze, and close your next deal


Lenders
Get the best funding…find investor-friendly lenders who specialize in your deal strategy


Property Managers
Transition to passive investing. Find a trusted property management partnership that lasts.


Tax Pros & Accountants
Taxes and financial reporting made easy—find experts to create tax savings strategies, file taxes, and more
Location
Property Details
Parking
- Description: Attached, Garage
- Details: Attached, Garage
- Garage Spaces: 1
- Spaces Total: 0
Bedroom Information
- # of Bedrooms: 2
Bathroom Information
- # of Baths (Full): 2
- # of Baths (Total): 2.0
Interior Features
- # of Rooms: 5
- # of Stories: 1
Exterior Features
- Exterior Walls Materials: Concrete Block
- Roof Material: Shingle
- Pool: Yes
Land Information
- Land Use: Residential
- Land Use Subtype: Single Family Residential
Lot Information
- Parcel ID: 402230378012
- Lot Size: 0 sqft
Property Information
- Property Type: Single Family Residence
- Style: Other, Traditional
- Year Built: 1972
Tax Information
- Annual Tax: $6,494
Utilities
- Water & Sewer: Public
- Heating: Central, Electric, Other
- Cooling: Central Air, Electric, Other
Location
- County: Charlotte
Listing Details
Investment Summary
- Monthly Cash Flow
- -$1,383
- Cap Rate
- 3.0%
- Cash-on-Cash Return
- -14.3%
- Debt Coverage Ratio
- 0.48
- Internal Rate of Return (5 years)
- -9.8%
Cash Flow
Net Operating Income (NOI) minus mortgage payments.
Calculation:
NOI - Mortgage Payments
Cap Rate (Market Value)
Capitalization Rate is a rate of return that compares the yearly Net Operating Income (NOI) to the market value.
Calculation:
NOI / Market Value
Cash-on-Cash Return (CoC)
Annual Cash Flow / Cash Invested
Calculation:
Annual cash flow divided by initial cash invested.
Debt Coverage Ratio (DCR)
Net Operating Income (NOI) divided by total debt payments.
Calculation:
NOI / Total Debt Payments
Internal Rate of Return (IRR)
A metric for assessing profitability over time. IRR is the discount rate at which the net present value (NPV) of all future cash flows (positive and negative) from an investment equals zero — including both periodic cash flow (such as rent) and a projected sale at the end of the holding period. It represents the expected annualized return, accounting for income, expenses, and the recovery of capital through a future sale.
Purchase Details
Purchase PriceThe price paid for the property. Purchase price:
| $505,000 |
|---|---|
Amount FinancedThe amount of the purchase financed through a loan. Amount financed:
| -$404,000 |
Down paymentThe initial payment made towards the purchase. Down payment:
| $101,000 |
Closing CostsFees and expenses associated with purchasing a property, typically ranging from 2% to 5% of the home’s purchase price, paid at the end of a home purchase to cover services like lending, title transfer, and taxes. Closing costs:
| $15,150 |
Rehab CostsCosts incurred to repair or improve the property, including: roof, flooring, exterior siding, kitchen, exterior paint, bathrooms, etc. Rehab costs:
| $0 |
Initial Cash InvestedThe total initial cash invested in the property. Calculation:Down payment + Buying costs + Rehab costs Initial cash invested:
| $116,150 |
Square Feet (SQFT)The total square footage of the property. Square feet:
| 1,288 |
Cost Per Square FootCost per square foot of the property. Calculation:Purchase Price / Square Feet Cost per square foot:
| $392 |
Monthly Rent Per Square FootMonthly rent divided by the number of square feet. This ratio helps investors compare rental income efficiency across properties, markets, and unit sizes Calculation:Monthly Rent / Square Feet Monthly rent per square foot:
| $2.02 |
Financing Details
Loan AmountThe total sum of money borrowed from a lender to finance a property purchase. Calculation:Purchase Price - Down Payment
Loan amount:
| $404,000 |
|---|---|
Loan to Value Ratio (LTV)Loan amount divided by the market value of the property. Calculation:Loan Amount / Market Value
Loan to value ratio:
| 80.0% |
Loan TypeThe type of loan (e.g., fixed, adjustable).
Loan type:
| Amortizing |
TermThe loan repayment period in years.
Term:
| 30 years |
Interest RateThe percentage a lender charges on the borrowed amount of a loan, determining the cost of borrowing money.
Interest rate:
| 6.810% |
Principal & Interest (PI)The principal is the portion of the loan payment that reduces the loan balance. The interest is the lender's charge for borrowing money. Calculation:(P * r * (1 + r) ** n) / ((1 + r) ** n - 1) Where:
P = Loan amount (principal)
Principal & interest:
| $2,636 |
Property TaxesAnnual taxes levied by local governments on real estate properties. These taxes fund public services like schools, roads, and emergency services.
Property tax:
| $541 |
InsuranceThe costs for insurance coverage to protect against financial losses due to risks like fire, natural disasters, theft, liability, or tenant-related damages. Calculation:Assumes 7% of gross rental income, unless insurance rates are specified.
Insurance:
| $182 |
Private Mortgage Insurance (PMI)A fee that borrowers pay when they take out a conventional loan with a loan-to-value (LTV) ratio above 80%.
Private mortgage insurance (PMI):
| $0 |
Monthly PaymentThe fixed amount a borrower pays each month to repay a loan. It typically includes principal and interest (P&I) and may also cover property taxes, insurance, HOA fees, and PMI if escrowed. Monthly payment:
| $3,359 |
Operating Income
| % Rent | Monthly | Yearly | |
|---|---|---|---|
Gross RentThe total rental income received from tenants before deducting any expenses. Includes base rent, late fees, pet fees, parking fees, and other recurring charges.
Gross rent:
| $2,600 | $31,200 | |
Vacancy LossExpected loss of rent due to vacancies.
Vacancy loss:
(6%)
| 6% | -$156 | -$1,872 |
Operating IncomeGross rental income minus vacancy loss. Calculation:Gross rent - Vacancy loss
Operating income:
| $2,444 | $29,328 |
Operating Expenses
| % Rent | Monthly | Yearly | |
|---|---|---|---|
Property TaxesAnnual taxes levied by local governments on real estate properties. These taxes fund public services like schools, roads, and emergency services. | 21% | -$541 | -$6,494 |
InsuranceThe costs for insurance coverage to protect against financial losses due to risks like fire, natural disasters, theft, liability, or tenant-related damages. Calculation:Assumes 7% of gross rental income, unless insurance rates are specified. | 7% | -$182 | -$2,184 |
Property ManagementThe costs associated with hiring a property manager to handle the day-to-day operations of a rental property. Includes management fees, leasing fes, eviction fees, etc. Calculation:Assumes 8% of gross rental income. | 8% | -$208 | -$2,496 |
Repairs & MaintenanceOngoing costs for routine upkeep and minor fixes needed to keep a property in good working condition. Calculation:Assumes 5% of gross rental income. Varies by property age and condition. | 5% | -$130 | -$1,560 |
Capital ExpensesLarge, infrequent costs for major improvements or replacements, like a new roof, HVAC system, or appliances. Calculation:Assumes 5% of gross rental income. Varies by property age. | 5% | -$130 | -$1,560 |
HOA FeesRegular dues paid to a Homeowners Association for community maintenance, amenities, and management. Similar fees include: Condo Association Fees, Co-op Maintenance Fees, etc. | n/a | n/a | n/a |
Operating ExpensesRecurring costs required to maintain and manage a rental property, including property taxes, insurance, maintenance, repairs, utilities (if paid by the owner), property management fees, and other day-to-day expenses. Calculation:Insurance + Property Taxes + Property Management + Repairs & Maintenance + Capital Expenditures + HOA Fees | 46% | -$1,191 | -$14,294 |
Cash Flow
| Monthly | Yearly | |
|---|---|---|
Net Operating Income (NOI)The income generated from a property after deducting all operating expenses but before deducting mortgage payments, taxes, and capital expenditures. Calculation:Gross Operating Income - Operating Expenses
Net operating income:
| $1,253 | $15,036 |
Mortgage PaymentThe fixed amount a borrower pays each month to repay a loan. It typically includes principal and interest (P&I) and may also cover property taxes, insurance, HOA fees, and PMI if escrowed. | -$2,636 | -$31,632 |
Cash FlowNet Operating Income (NOI) minus mortgage payments. Calculation:NOI - Mortgage Payments | $1,383 | $16,596 |