$2,995,000
Investment Summary
- Monthly Cash Flow
- -$9,773
- Cap Rate
- 2.2%
- Cash-on-Cash Return
- -17.0%
- Debt Coverage Ratio
- 0.36
- Internal Rate of Return (5 years)
- -12.5%
Cash Flow
Net Operating Income (NOI) minus mortgage payments.
Calculation:
NOI - Mortgage Payments
Cap Rate (Market Value)
Capitalization Rate is a rate of return that compares the yearly Net Operating Income (NOI) to the market value.
Calculation:
NOI / Market Value
Cash-on-Cash Return (CoC)
Annual Cash Flow / Cash Invested
Calculation:
Annual cash flow divided by initial cash invested.
Debt Coverage Ratio (DCR)
Net Operating Income (NOI) divided by total debt payments.
Calculation:
NOI / Total Debt Payments
Internal Rate of Return (IRR)
A metric for assessing profitability over time. IRR is the discount rate at which the net present value (NPV) of all future cash flows (positive and negative) from an investment equals zero — including both periodic cash flow (such as rent) and a projected sale at the end of the holding period. It represents the expected annualized return, accounting for income, expenses, and the recovery of capital through a future sale.
Property Description
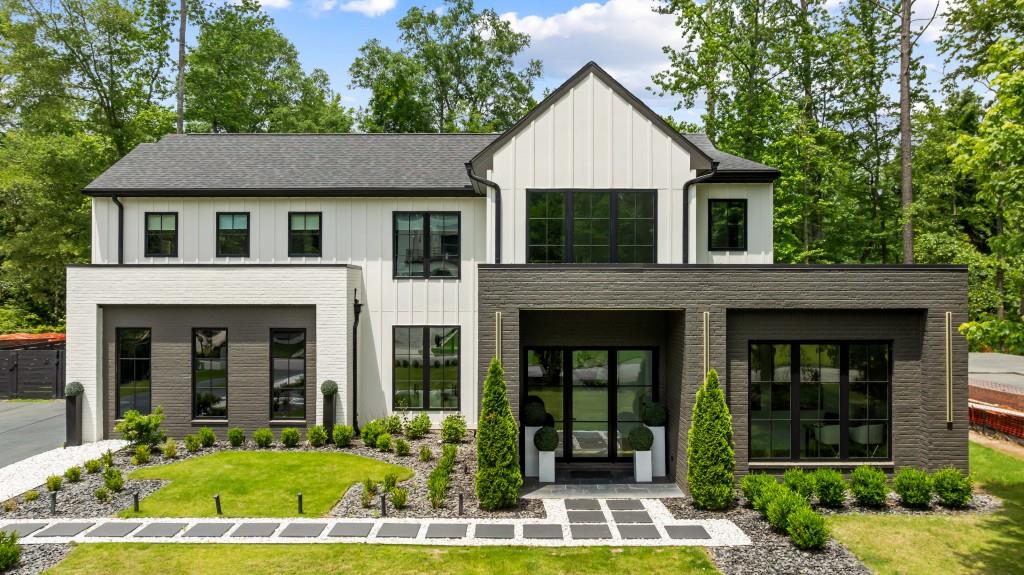
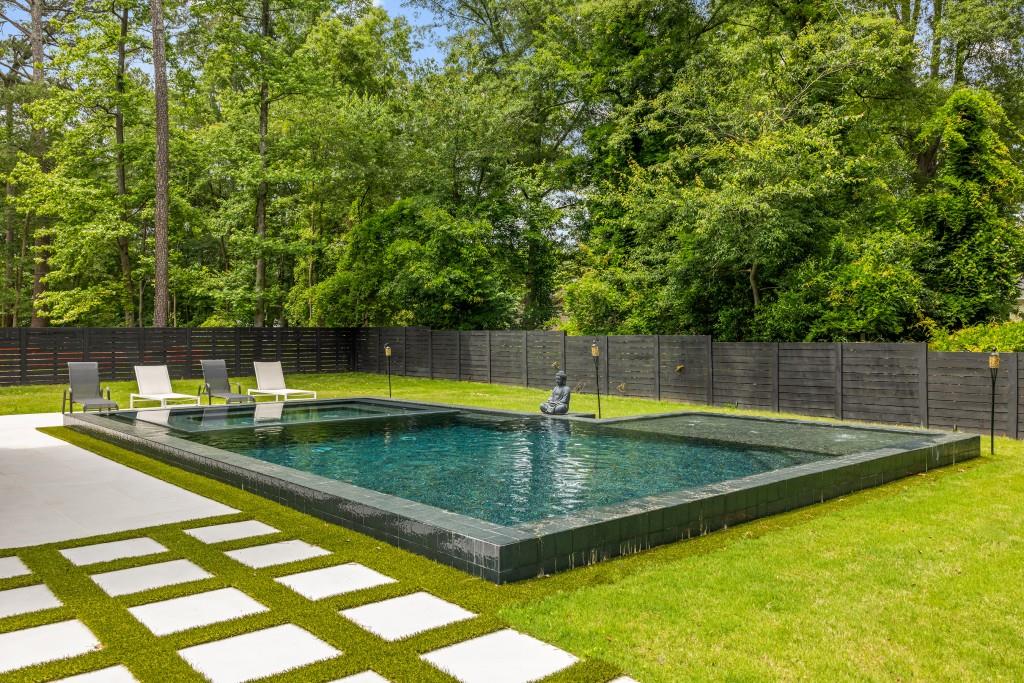
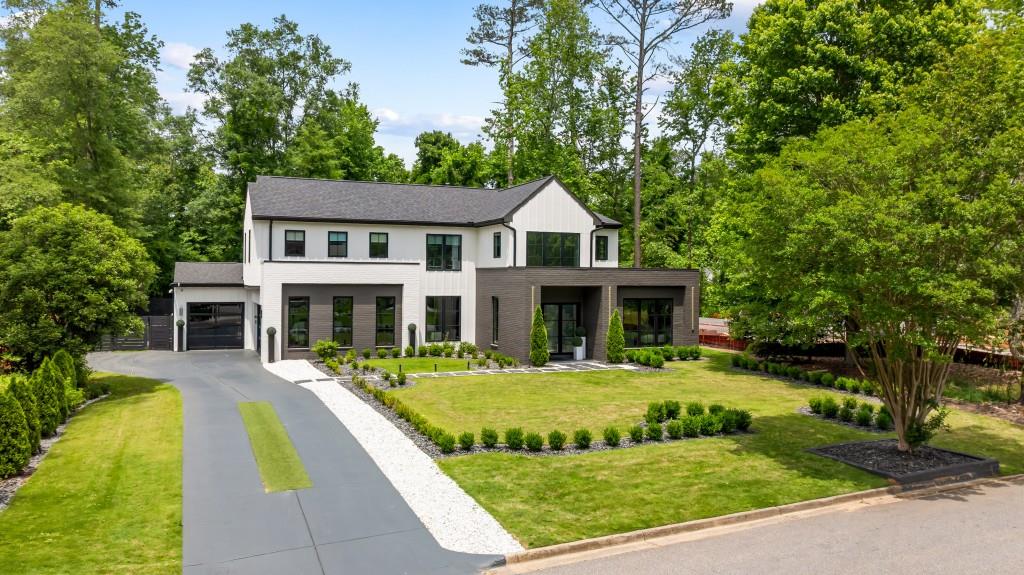
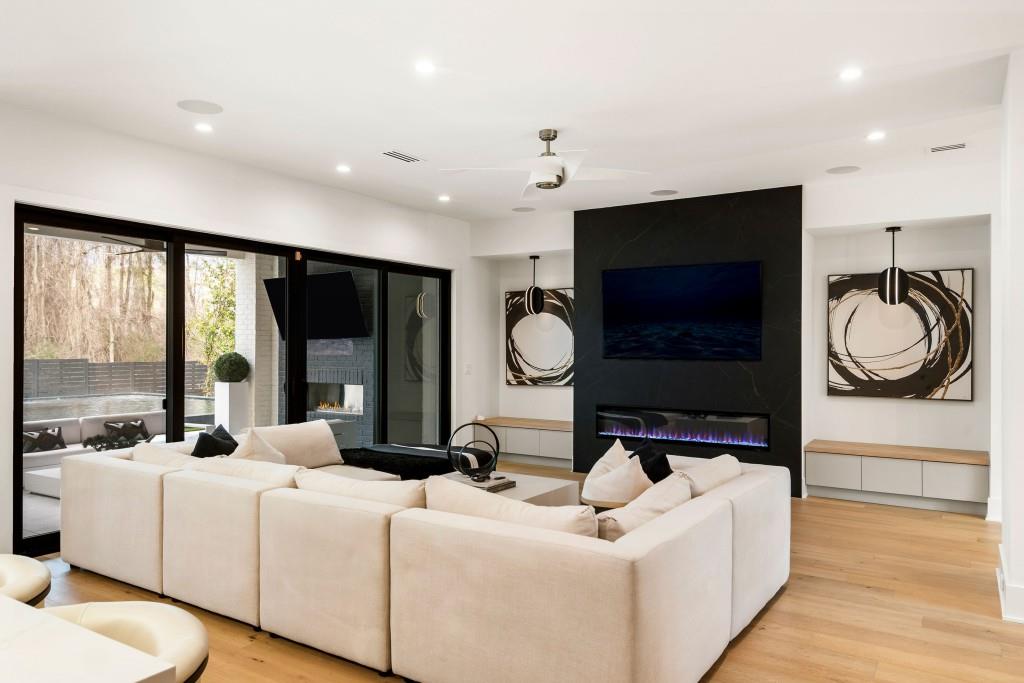
A triumph of modern design and craftsmanship, this distinguished modern residence in Alpharetta's coveted Garden District offers a seamless blend of luxury and resort-quality livability. Every element, from its striking architecture to its thoughtfully curated interiors, reflects an uncompromising commitment to quality and sophistication, all within moments of premier dining, shopping, and cultural destinations. A newly completed heated saltwater pool and raised spa, clad in black glass tile with a cascading waterfall, create a private resort-style retreat. A commanding fa ade, enhanced by precise landscaping and custom exterior lighting, introduces the home's luminous and flowing interiors. The two-story foyer, lined with wide-plank white oak flooring, leads to a series of spaces designed for both grand entertaining and intimate daily living. A private study with custom millwork offers a quiet retreat, while the formal dining room, anchored by a dramatic floor-to-ceiling glass wine display, sets an elegant stage for gatherings. At the center of the home, the chef's kitchen blends form and function with bespoke European-inspired cabinetry, waterfall quartz countertops, and a full suite of paneled Wolf and Sub-Zero appliances. An expansive island and adjacent butler's pantry, complete with a Miele coffee system, ensure effortless hosting. The adjoining great room, framed by an elegant fireplace with a custom surround, is bathed in natural light from a wall of sliding glass doors, seamlessly extending the living space to the fireside covered lanai. The primary suite, secluded on the main level, is a private sanctuary featuring vaulted ceilings, transom windows, and direct access to the lanai. Its spa-inspired bath is appointed with floating vanities, a soaking tub, an oversized glass shower, and a bespoke illuminated wardrobe system. Additional main-level amenities include a well-appointed mudroom, a designer laundry room with custom cabinetry, and a three-car garage with epoxy-finished flooring. Ascending the glass-railed staircase, the upper level reveals four generously scaled bedrooms, each offering distinct character. One, envisioned as a fashion atelier, boasts vaulted ceilings and clerestory windows, while another functions as an in-law or au pair suite, complete with a reading nook and a climate-controlled four-season lounge overlooking the estate-like grounds. Beyond the interiors, the outdoor spaces are designed for both relaxation and entertaining. The expansive terrace, finished with large-format tile, provides ample space for sunbathing, dining, and hosting against the backdrop of the stunning resort-style pool. Thoughtfully executed landscaping ensures privacy while enhancing the home's overall sense of tranquility. A rare offering in Downtown Alpharetta, this residence represents the pinnacle of contemporary luxury-where architectural precision, premier location, and an exceptional lifestyle converge in perfect harmony.
Build Your Team
Quickly find investor-friendly professionals who can help you succeed in real estate investing at any stage of the investing journey.


Agents
Match with investor-friendly agents who can help you find, analyze, and close your next deal


Lenders
Get the best funding…find investor-friendly lenders who specialize in your deal strategy


Property Managers
Transition to passive investing. Find a trusted property management partnership that lasts.


Tax Pros & Accountants
Taxes and financial reporting made easy—find experts to create tax savings strategies, file taxes, and more
Location
Property Details
Parking
- Description: Attached, Garage
- Details: Attached, Driveway, Garage
- Garage Spaces: 3
- Spaces Total: 0
Bedroom Information
- # of Bedrooms: 5
Bathroom Information
- # of Baths (Full): 3
- # of Baths (Partial): 1
- # of Baths (Total): 4.0
Interior Features
- # of Rooms: 8
- # of Stories: 2
- Basement Description: None
- Fireplace: Yes
Exterior Features
- Exterior Walls Materials: Rock, Stone
- Foundation: Concrete Perimeter
- Roof Material: Composition, Shingle, Other
- Pool: Yes
Land Information
- Land Use: Residential
- Land Use Subtype: Single Family Residential
Lot Information
- Parcel ID: 22481111790198
- Lot Size: 0 sqft
Property Information
- Property Type: Single Family Residence
- Style: Modern
- Year Built: 2022
Tax Information
- Annual Tax: $24,253
Utilities
- Water & Sewer: Public
- Heating: Natural Gas
- Cooling: Ceiling Fan(s), Central Air
Location
- County: Fulton
Listing Details
Investment Summary
- Monthly Cash Flow
- -$9,773
- Cap Rate
- 2.2%
- Cash-on-Cash Return
- -17.0%
- Debt Coverage Ratio
- 0.36
- Internal Rate of Return (5 years)
- -12.5%
Cash Flow
Net Operating Income (NOI) minus mortgage payments.
Calculation:
NOI - Mortgage Payments
Cap Rate (Market Value)
Capitalization Rate is a rate of return that compares the yearly Net Operating Income (NOI) to the market value.
Calculation:
NOI / Market Value
Cash-on-Cash Return (CoC)
Annual Cash Flow / Cash Invested
Calculation:
Annual cash flow divided by initial cash invested.
Debt Coverage Ratio (DCR)
Net Operating Income (NOI) divided by total debt payments.
Calculation:
NOI / Total Debt Payments
Internal Rate of Return (IRR)
A metric for assessing profitability over time. IRR is the discount rate at which the net present value (NPV) of all future cash flows (positive and negative) from an investment equals zero — including both periodic cash flow (such as rent) and a projected sale at the end of the holding period. It represents the expected annualized return, accounting for income, expenses, and the recovery of capital through a future sale.
Purchase Details
Purchase PriceThe price paid for the property. Purchase price:
| $2,995,000 |
|---|---|
Amount FinancedThe amount of the purchase financed through a loan. Amount financed:
| -$2,396,000 |
Down paymentThe initial payment made towards the purchase. Down payment:
| $599,000 |
Closing CostsFees and expenses associated with purchasing a property, typically ranging from 2% to 5% of the home’s purchase price, paid at the end of a home purchase to cover services like lending, title transfer, and taxes. Closing costs:
| $89,850 |
Rehab CostsCosts incurred to repair or improve the property, including: roof, flooring, exterior siding, kitchen, exterior paint, bathrooms, etc. Rehab costs:
| $0 |
Initial Cash InvestedThe total initial cash invested in the property. Calculation:Down payment + Buying costs + Rehab costs Initial cash invested:
| $688,850 |
Square Feet (SQFT)The total square footage of the property. Square feet:
| 0 |
Cost Per Square FootCost per square foot of the property. Calculation:Purchase Price / Square Feet Cost per square foot:
| n/a |
Monthly Rent Per Square FootMonthly rent divided by the number of square feet. This ratio helps investors compare rental income efficiency across properties, markets, and unit sizes Calculation:Monthly Rent / Square Feet Monthly rent per square foot:
| n/a |
Financing Details
Loan AmountThe total sum of money borrowed from a lender to finance a property purchase. Calculation:Purchase Price - Down Payment
Loan amount:
| $2,396,000 |
|---|---|
Loan to Value Ratio (LTV)Loan amount divided by the market value of the property. Calculation:Loan Amount / Market Value
Loan to value ratio:
| 80.0% |
Loan TypeThe type of loan (e.g., fixed, adjustable).
Loan type:
| Amortizing |
TermThe loan repayment period in years.
Term:
| 30 years |
Interest RateThe percentage a lender charges on the borrowed amount of a loan, determining the cost of borrowing money.
Interest rate:
| 6.625% |
Principal & Interest (PI)The principal is the portion of the loan payment that reduces the loan balance. The interest is the lender's charge for borrowing money. Calculation:(P * r * (1 + r) ** n) / ((1 + r) ** n - 1) Where:
P = Loan amount (principal)
Principal & interest:
| $15,342 |
Property TaxesAnnual taxes levied by local governments on real estate properties. These taxes fund public services like schools, roads, and emergency services.
Property tax:
| $2,021 |
InsuranceThe costs for insurance coverage to protect against financial losses due to risks like fire, natural disasters, theft, liability, or tenant-related damages. Calculation:Assumes 7% of gross rental income, unless insurance rates are specified.
Insurance:
| $770 |
Private Mortgage Insurance (PMI)A fee that borrowers pay when they take out a conventional loan with a loan-to-value (LTV) ratio above 80%.
Private mortgage insurance (PMI):
| $0 |
Monthly PaymentThe fixed amount a borrower pays each month to repay a loan. It typically includes principal and interest (P&I) and may also cover property taxes, insurance, HOA fees, and PMI if escrowed. Monthly payment:
| $18,133 |
Operating Income
| % Rent | Monthly | Yearly | |
|---|---|---|---|
Gross RentThe total rental income received from tenants before deducting any expenses. Includes base rent, late fees, pet fees, parking fees, and other recurring charges.
Gross rent:
| $11,000 | $132,000 | |
Vacancy LossExpected loss of rent due to vacancies.
Vacancy loss:
(6%)
| 6% | -$660 | -$7,920 |
Operating IncomeGross rental income minus vacancy loss. Calculation:Gross rent - Vacancy loss
Operating income:
| $10,340 | $124,080 |
Operating Expenses
| % Rent | Monthly | Yearly | |
|---|---|---|---|
Property TaxesAnnual taxes levied by local governments on real estate properties. These taxes fund public services like schools, roads, and emergency services. | 18% | -$2,021 | -$24,253 |
InsuranceThe costs for insurance coverage to protect against financial losses due to risks like fire, natural disasters, theft, liability, or tenant-related damages. Calculation:Assumes 7% of gross rental income, unless insurance rates are specified. | 7% | -$770 | -$9,240 |
Property ManagementThe costs associated with hiring a property manager to handle the day-to-day operations of a rental property. Includes management fees, leasing fes, eviction fees, etc. Calculation:Assumes 8% of gross rental income. | 8% | -$880 | -$10,560 |
Repairs & MaintenanceOngoing costs for routine upkeep and minor fixes needed to keep a property in good working condition. Calculation:Assumes 5% of gross rental income. Varies by property age and condition. | 5% | -$550 | -$6,600 |
Capital ExpensesLarge, infrequent costs for major improvements or replacements, like a new roof, HVAC system, or appliances. Calculation:Assumes 5% of gross rental income. Varies by property age. | 5% | -$550 | -$6,600 |
HOA FeesRegular dues paid to a Homeowners Association for community maintenance, amenities, and management. Similar fees include: Condo Association Fees, Co-op Maintenance Fees, etc. | n/a | n/a | n/a |
Operating ExpensesRecurring costs required to maintain and manage a rental property, including property taxes, insurance, maintenance, repairs, utilities (if paid by the owner), property management fees, and other day-to-day expenses. Calculation:Insurance + Property Taxes + Property Management + Repairs & Maintenance + Capital Expenditures + HOA Fees | 43% | -$4,771 | -$57,253 |
Cash Flow
| Monthly | Yearly | |
|---|---|---|
Net Operating Income (NOI)The income generated from a property after deducting all operating expenses but before deducting mortgage payments, taxes, and capital expenditures. Calculation:Gross Operating Income - Operating Expenses
Net operating income:
| $5,569 | $66,828 |
Mortgage PaymentThe fixed amount a borrower pays each month to repay a loan. It typically includes principal and interest (P&I) and may also cover property taxes, insurance, HOA fees, and PMI if escrowed. | -$15,342 | -$184,104 |
Cash FlowNet Operating Income (NOI) minus mortgage payments. Calculation:NOI - Mortgage Payments | $9,773 | $117,276 |