$315,000
Investment Summary
- Monthly Cash Flow
- -$358
- Cap Rate
- 4.8%
- Cash-on-Cash Return
- -5.9%
- Debt Coverage Ratio
- 0.78
- Internal Rate of Return (5 years)
- -1.8%
Cash Flow
Net Operating Income (NOI) minus mortgage payments.
Calculation:
NOI - Mortgage Payments
Cap Rate (Market Value)
Capitalization Rate is a rate of return that compares the yearly Net Operating Income (NOI) to the market value.
Calculation:
NOI / Market Value
Cash-on-Cash Return (CoC)
Annual Cash Flow / Cash Invested
Calculation:
Annual cash flow divided by initial cash invested.
Debt Coverage Ratio (DCR)
Net Operating Income (NOI) divided by total debt payments.
Calculation:
NOI / Total Debt Payments
Internal Rate of Return (IRR)
A metric for assessing profitability over time. IRR is the discount rate at which the net present value (NPV) of all future cash flows (positive and negative) from an investment equals zero — including both periodic cash flow (such as rent) and a projected sale at the end of the holding period. It represents the expected annualized return, accounting for income, expenses, and the recovery of capital through a future sale.
Property Description
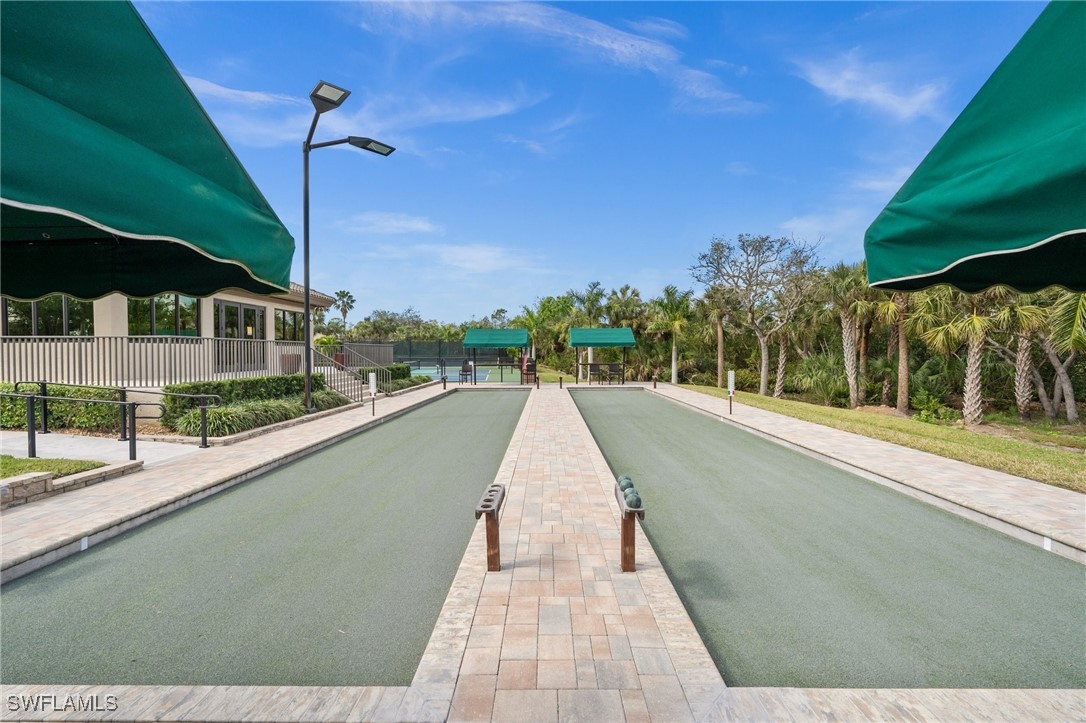
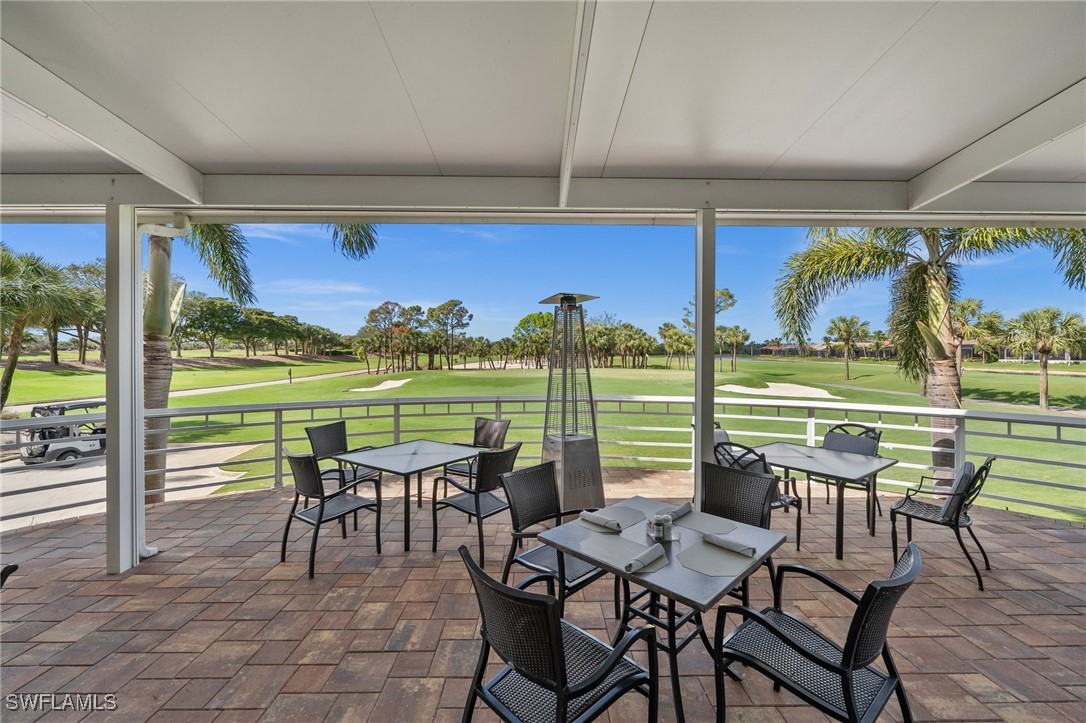
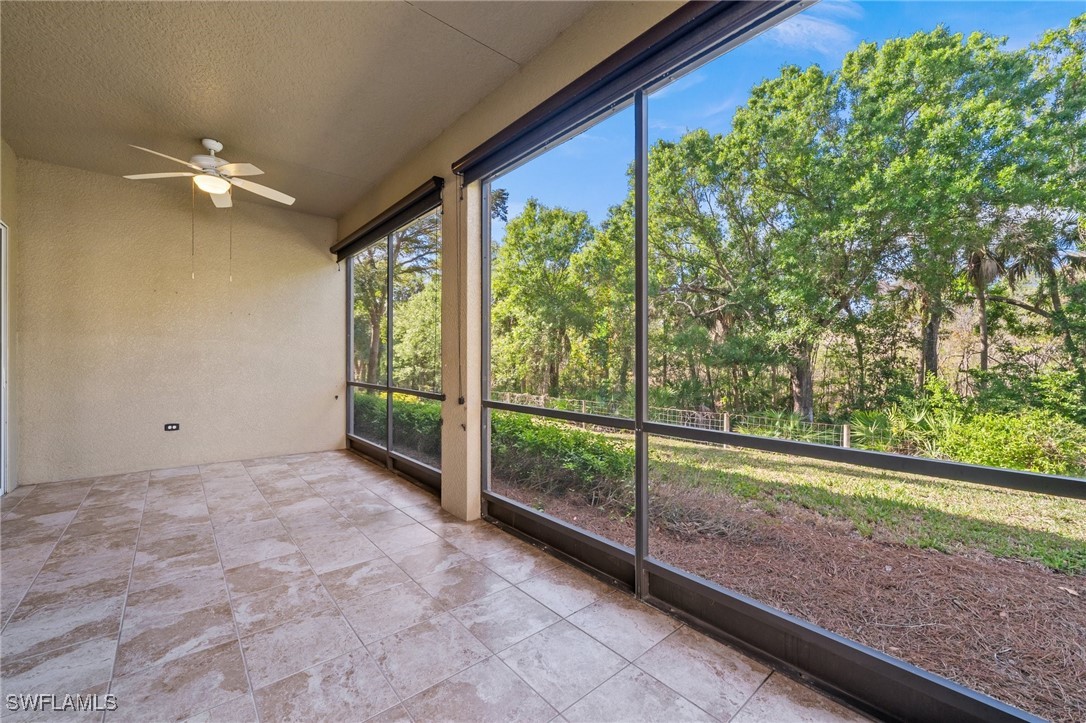
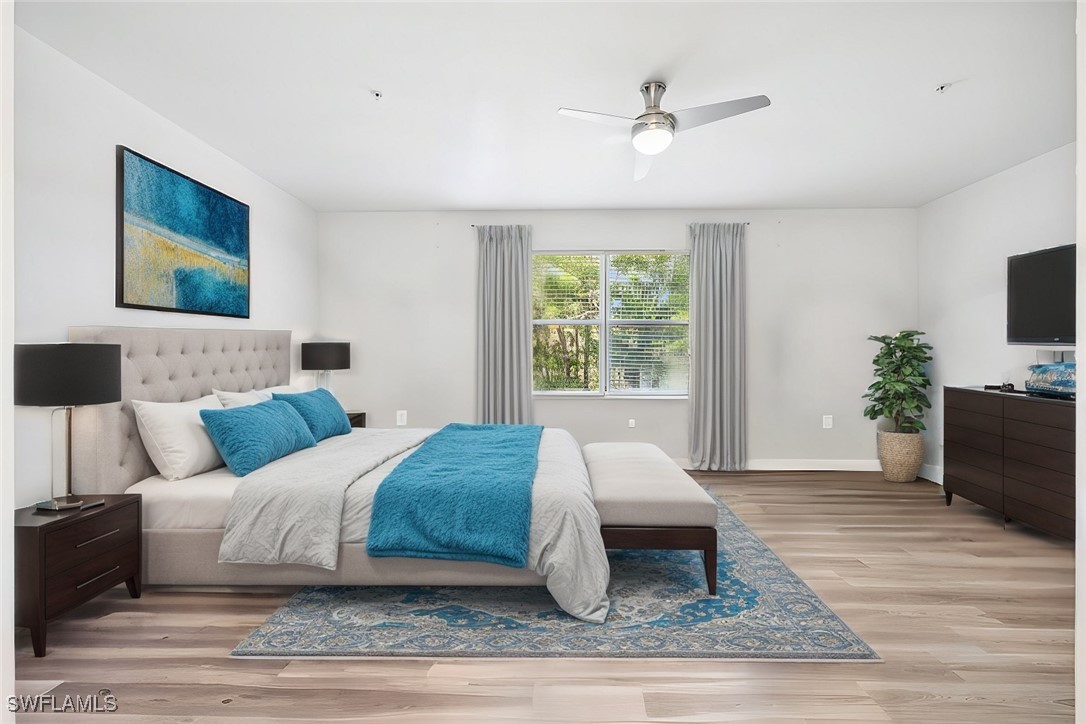
Live the Ultimate Active Lifestyle in Shadow Wood Preserve! Welcome to 18920 Bay Woods Lake Dr. #103, a completely renovated 3-bedroom, 2-bathroom condo that offers effortless, first-floor living in the highly desirable Shadow Wood Preserve community. Nestled within a prestigious, gated enclave, this turnkey home blends modern elegance with an unparalleled active lifestyle, making it the perfect place to call home. This first-floor end-unit has been thoughtfully renovated from top to bottom, allowing you to move in with ease and enjoy a carefree, low-maintenance lifestyle. The brand-new luxury vinyl plank flooring in the bedrooms, freshly painted interiors, and stylish finishes create a bright, inviting atmosphere. The updated kitchen is both functional and beautiful, featuring new soft-close cabinetry, granite countertops, sleek stainless steel appliances, and a contemporary tile backsplash—perfect for home chefs and entertainers alike. The open-concept design flows seamlessly into the dining and living areas, offering plenty of space to relax and host guests. The spacious master suite is a private retreat, complete with two large walk-in closets and a fully updated en-suite bathroom boasting a frameless glass walk-in shower, a deep soaking tub, and an upgraded dual-sink vanity. The two additional bedrooms offer versatility—ideal for guests, a home office, or a personal gym. Say goodbye to stairs and elevators—this first-floor condo offers the ultimate convenience, with easy access to your attached one-car garage for private parking and additional storage. Whether you're bringing in groceries, heading out for a morning walk, or returning from an evening at the club, you'll appreciate the ease of single-level living. Shadow Wood Preserve is more than just a neighborhood—it’s a vibrant, nature-filled retreat with endless opportunities for recreation and relaxation: Tennis, pickleball, and bocce courts to stay active and socialize. Private canoe and kayak launch along Mullock Creek, offering direct access to Estero Bay for peaceful paddling. Fishing pier and scenic walking trails winding through lush preserves, perfect for nature lovers. Resort-style community pool and spa, just steps away, providing the perfect place to unwind. For those who enjoy championship golf and luxury amenities, optional memberships are available at: Shadow Wood Country Club, featuring 54 holes of world-class golf, practice facilities, two clubhouses, and a tennis center. The Commons Club, which includes private beach access on Little Hickory Island, a state-of-the-art fitness and lifestyle center, and fine dining at The Bay Club. Located just minutes from Coconut Point, RSW Airport, Gulf beaches, and the best shopping and dining in Southwest Florida, this home is ideally situated for both relaxation and convenience. If you’re seeking a fully renovated, move-in-ready condo in a luxury, amenity-rich community, this is the perfect opportunity.
Build Your Team
Quickly find investor-friendly professionals who can help you succeed in real estate investing at any stage of the investing journey.


Agents
Match with investor-friendly agents who can help you find, analyze, and close your next deal


Lenders
Get the best funding…find investor-friendly lenders who specialize in your deal strategy


Property Managers
Transition to passive investing. Find a trusted property management partnership that lasts.


Tax Pros & Accountants
Taxes and financial reporting made easy—find experts to create tax savings strategies, file taxes, and more
Location
Property Details
Parking
- Description: Attached, Driveway, Garage, Paved, GarageDoorOpener
- Details: Attached, Driveway, Garage, Paved, Garage Door Opener
- Garage Spaces: 1
- Spaces Total: 0
Bedroom Information
- # of Bedrooms: 3
Bathroom Information
- # of Baths (Full): 2
- # of Baths (Total): 2.0
Interior Features
- # of Stories: 1
Exterior Features
- Roof Material: Tile
- Pool Community: Yes
HOA
- Has HOA: Yes
- HOA Fee: $998/quarterly
Land Information
- Land Use: Residential
- Land Use Subtype: Condominium Unit
Lot Information
- Parcel ID: 1746252700004.0103
- Lot Size: 0 sqft
Property Information
- Property Type: Condominium
- Style: Low Rise
- Year Built: 2004
Tax Information
- Annual Tax: $2,461
Utilities
- Water & Sewer: Public
- Heating: Central, Electric
- Cooling: Central Air, Ceiling Fan(s), Electric
Location
- County: Lee
Listing Details
Investment Summary
- Monthly Cash Flow
- -$358
- Cap Rate
- 4.8%
- Cash-on-Cash Return
- -5.9%
- Debt Coverage Ratio
- 0.78
- Internal Rate of Return (5 years)
- -1.8%
Cash Flow
Net Operating Income (NOI) minus mortgage payments.
Calculation:
NOI - Mortgage Payments
Cap Rate (Market Value)
Capitalization Rate is a rate of return that compares the yearly Net Operating Income (NOI) to the market value.
Calculation:
NOI / Market Value
Cash-on-Cash Return (CoC)
Annual Cash Flow / Cash Invested
Calculation:
Annual cash flow divided by initial cash invested.
Debt Coverage Ratio (DCR)
Net Operating Income (NOI) divided by total debt payments.
Calculation:
NOI / Total Debt Payments
Internal Rate of Return (IRR)
A metric for assessing profitability over time. IRR is the discount rate at which the net present value (NPV) of all future cash flows (positive and negative) from an investment equals zero — including both periodic cash flow (such as rent) and a projected sale at the end of the holding period. It represents the expected annualized return, accounting for income, expenses, and the recovery of capital through a future sale.
Purchase Details
Purchase PriceThe price paid for the property. Purchase price:
| $315,000 |
|---|---|
Amount FinancedThe amount of the purchase financed through a loan. Amount financed:
| -$252,000 |
Down paymentThe initial payment made towards the purchase. Down payment:
| $63,000 |
Closing CostsFees and expenses associated with purchasing a property, typically ranging from 2% to 5% of the home’s purchase price, paid at the end of a home purchase to cover services like lending, title transfer, and taxes. Closing costs:
| $9,450 |
Rehab CostsCosts incurred to repair or improve the property, including: roof, flooring, exterior siding, kitchen, exterior paint, bathrooms, etc. Rehab costs:
| $0 |
Initial Cash InvestedThe total initial cash invested in the property. Calculation:Down payment + Buying costs + Rehab costs Initial cash invested:
| $72,450 |
Square Feet (SQFT)The total square footage of the property. Square feet:
| 1,916 |
Cost Per Square FootCost per square foot of the property. Calculation:Purchase Price / Square Feet Cost per square foot:
| $164 |
Monthly Rent Per Square FootMonthly rent divided by the number of square feet. This ratio helps investors compare rental income efficiency across properties, markets, and unit sizes Calculation:Monthly Rent / Square Feet Monthly rent per square foot:
| $1.36 |
Financing Details
Loan AmountThe total sum of money borrowed from a lender to finance a property purchase. Calculation:Purchase Price - Down Payment
Loan amount:
| $252,000 |
|---|---|
Loan to Value Ratio (LTV)Loan amount divided by the market value of the property. Calculation:Loan Amount / Market Value
Loan to value ratio:
| 80.0% |
Loan TypeThe type of loan (e.g., fixed, adjustable).
Loan type:
| Amortizing |
TermThe loan repayment period in years.
Term:
| 30 years |
Interest RateThe percentage a lender charges on the borrowed amount of a loan, determining the cost of borrowing money.
Interest rate:
| 6.625% |
Principal & Interest (PI)The principal is the portion of the loan payment that reduces the loan balance. The interest is the lender's charge for borrowing money. Calculation:(P * r * (1 + r) ** n) / ((1 + r) ** n - 1) Where:
P = Loan amount (principal)
Principal & interest:
| $1,614 |
Property TaxesAnnual taxes levied by local governments on real estate properties. These taxes fund public services like schools, roads, and emergency services.
Property tax:
| $205 |
InsuranceThe costs for insurance coverage to protect against financial losses due to risks like fire, natural disasters, theft, liability, or tenant-related damages. Calculation:Assumes 7% of gross rental income, unless insurance rates are specified.
Insurance:
| $182 |
Private Mortgage Insurance (PMI)A fee that borrowers pay when they take out a conventional loan with a loan-to-value (LTV) ratio above 80%.
Private mortgage insurance (PMI):
| $0 |
Monthly PaymentThe fixed amount a borrower pays each month to repay a loan. It typically includes principal and interest (P&I) and may also cover property taxes, insurance, HOA fees, and PMI if escrowed. Monthly payment:
| $2,001 |
Operating Income
| % Rent | Monthly | Yearly | |
|---|---|---|---|
Gross RentThe total rental income received from tenants before deducting any expenses. Includes base rent, late fees, pet fees, parking fees, and other recurring charges.
Gross rent:
| $2,600 | $31,200 | |
Vacancy LossExpected loss of rent due to vacancies.
Vacancy loss:
(6%)
| 6% | -$156 | -$1,872 |
Operating IncomeGross rental income minus vacancy loss. Calculation:Gross rent - Vacancy loss
Operating income:
| $2,444 | $29,328 |
Operating Expenses
| % Rent | Monthly | Yearly | |
|---|---|---|---|
Property TaxesAnnual taxes levied by local governments on real estate properties. These taxes fund public services like schools, roads, and emergency services. | 8% | -$205 | -$2,461 |
InsuranceThe costs for insurance coverage to protect against financial losses due to risks like fire, natural disasters, theft, liability, or tenant-related damages. Calculation:Assumes 7% of gross rental income, unless insurance rates are specified. | 7% | -$182 | -$2,184 |
Property ManagementThe costs associated with hiring a property manager to handle the day-to-day operations of a rental property. Includes management fees, leasing fes, eviction fees, etc. Calculation:Assumes 8% of gross rental income. | 8% | -$208 | -$2,496 |
Repairs & MaintenanceOngoing costs for routine upkeep and minor fixes needed to keep a property in good working condition. Calculation:Assumes 5% of gross rental income. Varies by property age and condition. | 5% | -$130 | -$1,560 |
Capital ExpensesLarge, infrequent costs for major improvements or replacements, like a new roof, HVAC system, or appliances. Calculation:Assumes 5% of gross rental income. Varies by property age. | 5% | -$130 | -$1,560 |
HOA FeesRegular dues paid to a Homeowners Association for community maintenance, amenities, and management. Similar fees include: Condo Association Fees, Co-op Maintenance Fees, etc. | 13% | -$333 | -$3,996 |
Operating ExpensesRecurring costs required to maintain and manage a rental property, including property taxes, insurance, maintenance, repairs, utilities (if paid by the owner), property management fees, and other day-to-day expenses. Calculation:Insurance + Property Taxes + Property Management + Repairs & Maintenance + Capital Expenditures + HOA Fees | 46% | -$1,188 | -$14,257 |
Cash Flow
| Monthly | Yearly | |
|---|---|---|
Net Operating Income (NOI)The income generated from a property after deducting all operating expenses but before deducting mortgage payments, taxes, and capital expenditures. Calculation:Gross Operating Income - Operating Expenses
Net operating income:
| $1,256 | $15,072 |
Mortgage PaymentThe fixed amount a borrower pays each month to repay a loan. It typically includes principal and interest (P&I) and may also cover property taxes, insurance, HOA fees, and PMI if escrowed. | -$1,614 | -$19,368 |
Cash FlowNet Operating Income (NOI) minus mortgage payments. Calculation:NOI - Mortgage Payments | $358 | $4,296 |