
$719,000
Investment Summary
- Monthly Cash Flow
- -$2,140
- Cap Rate
- 2.7%
- Cash-on-Cash Return
- -15.5%
- Debt Coverage Ratio
- 0.43
- Internal Rate of Return (5 years)
- -11.0%
Cash Flow
Net Operating Income (NOI) minus mortgage payments.
Calculation:
NOI - Mortgage Payments
Cap Rate (Market Value)
Capitalization Rate is a rate of return that compares the yearly Net Operating Income (NOI) to the market value.
Calculation:
NOI / Market Value
Cash-on-Cash Return (CoC)
Annual Cash Flow / Cash Invested
Calculation:
Annual cash flow divided by initial cash invested.
Debt Coverage Ratio (DCR)
Net Operating Income (NOI) divided by total debt payments.
Calculation:
NOI / Total Debt Payments
Internal Rate of Return (IRR)
A metric for assessing profitability over time. IRR is the discount rate at which the net present value (NPV) of all future cash flows (positive and negative) from an investment equals zero — including both periodic cash flow (such as rent) and a projected sale at the end of the holding period. It represents the expected annualized return, accounting for income, expenses, and the recovery of capital through a future sale.
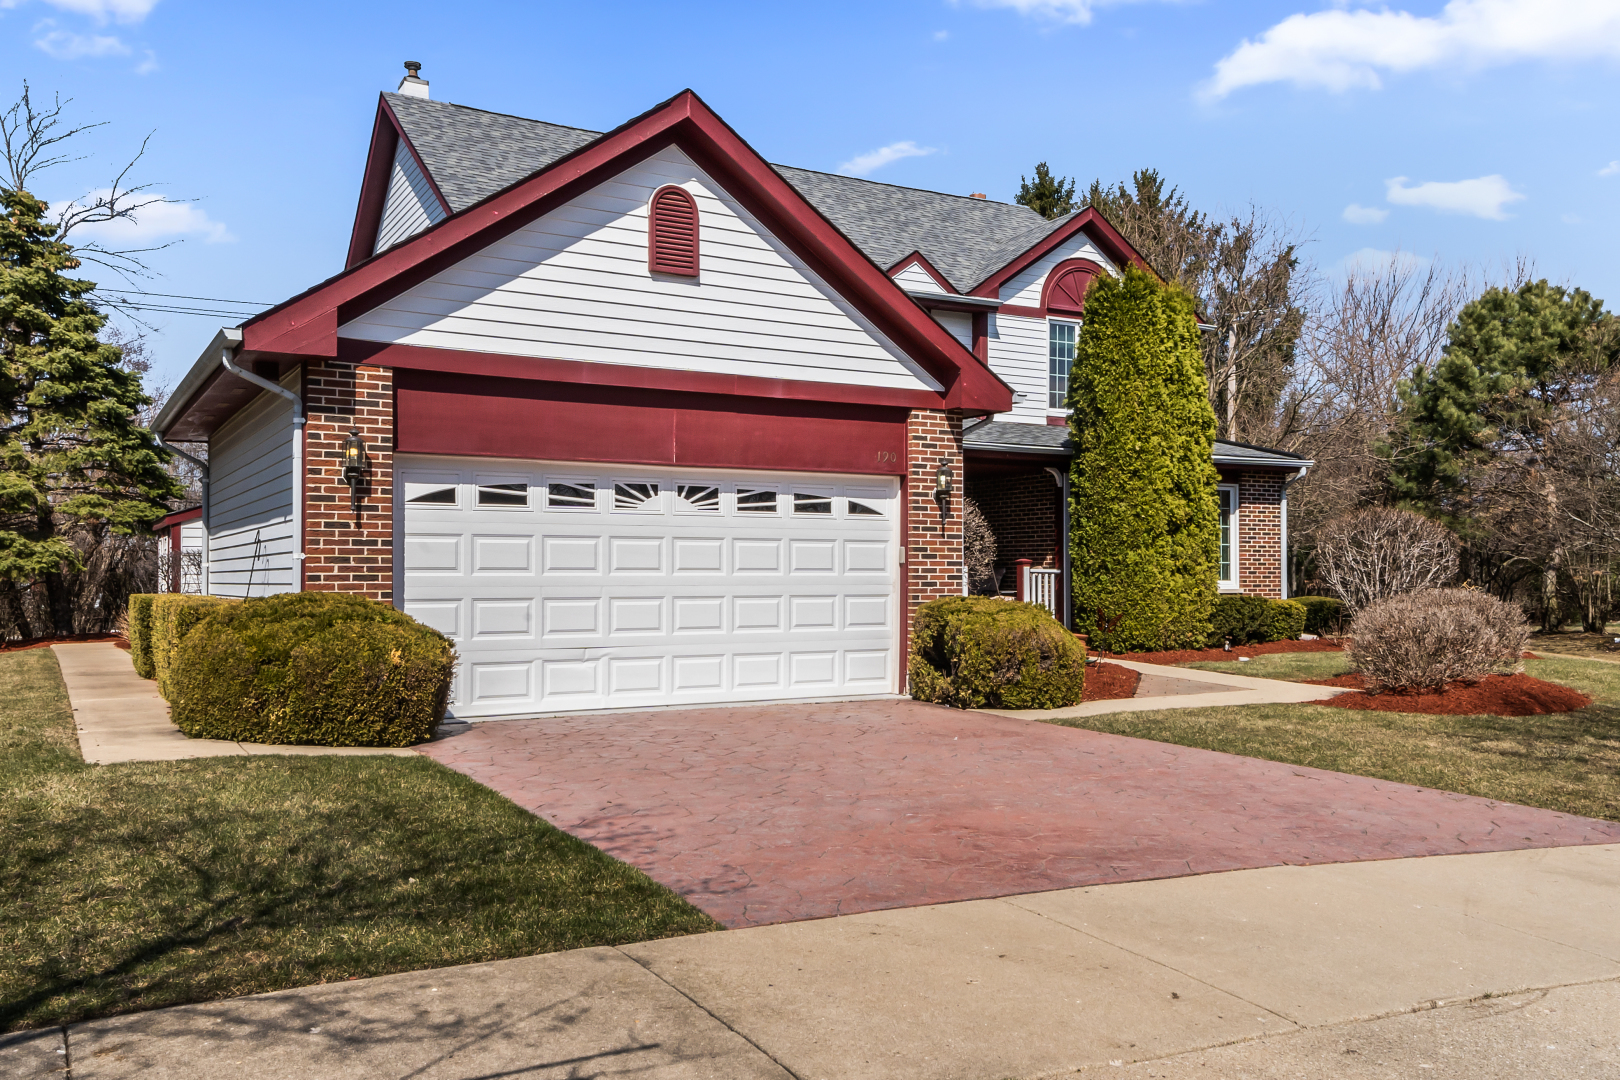
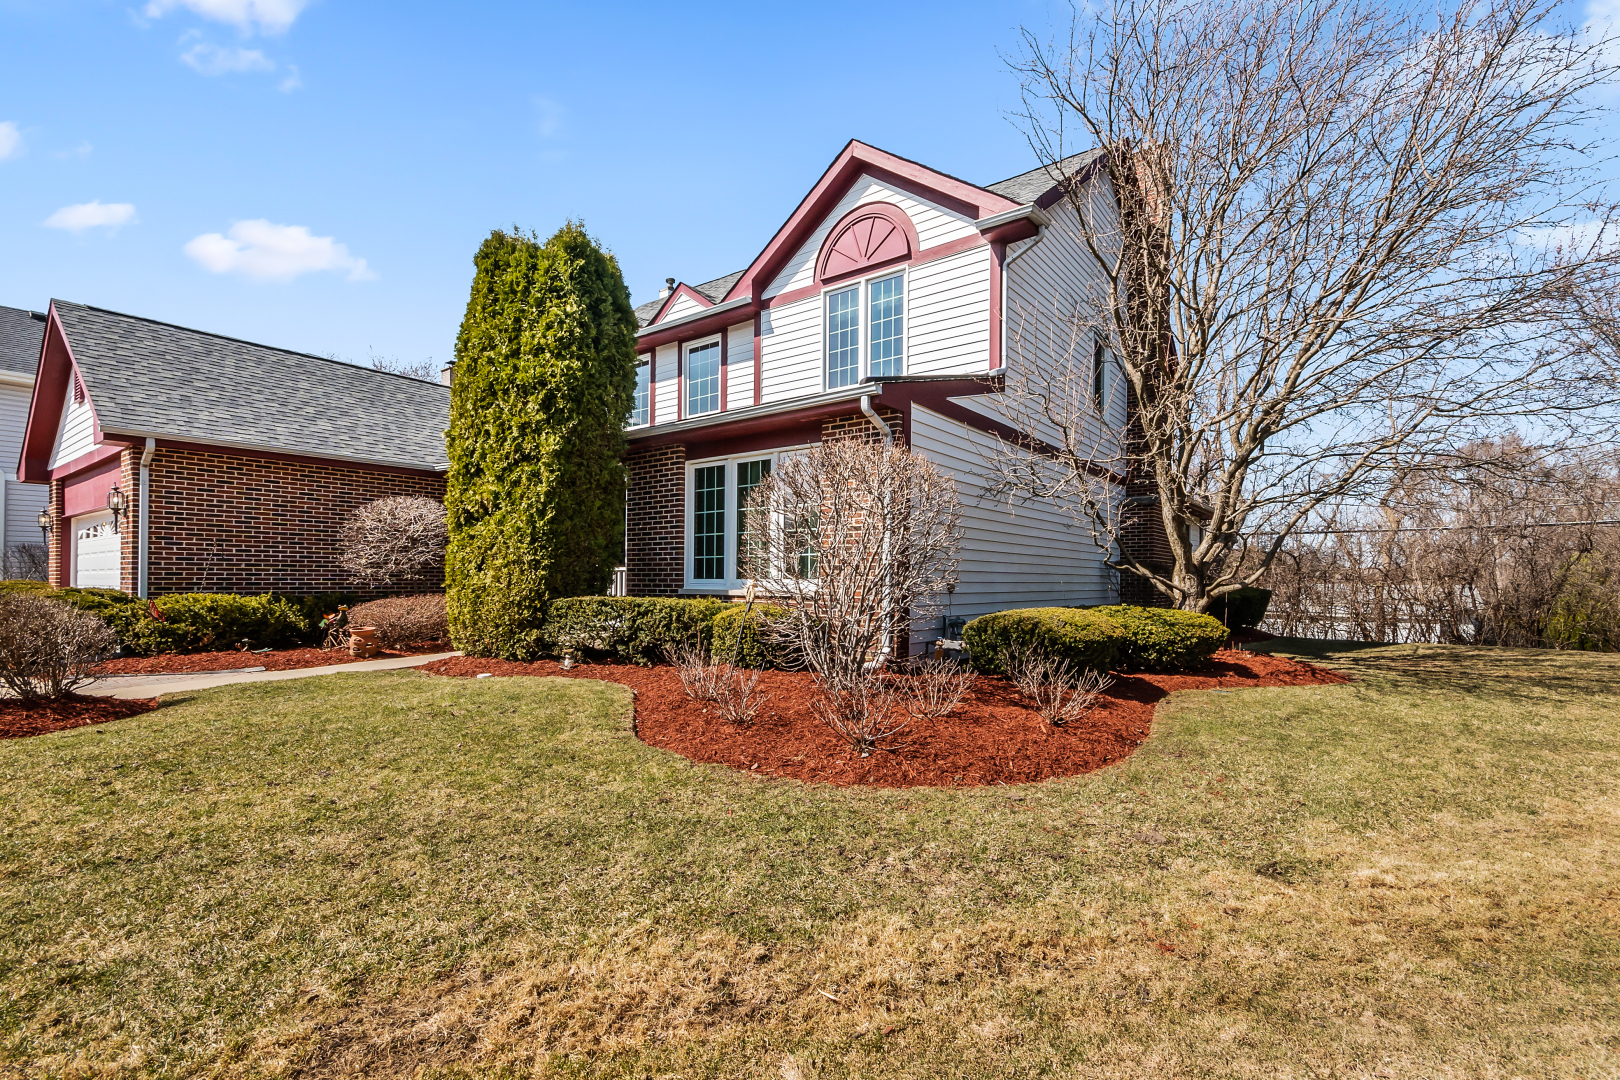
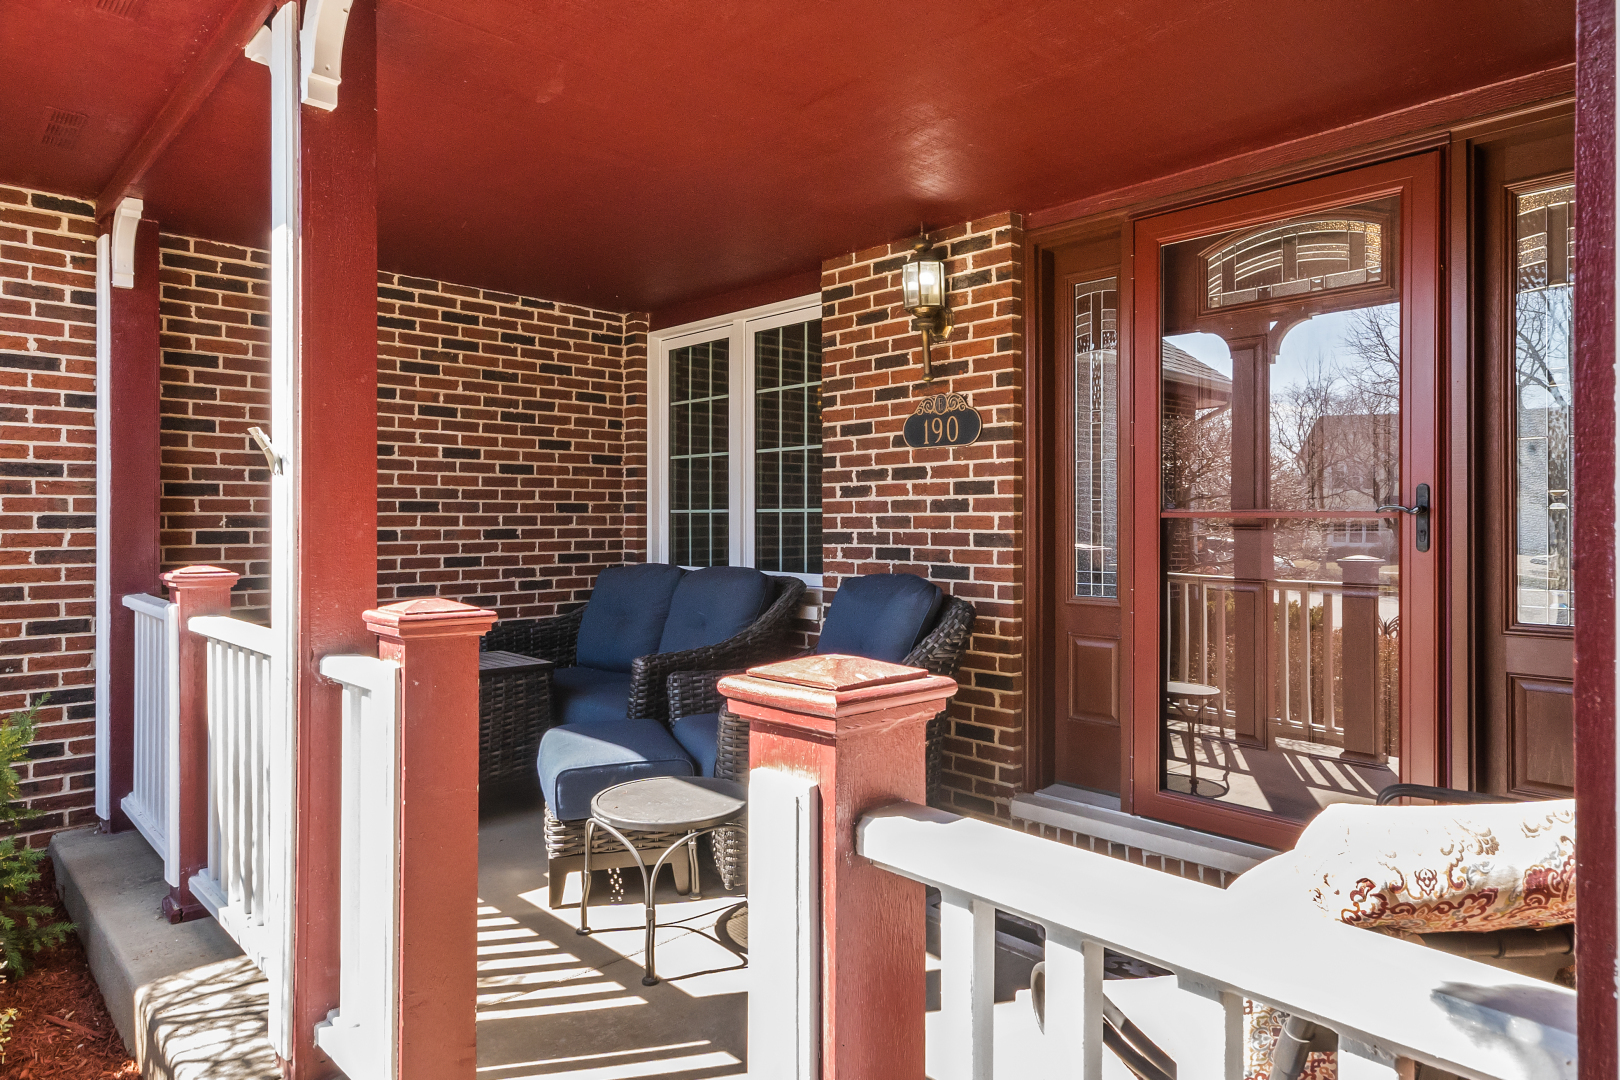
Property Description
Welcome to this beautifully and thoughtfully updated custom home offering incredible space, natural light, and elevated finishes throughout. Ideally located on a quiet cul-de-sac and backing up to scenic Indian Creek, this home enjoys both privacy and a peaceful natural setting. A gracious marble-floored foyer welcomes you with a spacious coat closet and warm wood details, setting the tone for the home's timeless style. From there, step into the sun-filled living room, featuring recessed lighting and a large picture window that frames the gorgeous front garden. The formal dining room is well-proportioned, with plenty of room for a table of twelve, perfect for gatherings. The heart of the home is an expansive eat-in kitchen-tailor-made for cooks and entertainers alike. It features custom soft-close cabinetry, granite countertops, a stone backsplash, under-cabinet lighting, and abundant prep space. A center island offers additional functionality, while sliding glass doors from the breakfast area open to the backyard patio for effortless indoor-outdoor living. The first-floor family room addition is a true showstopper, showcasing vaulted ceilings with exposed wood trusses, a dramatic wall of architectural windows that flood the space with natural light, a gas fireplace, and built-in speakers. The generous layout provides ample room for multiple seating areas, making it perfect for entertaining or cozy nights in. Warm wood trim and large picture windows frame serene views of the surrounding landscape, enhancing the room's sense of openness and connection to nature. A first-floor laundry room, powder room, and attached two-car garage provide everyday convenience and function. Upstairs, the bright and airy king-size primary suite offers vaulted ceilings, two walk-in closets with custom organizers, and a spa-like bath with a whirlpool tub, separate shower, and a beautifully designed dual-sink vanity. Three additional spacious bedrooms share a full bath with a double vanity. The fully finished basement boasts 9-foot ceilings and is designed for flexibility and fun, with a rec/media space, game area, home gym, full bath, and a potential fifth bedroom or office, along with abundant storage. Enjoy the large backyard-professionally landscaped and equipped with an irrigation system-featuring a fantastic patio with a 2021 hot tub, gas line for grilling, and outdoor seating for relaxing or entertaining. This home is truly move-in ready, with recent improvements that include fresh paint in modern neutral tones throughout the first and second floors, brand new carpet, solid core interior doors, updated recessed lighting, a recent roof (2016), and updated windows (2012). Located in the sought-after Hawthorn Club subdivision, you'll enjoy access to playgrounds, tennis and pickleball courts, walking/bike paths, and a basketball court. Close to the Vernon Hills Municipal Golf Course, picturesque Sullivan Woods, and just a short walk to the Vernon Hills Metra station for easy commutes into the city.
Build Your Team
Quickly find investor-friendly professionals who can help you succeed in real estate investing at any stage of the investing journey.


Agents
Match with investor-friendly agents who can help you find, analyze, and close your next deal


Lenders
Get the best funding…find investor-friendly lenders who specialize in your deal strategy


Property Managers
Transition to passive investing. Find a trusted property management partnership that lasts.


Tax Pros & Accountants
Taxes and financial reporting made easy—find experts to create tax savings strategies, file taxes, and more
Location
Property Details
Parking
- Description: Garage
- Details: Garage Door Opener, On Site, Attached, Garage
- Garage Spaces: 2
- Spaces Total: 2
Bedroom Information
- # of Bedrooms: 4
Bathroom Information
- # of Baths (Full): 3
- # of Baths (Total): 4.0
Interior Features
- # of Rooms: 12
- # of Stories: 2
- Basement: Yes
- Basement Description: Finished, Concrete, Storage Space, Full
- Fireplace: Yes
Land Information
- Land Use: Residential
- Land Use Subtype: Single Family Residential
Lot Information
- Parcel ID: 1508218009
- Lot Size: 0 sqft
Property Information
- Property Type: Single Family Residence
- Year Built: 1993
Tax Information
- Annual Tax: $12,927
Utilities
- Water & Sewer: Public
- Heating: Forced Air
- Cooling: Central Air
Location
- County: Lake
Listing Details
Investment Summary
- Monthly Cash Flow
- -$2,140
- Cap Rate
- 2.7%
- Cash-on-Cash Return
- -15.5%
- Debt Coverage Ratio
- 0.43
- Internal Rate of Return (5 years)
- -11.0%
Cash Flow
Net Operating Income (NOI) minus mortgage payments.
Calculation:
NOI - Mortgage Payments
Cap Rate (Market Value)
Capitalization Rate is a rate of return that compares the yearly Net Operating Income (NOI) to the market value.
Calculation:
NOI / Market Value
Cash-on-Cash Return (CoC)
Annual Cash Flow / Cash Invested
Calculation:
Annual cash flow divided by initial cash invested.
Debt Coverage Ratio (DCR)
Net Operating Income (NOI) divided by total debt payments.
Calculation:
NOI / Total Debt Payments
Internal Rate of Return (IRR)
A metric for assessing profitability over time. IRR is the discount rate at which the net present value (NPV) of all future cash flows (positive and negative) from an investment equals zero — including both periodic cash flow (such as rent) and a projected sale at the end of the holding period. It represents the expected annualized return, accounting for income, expenses, and the recovery of capital through a future sale.
Purchase Details
Purchase PriceThe price paid for the property. Purchase price:
| $719,000 |
|---|---|
Amount FinancedThe amount of the purchase financed through a loan. Amount financed:
| -$575,200 |
Down paymentThe initial payment made towards the purchase. Down payment:
| $143,800 |
Closing CostsFees and expenses associated with purchasing a property, typically ranging from 2% to 5% of the home’s purchase price, paid at the end of a home purchase to cover services like lending, title transfer, and taxes. Closing costs:
| $21,570 |
Rehab CostsCosts incurred to repair or improve the property, including: roof, flooring, exterior siding, kitchen, exterior paint, bathrooms, etc. Rehab costs:
| $0 |
Initial Cash InvestedThe total initial cash invested in the property. Calculation:Down payment + Buying costs + Rehab costs Initial cash invested:
| $165,370 |
Square Feet (SQFT)The total square footage of the property. Square feet:
| 3,940 |
Cost Per Square FootCost per square foot of the property. Calculation:Purchase Price / Square Feet Cost per square foot:
| $182 |
Monthly Rent Per Square FootMonthly rent divided by the number of square feet. This ratio helps investors compare rental income efficiency across properties, markets, and unit sizes Calculation:Monthly Rent / Square Feet Monthly rent per square foot:
| $0.99 |
Financing Details
Loan AmountThe total sum of money borrowed from a lender to finance a property purchase. Calculation:Purchase Price - Down Payment
Loan amount:
| $575,200 |
|---|---|
Loan to Value Ratio (LTV)Loan amount divided by the market value of the property. Calculation:Loan Amount / Market Value
Loan to value ratio:
| 80.0% |
Loan TypeThe type of loan (e.g., fixed, adjustable).
Loan type:
| Amortizing |
TermThe loan repayment period in years.
Term:
| 30 years |
Interest RateThe percentage a lender charges on the borrowed amount of a loan, determining the cost of borrowing money.
Interest rate:
| 6.810% |
Principal & Interest (PI)The principal is the portion of the loan payment that reduces the loan balance. The interest is the lender's charge for borrowing money. Calculation:(P * r * (1 + r) ** n) / ((1 + r) ** n - 1) Where:
P = Loan amount (principal)
Principal & interest:
| $3,754 |
Property TaxesAnnual taxes levied by local governments on real estate properties. These taxes fund public services like schools, roads, and emergency services.
Property tax:
| $1,077 |
InsuranceThe costs for insurance coverage to protect against financial losses due to risks like fire, natural disasters, theft, liability, or tenant-related damages. Calculation:Assumes 7% of gross rental income, unless insurance rates are specified.
Insurance:
| $273 |
Private Mortgage Insurance (PMI)A fee that borrowers pay when they take out a conventional loan with a loan-to-value (LTV) ratio above 80%.
Private mortgage insurance (PMI):
| $0 |
Monthly PaymentThe fixed amount a borrower pays each month to repay a loan. It typically includes principal and interest (P&I) and may also cover property taxes, insurance, HOA fees, and PMI if escrowed. Monthly payment:
| $5,104 |
Operating Income
| % Rent | Monthly | Yearly | |
|---|---|---|---|
Gross RentThe total rental income received from tenants before deducting any expenses. Includes base rent, late fees, pet fees, parking fees, and other recurring charges.
Gross rent:
| $3,900 | $46,800 | |
Vacancy LossExpected loss of rent due to vacancies.
Vacancy loss:
(6%)
| 6% | -$234 | -$2,808 |
Operating IncomeGross rental income minus vacancy loss. Calculation:Gross rent - Vacancy loss
Operating income:
| $3,666 | $43,992 |
Operating Expenses
| % Rent | Monthly | Yearly | |
|---|---|---|---|
Property TaxesAnnual taxes levied by local governments on real estate properties. These taxes fund public services like schools, roads, and emergency services. | 28% | -$1,077 | -$12,927 |
InsuranceThe costs for insurance coverage to protect against financial losses due to risks like fire, natural disasters, theft, liability, or tenant-related damages. Calculation:Assumes 7% of gross rental income, unless insurance rates are specified. | 7% | -$273 | -$3,276 |
Property ManagementThe costs associated with hiring a property manager to handle the day-to-day operations of a rental property. Includes management fees, leasing fes, eviction fees, etc. Calculation:Assumes 8% of gross rental income. | 8% | -$312 | -$3,744 |
Repairs & MaintenanceOngoing costs for routine upkeep and minor fixes needed to keep a property in good working condition. Calculation:Assumes 5% of gross rental income. Varies by property age and condition. | 5% | -$195 | -$2,340 |
Capital ExpensesLarge, infrequent costs for major improvements or replacements, like a new roof, HVAC system, or appliances. Calculation:Assumes 5% of gross rental income. Varies by property age. | 5% | -$195 | -$2,340 |
HOA FeesRegular dues paid to a Homeowners Association for community maintenance, amenities, and management. Similar fees include: Condo Association Fees, Co-op Maintenance Fees, etc. | n/a | n/a | n/a |
Operating ExpensesRecurring costs required to maintain and manage a rental property, including property taxes, insurance, maintenance, repairs, utilities (if paid by the owner), property management fees, and other day-to-day expenses. Calculation:Insurance + Property Taxes + Property Management + Repairs & Maintenance + Capital Expenditures + HOA Fees | 53% | -$2,052 | -$24,627 |
Cash Flow
| Monthly | Yearly | |
|---|---|---|
Net Operating Income (NOI)The income generated from a property after deducting all operating expenses but before deducting mortgage payments, taxes, and capital expenditures. Calculation:Gross Operating Income - Operating Expenses
Net operating income:
| $1,614 | $19,368 |
Mortgage PaymentThe fixed amount a borrower pays each month to repay a loan. It typically includes principal and interest (P&I) and may also cover property taxes, insurance, HOA fees, and PMI if escrowed. | -$3,754 | -$45,048 |
Cash FlowNet Operating Income (NOI) minus mortgage payments. Calculation:NOI - Mortgage Payments | $2,140 | $25,680 |