
$849,999
Investment Summary
- Monthly Cash Flow
- -$1,120
- Cap Rate
- 4.6%
- Cash-on-Cash Return
- -6.9%
- Debt Coverage Ratio
- 0.74
- Internal Rate of Return (5 years)
- -2.7%
Cash Flow
Net Operating Income (NOI) minus mortgage payments.
Calculation:
NOI - Mortgage Payments
Cap Rate (Market Value)
Capitalization Rate is a rate of return that compares the yearly Net Operating Income (NOI) to the market value.
Calculation:
NOI / Market Value
Cash-on-Cash Return (CoC)
Annual Cash Flow / Cash Invested
Calculation:
Annual cash flow divided by initial cash invested.
Debt Coverage Ratio (DCR)
Net Operating Income (NOI) divided by total debt payments.
Calculation:
NOI / Total Debt Payments
Internal Rate of Return (IRR)
A metric for assessing profitability over time. IRR is the discount rate at which the net present value (NPV) of all future cash flows (positive and negative) from an investment equals zero — including both periodic cash flow (such as rent) and a projected sale at the end of the holding period. It represents the expected annualized return, accounting for income, expenses, and the recovery of capital through a future sale.
Property Description
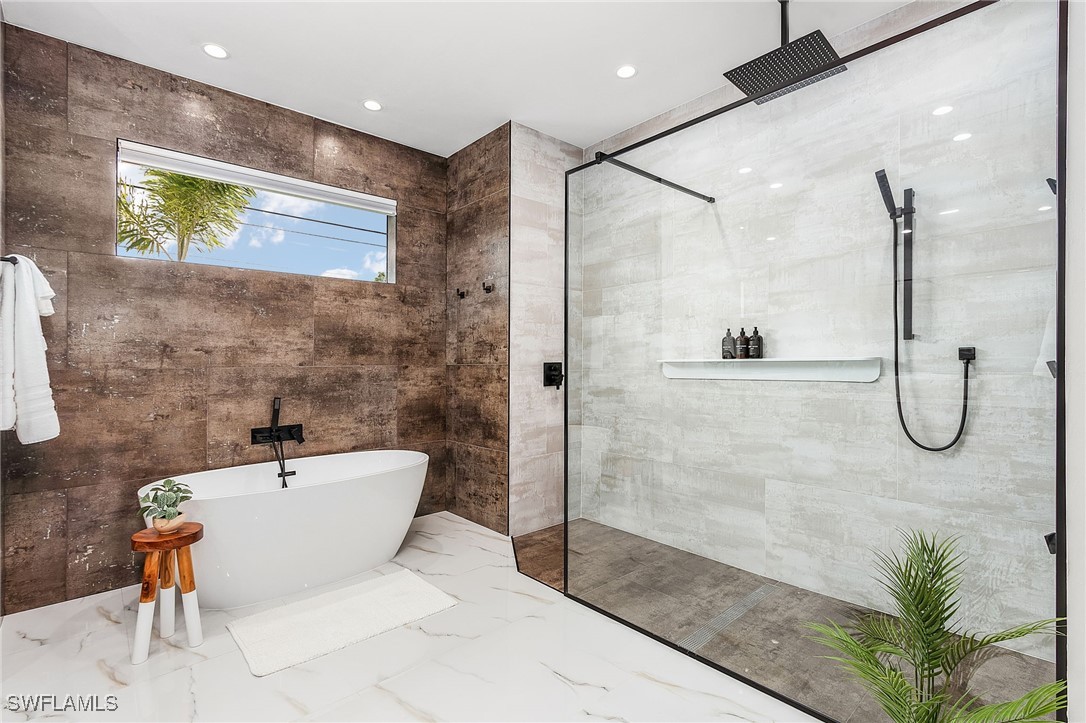
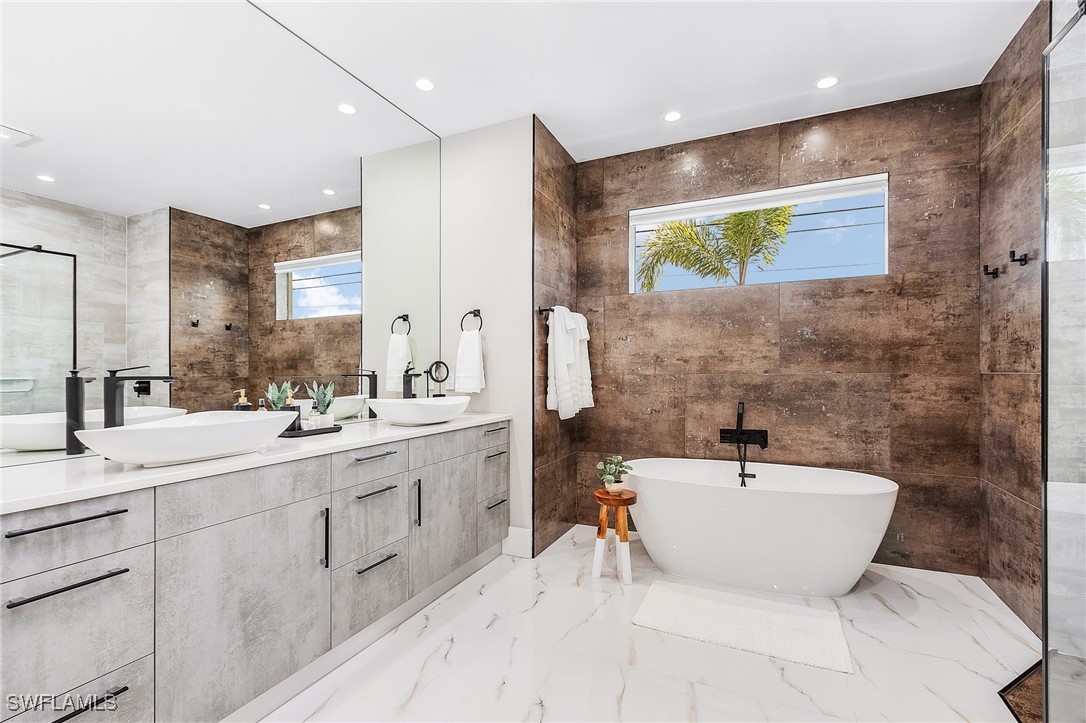
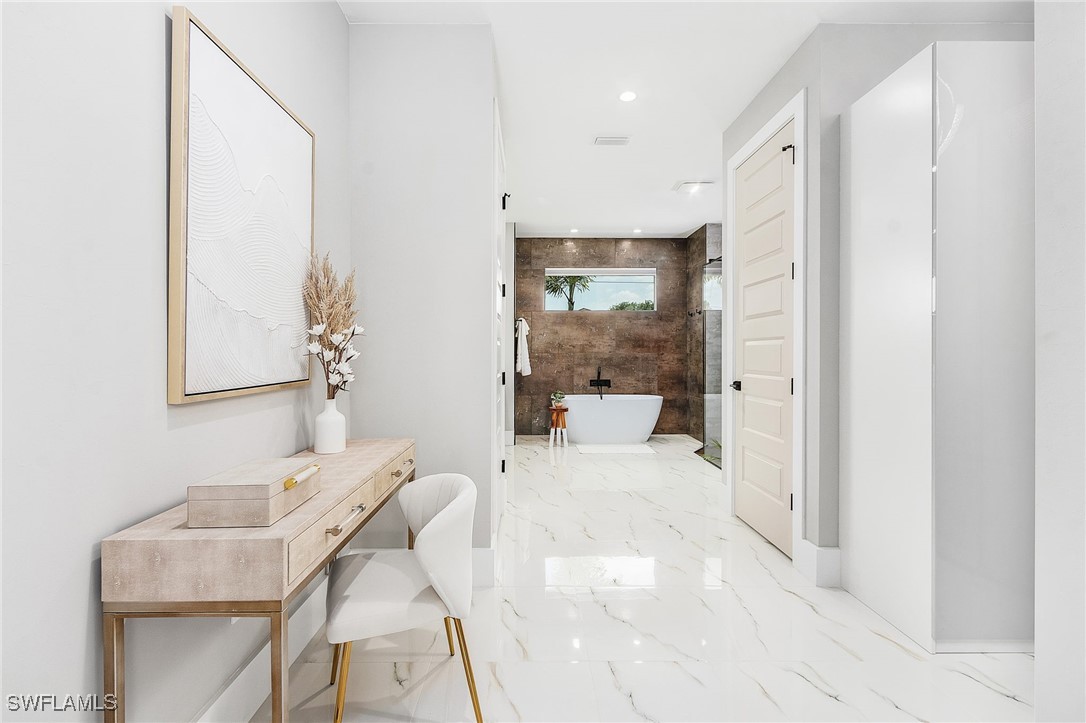
This extraordinary 2021-built Gulf Access pool home is a true masterpiece of modern luxury, designed to impress from the moment you arrive. Unlike anything else on the market, this is not your typical spec home—it is a statement of elegance and sophistication, with high-end finishes, designer furnishings, and architectural details that set it apart. The striking modern façade, sleek lines, and impeccable curb appeal will immediately catch your eye, leaving you eager to see what awaits inside. Step through the contemporary double front doors into a breathtaking great room that will stop you in your tracks. A dramatic floor-to-ceiling fireplace wall creates an unforgettable focal point, while a wall of sliders seamlessly merges indoor and outdoor living, framing picturesque views of the pool, lanai, and Gulf-access canal. The heart of the home is a kitchen designed for those who appreciate both style and function. The solid surface waterfall island is a true showpiece, offering ample space for meal prep, entertaining, or casual dining. Frameless European cabinetry provides a sleek, modern aesthetic with abundant storage, while high-end appliances and exquisite finishes elevate the space to a chef’s dream. Open to both the living and dining areas, this layout ensures you’re always part of the conversation. The master suite is nothing short of spectacular—spacious, refined, and designed to indulge. A tray ceiling with LED lighting adds an ambient glow, while the fully custom walk-in closet provides organization with a touch of luxury. The spa-like ensuite is designed for relaxation, featuring dual sinks, a stunning accent wall behind a soaking tub, and an oversized walk-in shower that feels like a personal retreat. Sliding doors offer private access to the lanai, creating a seamless flow between indoor comfort and outdoor tranquility. On the opposite side of the home, two generously sized guest bedrooms share a beautifully appointed full bath, providing privacy and comfort for family or visitors. The outdoor living space is an entertainer’s dream, straight out of a high-end design magazine. A tongue-and-groove wood ceiling adds warmth and sophistication to the lanai, while the fully equipped outdoor kitchen invites alfresco dining at its finest. The heated saltwater pool is the perfect escape from the Florida sun, overlooking the peaceful saltwater canal with just the right touch of tropical landscaping for added privacy while still preserving the view. Additional features include an indoor laundry room and an attached two-car garage. This home is the epitome of modern coastal luxury, blending breathtaking design with the ultimate in comfort and convenience. Schedule your private tour today and experience the difference of a home that stands in a class of its own. Furniture Package available so you could buy this home furnished and turn key ready!
Build Your Team
Quickly find investor-friendly professionals who can help you succeed in real estate investing at any stage of the investing journey.


Agents
Match with investor-friendly agents who can help you find, analyze, and close your next deal


Lenders
Get the best funding…find investor-friendly lenders who specialize in your deal strategy


Property Managers
Transition to passive investing. Find a trusted property management partnership that lasts.


Tax Pros & Accountants
Taxes and financial reporting made easy—find experts to create tax savings strategies, file taxes, and more
Location
Property Details
Parking
- Description: Assigned, Attached, Driveway, Garage, Paved, TwoSpaces, GarageDoorOpener
- Details: Assigned, Attached, Driveway, Garage, Paved, Garage Door Opener
- Garage Spaces: 2
- Spaces Total: 0
Bedroom Information
- # of Bedrooms: 3
Bathroom Information
- # of Baths (Full): 2
- # of Baths (Partial): 1
- # of Baths (Total): 3.0
Interior Features
- # of Stories: 1
Exterior Features
- Exterior Walls Materials: Stucco
- Roof Type: IRR/Cathedral
- Roof Material: Shingle
- Pool: Yes
Land Information
- Land Use: Residential
- Land Use Subtype: Single Family Residential
Lot Information
- Parcel ID: 334423C306063.0340
- Lot Size: 0 sqft
Property Information
- Property Type: Single Family Residence
- Style: Contemporary, Ranch, One Story
- Year Built: 2021
Tax Information
- Annual Tax: $12,523
Utilities
- Water & Sewer: Public
- Heating: Central, Electric
- Cooling: Central Air, Ceiling Fan(s), Electric
Location
- County: Lee
Listing Details
Investment Summary
- Monthly Cash Flow
- -$1,120
- Cap Rate
- 4.6%
- Cash-on-Cash Return
- -6.9%
- Debt Coverage Ratio
- 0.74
- Internal Rate of Return (5 years)
- -2.7%
Cash Flow
Net Operating Income (NOI) minus mortgage payments.
Calculation:
NOI - Mortgage Payments
Cap Rate (Market Value)
Capitalization Rate is a rate of return that compares the yearly Net Operating Income (NOI) to the market value.
Calculation:
NOI / Market Value
Cash-on-Cash Return (CoC)
Annual Cash Flow / Cash Invested
Calculation:
Annual cash flow divided by initial cash invested.
Debt Coverage Ratio (DCR)
Net Operating Income (NOI) divided by total debt payments.
Calculation:
NOI / Total Debt Payments
Internal Rate of Return (IRR)
A metric for assessing profitability over time. IRR is the discount rate at which the net present value (NPV) of all future cash flows (positive and negative) from an investment equals zero — including both periodic cash flow (such as rent) and a projected sale at the end of the holding period. It represents the expected annualized return, accounting for income, expenses, and the recovery of capital through a future sale.
Purchase Details
Purchase PriceThe price paid for the property. Purchase price:
| $849,999 |
|---|---|
Amount FinancedThe amount of the purchase financed through a loan. Amount financed:
| -$679,999 |
Down paymentThe initial payment made towards the purchase. Down payment:
| $170,000 |
Closing CostsFees and expenses associated with purchasing a property, typically ranging from 2% to 5% of the home’s purchase price, paid at the end of a home purchase to cover services like lending, title transfer, and taxes. Closing costs:
| $25,500 |
Rehab CostsCosts incurred to repair or improve the property, including: roof, flooring, exterior siding, kitchen, exterior paint, bathrooms, etc. Rehab costs:
| $0 |
Initial Cash InvestedThe total initial cash invested in the property. Calculation:Down payment + Buying costs + Rehab costs Initial cash invested:
| $195,500 |
Square Feet (SQFT)The total square footage of the property. Square feet:
| 2,013 |
Cost Per Square FootCost per square foot of the property. Calculation:Purchase Price / Square Feet Cost per square foot:
| $422 |
Monthly Rent Per Square FootMonthly rent divided by the number of square feet. This ratio helps investors compare rental income efficiency across properties, markets, and unit sizes Calculation:Monthly Rent / Square Feet Monthly rent per square foot:
| $3.08 |
Financing Details
Loan AmountThe total sum of money borrowed from a lender to finance a property purchase. Calculation:Purchase Price - Down Payment
Loan amount:
| $679,999 |
|---|---|
Loan to Value Ratio (LTV)Loan amount divided by the market value of the property. Calculation:Loan Amount / Market Value
Loan to value ratio:
| 80.0% |
Loan TypeThe type of loan (e.g., fixed, adjustable).
Loan type:
| Amortizing |
TermThe loan repayment period in years.
Term:
| 30 years |
Interest RateThe percentage a lender charges on the borrowed amount of a loan, determining the cost of borrowing money.
Interest rate:
| 6.625% |
Principal & Interest (PI)The principal is the portion of the loan payment that reduces the loan balance. The interest is the lender's charge for borrowing money. Calculation:(P * r * (1 + r) ** n) / ((1 + r) ** n - 1) Where:
P = Loan amount (principal)
Principal & interest:
| $4,354 |
Property TaxesAnnual taxes levied by local governments on real estate properties. These taxes fund public services like schools, roads, and emergency services.
Property tax:
| $1,044 |
InsuranceThe costs for insurance coverage to protect against financial losses due to risks like fire, natural disasters, theft, liability, or tenant-related damages. Calculation:Assumes 7% of gross rental income, unless insurance rates are specified.
Insurance:
| $434 |
Private Mortgage Insurance (PMI)A fee that borrowers pay when they take out a conventional loan with a loan-to-value (LTV) ratio above 80%.
Private mortgage insurance (PMI):
| $0 |
Monthly PaymentThe fixed amount a borrower pays each month to repay a loan. It typically includes principal and interest (P&I) and may also cover property taxes, insurance, HOA fees, and PMI if escrowed. Monthly payment:
| $5,832 |
Operating Income
| % Rent | Monthly | Yearly | |
|---|---|---|---|
Gross RentThe total rental income received from tenants before deducting any expenses. Includes base rent, late fees, pet fees, parking fees, and other recurring charges.
Gross rent:
| $6,200 | $74,400 | |
Vacancy LossExpected loss of rent due to vacancies.
Vacancy loss:
(6%)
| 6% | -$372 | -$4,464 |
Operating IncomeGross rental income minus vacancy loss. Calculation:Gross rent - Vacancy loss
Operating income:
| $5,828 | $69,936 |
Operating Expenses
| % Rent | Monthly | Yearly | |
|---|---|---|---|
Property TaxesAnnual taxes levied by local governments on real estate properties. These taxes fund public services like schools, roads, and emergency services. | 17% | -$1,044 | -$12,524 |
InsuranceThe costs for insurance coverage to protect against financial losses due to risks like fire, natural disasters, theft, liability, or tenant-related damages. Calculation:Assumes 7% of gross rental income, unless insurance rates are specified. | 7% | -$434 | -$5,208 |
Property ManagementThe costs associated with hiring a property manager to handle the day-to-day operations of a rental property. Includes management fees, leasing fes, eviction fees, etc. Calculation:Assumes 8% of gross rental income. | 8% | -$496 | -$5,952 |
Repairs & MaintenanceOngoing costs for routine upkeep and minor fixes needed to keep a property in good working condition. Calculation:Assumes 5% of gross rental income. Varies by property age and condition. | 5% | -$310 | -$3,720 |
Capital ExpensesLarge, infrequent costs for major improvements or replacements, like a new roof, HVAC system, or appliances. Calculation:Assumes 5% of gross rental income. Varies by property age. | 5% | -$310 | -$3,720 |
HOA FeesRegular dues paid to a Homeowners Association for community maintenance, amenities, and management. Similar fees include: Condo Association Fees, Co-op Maintenance Fees, etc. | n/a | n/a | n/a |
Operating ExpensesRecurring costs required to maintain and manage a rental property, including property taxes, insurance, maintenance, repairs, utilities (if paid by the owner), property management fees, and other day-to-day expenses. Calculation:Insurance + Property Taxes + Property Management + Repairs & Maintenance + Capital Expenditures + HOA Fees | 42% | -$2,594 | -$31,124 |
Cash Flow
| Monthly | Yearly | |
|---|---|---|
Net Operating Income (NOI)The income generated from a property after deducting all operating expenses but before deducting mortgage payments, taxes, and capital expenditures. Calculation:Gross Operating Income - Operating Expenses
Net operating income:
| $3,234 | $38,808 |
Mortgage PaymentThe fixed amount a borrower pays each month to repay a loan. It typically includes principal and interest (P&I) and may also cover property taxes, insurance, HOA fees, and PMI if escrowed. | -$4,354 | -$52,248 |
Cash FlowNet Operating Income (NOI) minus mortgage payments. Calculation:NOI - Mortgage Payments | $1,120 | $13,440 |