$1,185,000
Investment Summary
- Monthly Cash Flow
- -$4,016
- Cap Rate
- 2.2%
- Cash-on-Cash Return
- -17.7%
- Debt Coverage Ratio
- 0.35
- Internal Rate of Return (5 years)
- -13.1%
Cash Flow
Net Operating Income (NOI) minus mortgage payments.
Calculation:
NOI - Mortgage Payments
Cap Rate (Market Value)
Capitalization Rate is a rate of return that compares the yearly Net Operating Income (NOI) to the market value.
Calculation:
NOI / Market Value
Cash-on-Cash Return (CoC)
Annual Cash Flow / Cash Invested
Calculation:
Annual cash flow divided by initial cash invested.
Debt Coverage Ratio (DCR)
Net Operating Income (NOI) divided by total debt payments.
Calculation:
NOI / Total Debt Payments
Internal Rate of Return (IRR)
A metric for assessing profitability over time. IRR is the discount rate at which the net present value (NPV) of all future cash flows (positive and negative) from an investment equals zero — including both periodic cash flow (such as rent) and a projected sale at the end of the holding period. It represents the expected annualized return, accounting for income, expenses, and the recovery of capital through a future sale.
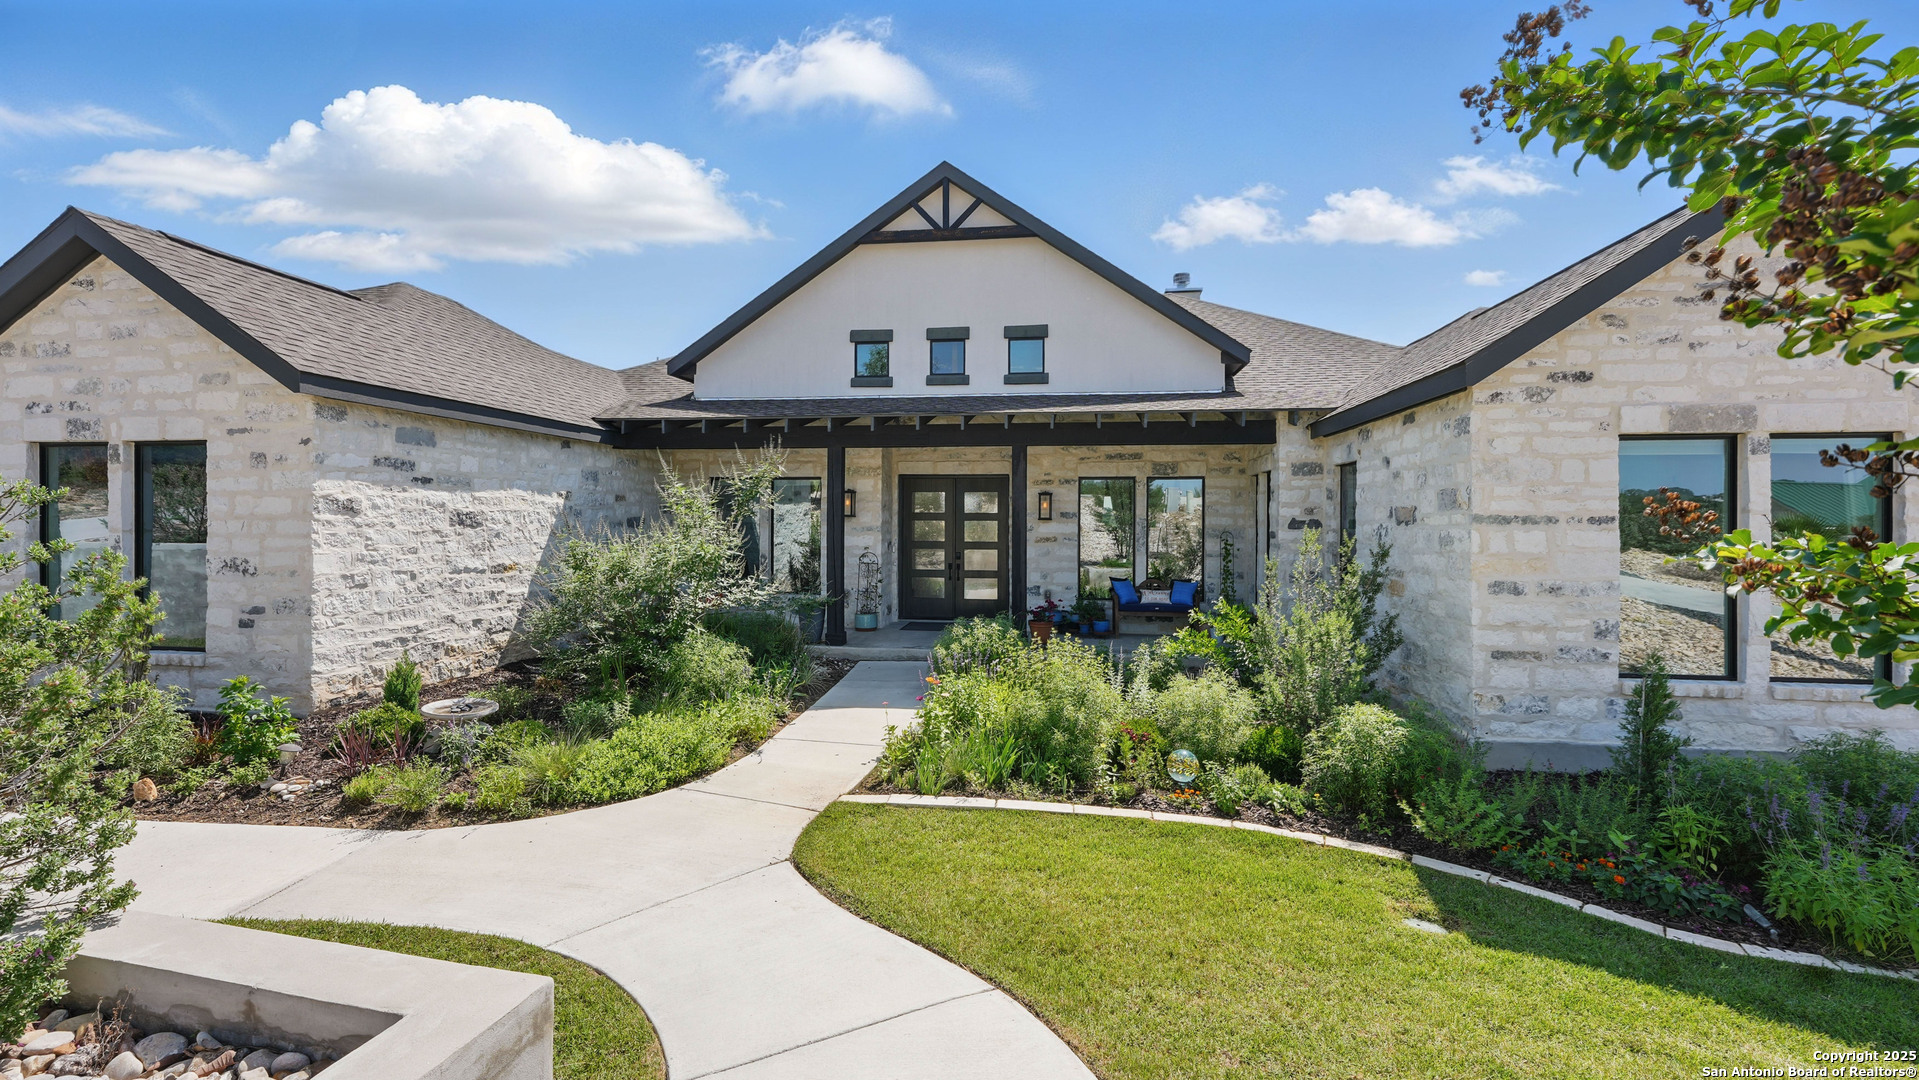
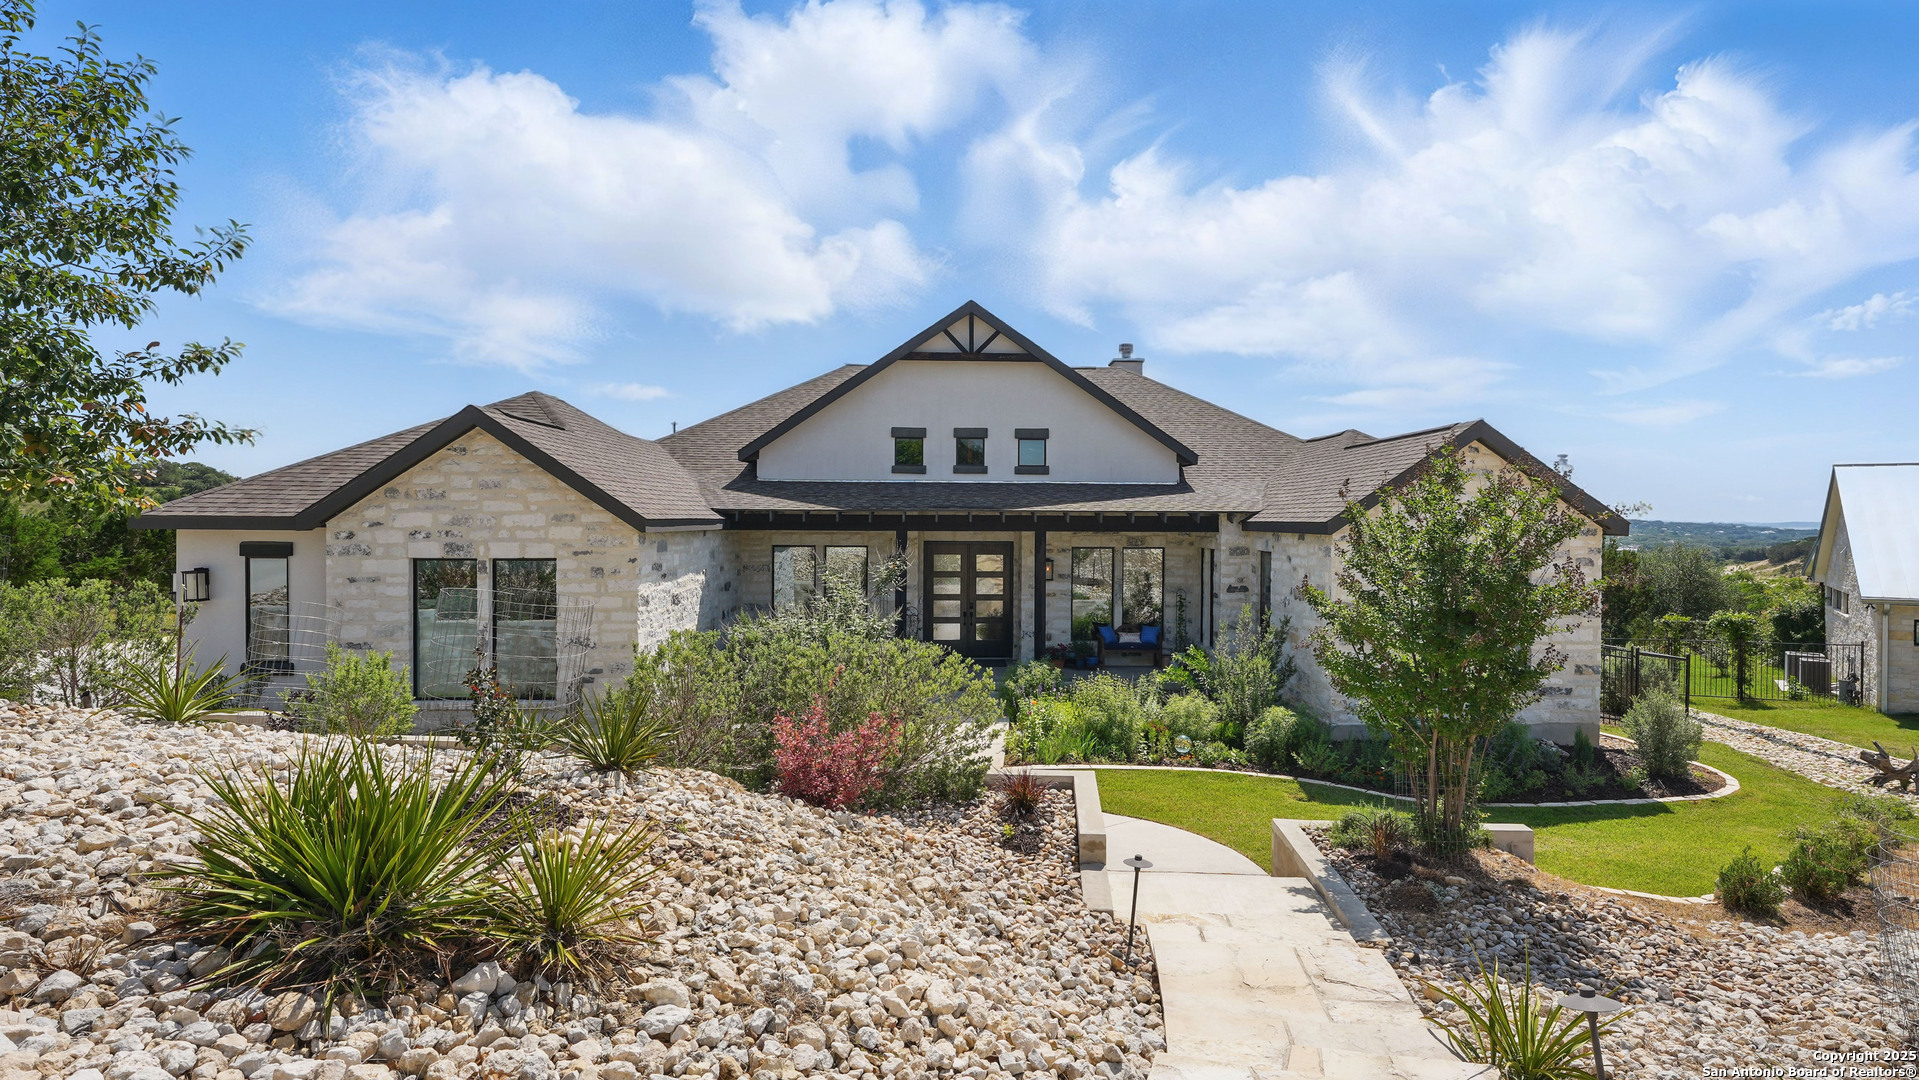
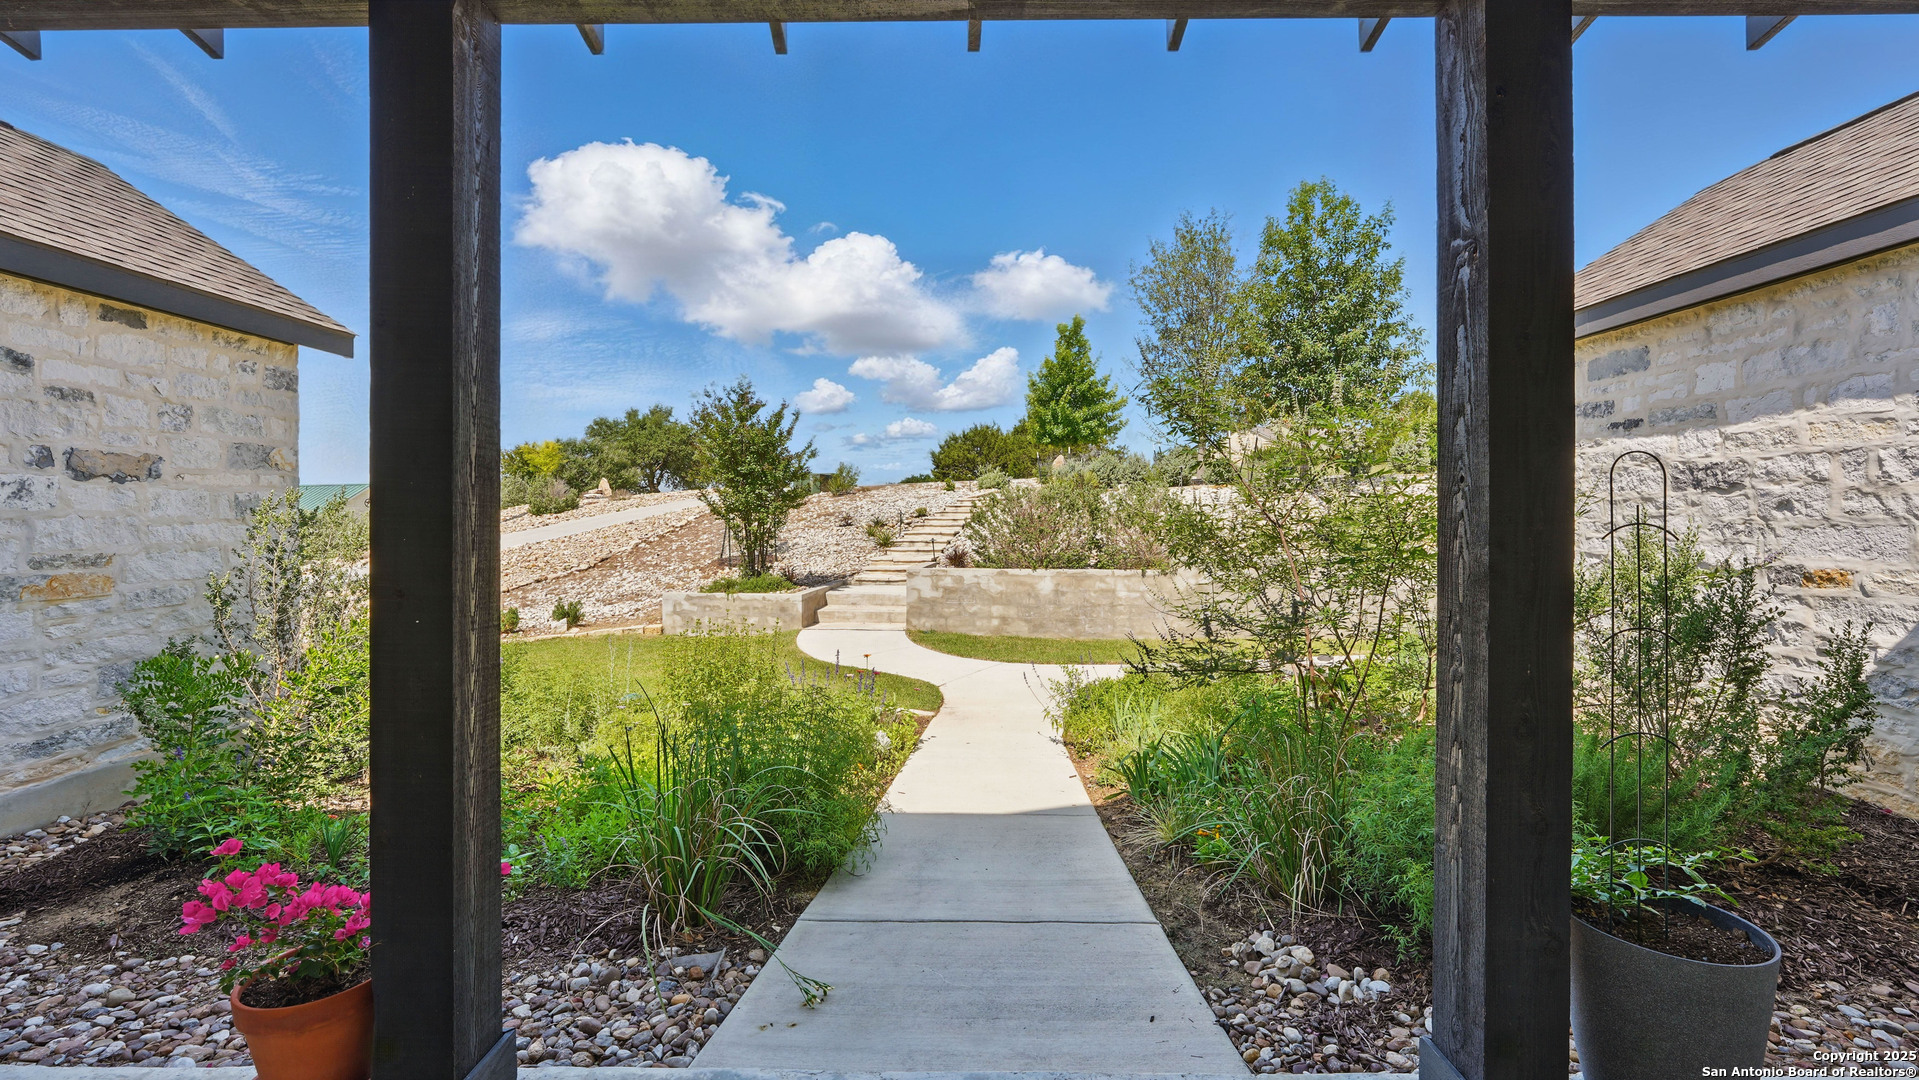
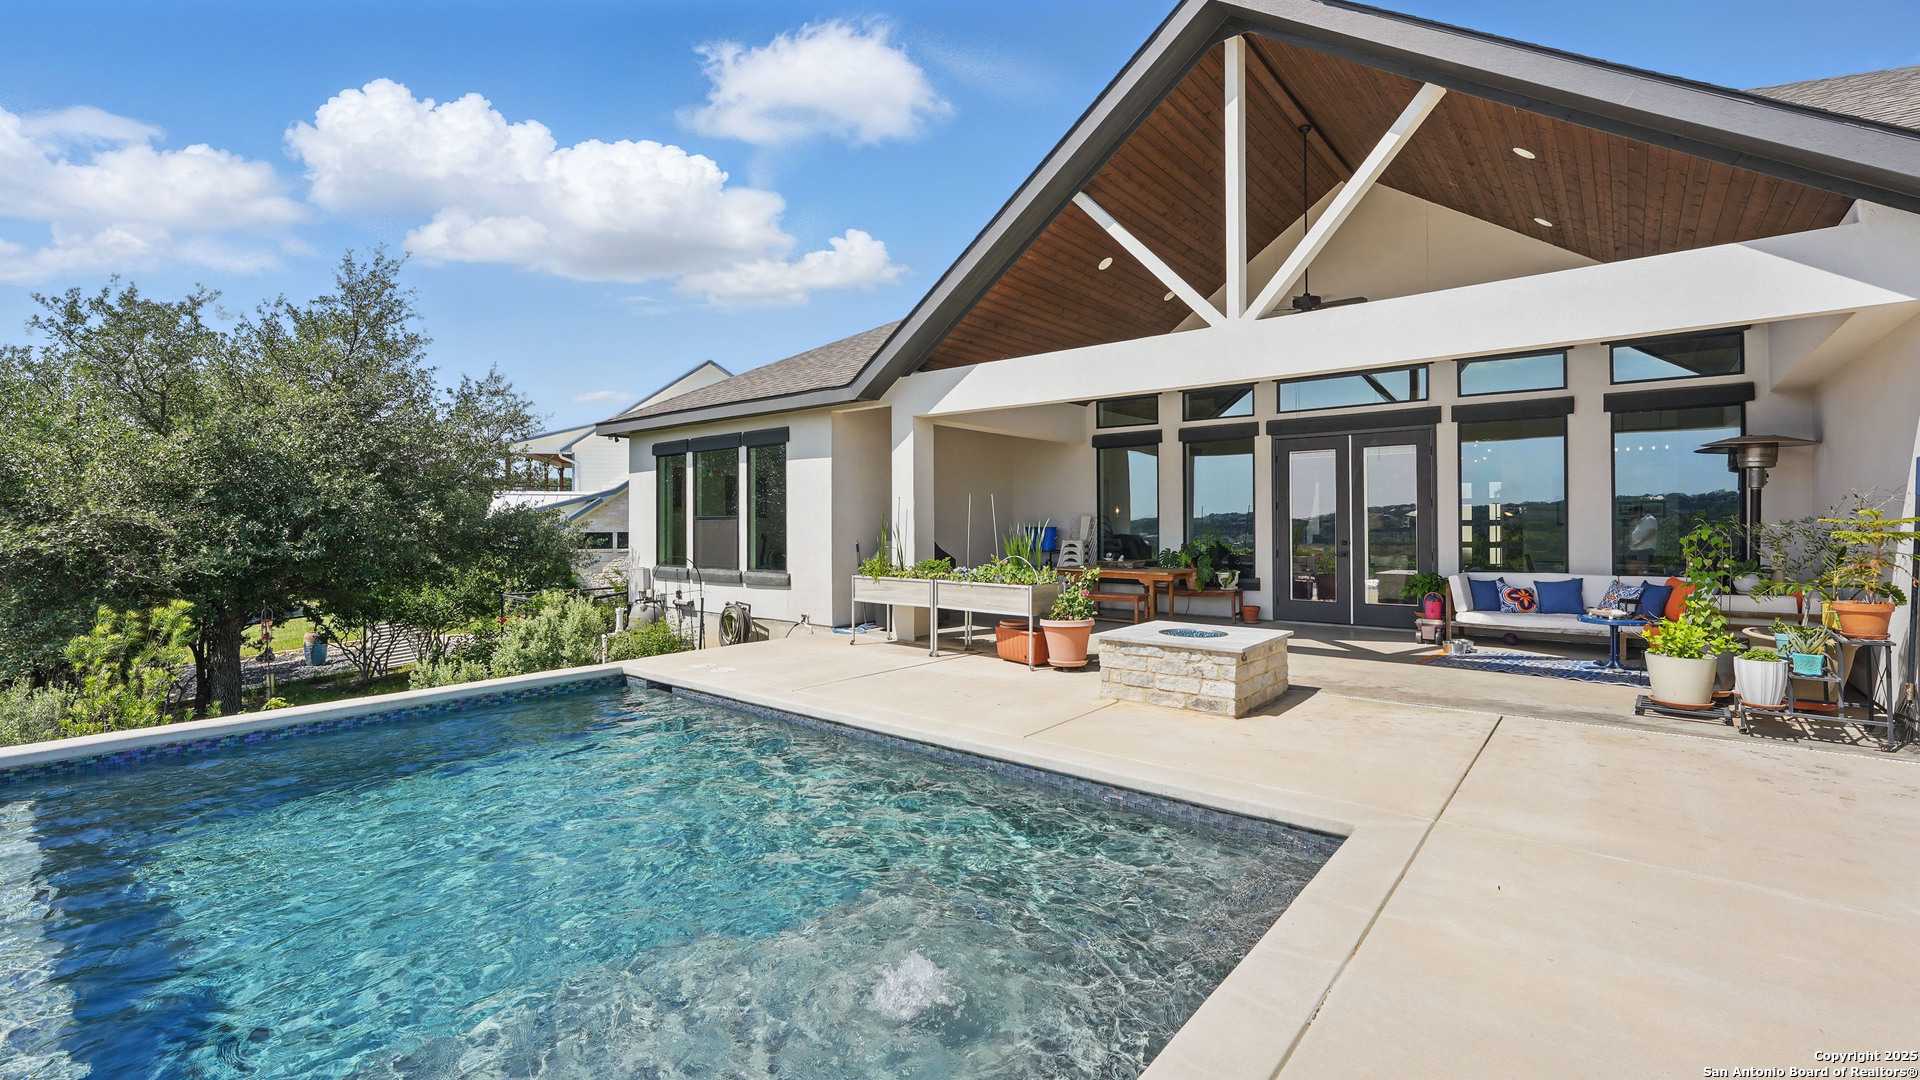
Property Description
Discover elegant Texas Hill Country living in this stunning 4-bedroom, 3.5-bath custom home nestled on a quiet cul-de-sac in the coveted Mystic Shores at Canyon Lake community. Situated on a sprawling 3.29-acre lot with views for miles, this property offers the perfect blend of luxury, functionality, and natural beauty. Step inside to over 3,100sqft of single story living space. An open-concept layout features wood-look ceramic tile throughout, soaring ceilings with wood beams, and a cozy gas fireplace. The main living areas and master suite offer expansive views of Canyon Lake and the rolling Hill Country, bringing nature's beauty indoors. The gourmet kitchen is a chef's dream with an oversized gas stove, KitchenAid stainless appliances, double ovens, a walk-in butler's pantry, and a large island perfect for entertaining. A dedicated bar area includes a beverage fridge and an additional ice maker for effortless hosting. Escape to the luxurious primary suite, featuring a tray ceiling with wood beam accents and breathtaking backyard views. The spa-like ensuite bath offers dual vanities, an oversized soaking tub, and a dual-entry walk-through shower with double showerheads and a rain feature, and a large walk-in closet with ample storage. 3 additional bedrooms and 2 more full baths offer tons of space for families or guest suites. A separate office/den provides the ideal work-from-home space, while the oversized laundry room includes custom tile and cabinetry and a convenient dog-wash shower. A large double door entry, half bath and a convenient mudroom from the 3-car oversized garage complete the interior of this exquisite home. Outside, unwind under the large covered patio complete with lighting and ceiling fans. Relax by the infinity-edge custom pool overlooking the scenic landscape, or entertain around the gas firepit with fire feature while taking in the awe-inspiring views of Canyon Lake and the hills. A gas stub is in place for your future outdoor kitchen dreams. The backyard offers wrought iron fencing, mature gardens, fruit trees, and raised vegetable beds. A true escape in natural beauty. This home is loaded with extras including dual tankless water heaters, water softener with reverse osmosis system, water purifier, UV filtration system, security system, and more! The private amenities for Mystic Shores residents are endless- 2 community pools, 2 lakeside parks, acres and acres of nature preserve and walking trails, a clubhouse for events with a gym, pickle ball, basketball, volleyball, and tennis courts, a playground, and boat and RV storage. This home truly checks every box for upscale Hill Country living with privacy, space, and panoramic views.
Build Your Team
Quickly find investor-friendly professionals who can help you succeed in real estate investing at any stage of the investing journey.


Agents
Match with investor-friendly agents who can help you find, analyze, and close your next deal


Lenders
Get the best funding…find investor-friendly lenders who specialize in your deal strategy


Property Managers
Transition to passive investing. Find a trusted property management partnership that lasts.


Tax Pros & Accountants
Taxes and financial reporting made easy—find experts to create tax savings strategies, file taxes, and more
Location
Property Details
Parking
- Description: AdditionalParking, Attached, Driveway, Garage
- Details: Garage Door Opener, Attached
- Garage Spaces: 3
- Spaces Total: 0
Bedroom Information
- # of Bedrooms: 4
Bathroom Information
- # of Baths (Full): 3
- # of Baths (Partial): 1
- # of Baths (Total): 4.0
Interior Features
- # of Stories: 1
- Fireplace: Yes
Exterior Features
- Exterior Walls Materials: Combination
- Foundation: Slab
- Roof Type: Hip
- Roof Material: Composition
- Pool: Yes
- Pool Community: Yes
HOA
- Has HOA: Yes
- Association: MYSTIC SHORES POA
- HOA Fee: $414/annually
Land Information
- Land Use: Residential
- Land Use Subtype: Single Family Residential
Lot Information
- Parcel ID: 360150075500
- Lot Size: 0 sqft
Property Information
- Property Type: Single Family Residence
- Style: One Story
- Year Built: 2021
Tax Information
- Annual Tax: $15,455
Utilities
- Heating: Central, Heat Pump, Propane
- Cooling: Ceiling Fan(s), Central Air
Location
- County: Comal
Listing Details
Investment Summary
- Monthly Cash Flow
- -$4,016
- Cap Rate
- 2.2%
- Cash-on-Cash Return
- -17.7%
- Debt Coverage Ratio
- 0.35
- Internal Rate of Return (5 years)
- -13.1%
Cash Flow
Net Operating Income (NOI) minus mortgage payments.
Calculation:
NOI - Mortgage Payments
Cap Rate (Market Value)
Capitalization Rate is a rate of return that compares the yearly Net Operating Income (NOI) to the market value.
Calculation:
NOI / Market Value
Cash-on-Cash Return (CoC)
Annual Cash Flow / Cash Invested
Calculation:
Annual cash flow divided by initial cash invested.
Debt Coverage Ratio (DCR)
Net Operating Income (NOI) divided by total debt payments.
Calculation:
NOI / Total Debt Payments
Internal Rate of Return (IRR)
A metric for assessing profitability over time. IRR is the discount rate at which the net present value (NPV) of all future cash flows (positive and negative) from an investment equals zero — including both periodic cash flow (such as rent) and a projected sale at the end of the holding period. It represents the expected annualized return, accounting for income, expenses, and the recovery of capital through a future sale.
Purchase Details
Purchase PriceThe price paid for the property. Purchase price:
| $1,185,000 |
|---|---|
Amount FinancedThe amount of the purchase financed through a loan. Amount financed:
| -$948,000 |
Down paymentThe initial payment made towards the purchase. Down payment:
| $237,000 |
Closing CostsFees and expenses associated with purchasing a property, typically ranging from 2% to 5% of the home’s purchase price, paid at the end of a home purchase to cover services like lending, title transfer, and taxes. Closing costs:
| $35,550 |
Rehab CostsCosts incurred to repair or improve the property, including: roof, flooring, exterior siding, kitchen, exterior paint, bathrooms, etc. Rehab costs:
| $0 |
Initial Cash InvestedThe total initial cash invested in the property. Calculation:Down payment + Buying costs + Rehab costs Initial cash invested:
| $272,550 |
Square Feet (SQFT)The total square footage of the property. Square feet:
| 3,161 |
Cost Per Square FootCost per square foot of the property. Calculation:Purchase Price / Square Feet Cost per square foot:
| $375 |
Monthly Rent Per Square FootMonthly rent divided by the number of square feet. This ratio helps investors compare rental income efficiency across properties, markets, and unit sizes Calculation:Monthly Rent / Square Feet Monthly rent per square foot:
| $1.61 |
Financing Details
Loan AmountThe total sum of money borrowed from a lender to finance a property purchase. Calculation:Purchase Price - Down Payment
Loan amount:
| $948,000 |
|---|---|
Loan to Value Ratio (LTV)Loan amount divided by the market value of the property. Calculation:Loan Amount / Market Value
Loan to value ratio:
| 80.0% |
Loan TypeThe type of loan (e.g., fixed, adjustable).
Loan type:
| Amortizing |
TermThe loan repayment period in years.
Term:
| 30 years |
Interest RateThe percentage a lender charges on the borrowed amount of a loan, determining the cost of borrowing money.
Interest rate:
| 6.850% |
Principal & Interest (PI)The principal is the portion of the loan payment that reduces the loan balance. The interest is the lender's charge for borrowing money. Calculation:(P * r * (1 + r) ** n) / ((1 + r) ** n - 1) Where:
P = Loan amount (principal)
Principal & interest:
| $6,212 |
Property TaxesAnnual taxes levied by local governments on real estate properties. These taxes fund public services like schools, roads, and emergency services.
Property tax:
| $1,288 |
InsuranceThe costs for insurance coverage to protect against financial losses due to risks like fire, natural disasters, theft, liability, or tenant-related damages. Calculation:Assumes 7% of gross rental income, unless insurance rates are specified.
Insurance:
| $357 |
Private Mortgage Insurance (PMI)A fee that borrowers pay when they take out a conventional loan with a loan-to-value (LTV) ratio above 80%.
Private mortgage insurance (PMI):
| $0 |
Monthly PaymentThe fixed amount a borrower pays each month to repay a loan. It typically includes principal and interest (P&I) and may also cover property taxes, insurance, HOA fees, and PMI if escrowed. Monthly payment:
| $7,857 |
Operating Income
| % Rent | Monthly | Yearly | |
|---|---|---|---|
Gross RentThe total rental income received from tenants before deducting any expenses. Includes base rent, late fees, pet fees, parking fees, and other recurring charges.
Gross rent:
| $5,100 | $61,200 | |
Vacancy LossExpected loss of rent due to vacancies.
Vacancy loss:
(6%)
| 6% | -$306 | -$3,672 |
Operating IncomeGross rental income minus vacancy loss. Calculation:Gross rent - Vacancy loss
Operating income:
| $4,794 | $57,528 |
Operating Expenses
| % Rent | Monthly | Yearly | |
|---|---|---|---|
Property TaxesAnnual taxes levied by local governments on real estate properties. These taxes fund public services like schools, roads, and emergency services. | 25% | -$1,288 | -$15,455 |
InsuranceThe costs for insurance coverage to protect against financial losses due to risks like fire, natural disasters, theft, liability, or tenant-related damages. Calculation:Assumes 7% of gross rental income, unless insurance rates are specified. | 7% | -$357 | -$4,284 |
Property ManagementThe costs associated with hiring a property manager to handle the day-to-day operations of a rental property. Includes management fees, leasing fes, eviction fees, etc. Calculation:Assumes 8% of gross rental income. | 8% | -$408 | -$4,896 |
Repairs & MaintenanceOngoing costs for routine upkeep and minor fixes needed to keep a property in good working condition. Calculation:Assumes 5% of gross rental income. Varies by property age and condition. | 5% | -$255 | -$3,060 |
Capital ExpensesLarge, infrequent costs for major improvements or replacements, like a new roof, HVAC system, or appliances. Calculation:Assumes 5% of gross rental income. Varies by property age. | 5% | -$255 | -$3,060 |
HOA FeesRegular dues paid to a Homeowners Association for community maintenance, amenities, and management. Similar fees include: Condo Association Fees, Co-op Maintenance Fees, etc. | 1% | -$35 | -$420 |
Operating ExpensesRecurring costs required to maintain and manage a rental property, including property taxes, insurance, maintenance, repairs, utilities (if paid by the owner), property management fees, and other day-to-day expenses. Calculation:Insurance + Property Taxes + Property Management + Repairs & Maintenance + Capital Expenditures + HOA Fees | 51% | -$2,598 | -$31,175 |
Cash Flow
| Monthly | Yearly | |
|---|---|---|
Net Operating Income (NOI)The income generated from a property after deducting all operating expenses but before deducting mortgage payments, taxes, and capital expenditures. Calculation:Gross Operating Income - Operating Expenses
Net operating income:
| $2,196 | $26,352 |
Mortgage PaymentThe fixed amount a borrower pays each month to repay a loan. It typically includes principal and interest (P&I) and may also cover property taxes, insurance, HOA fees, and PMI if escrowed. | -$6,212 | -$74,544 |
Cash FlowNet Operating Income (NOI) minus mortgage payments. Calculation:NOI - Mortgage Payments | $4,016 | $48,192 |