
$2,125,000
Investment Summary
- Monthly Cash Flow
- -$8,287
- Cap Rate
- 1.5%
- Cash-on-Cash Return
- -20.3%
- Debt Coverage Ratio
- 0.24
- Internal Rate of Return (5 years)
- -15.7%
Cash Flow
Net Operating Income (NOI) minus mortgage payments.
Calculation:
NOI - Mortgage Payments
Cap Rate (Market Value)
Capitalization Rate is a rate of return that compares the yearly Net Operating Income (NOI) to the market value.
Calculation:
NOI / Market Value
Cash-on-Cash Return (CoC)
Annual Cash Flow / Cash Invested
Calculation:
Annual cash flow divided by initial cash invested.
Debt Coverage Ratio (DCR)
Net Operating Income (NOI) divided by total debt payments.
Calculation:
NOI / Total Debt Payments
Internal Rate of Return (IRR)
A metric for assessing profitability over time. IRR is the discount rate at which the net present value (NPV) of all future cash flows (positive and negative) from an investment equals zero — including both periodic cash flow (such as rent) and a projected sale at the end of the holding period. It represents the expected annualized return, accounting for income, expenses, and the recovery of capital through a future sale.
Property Description
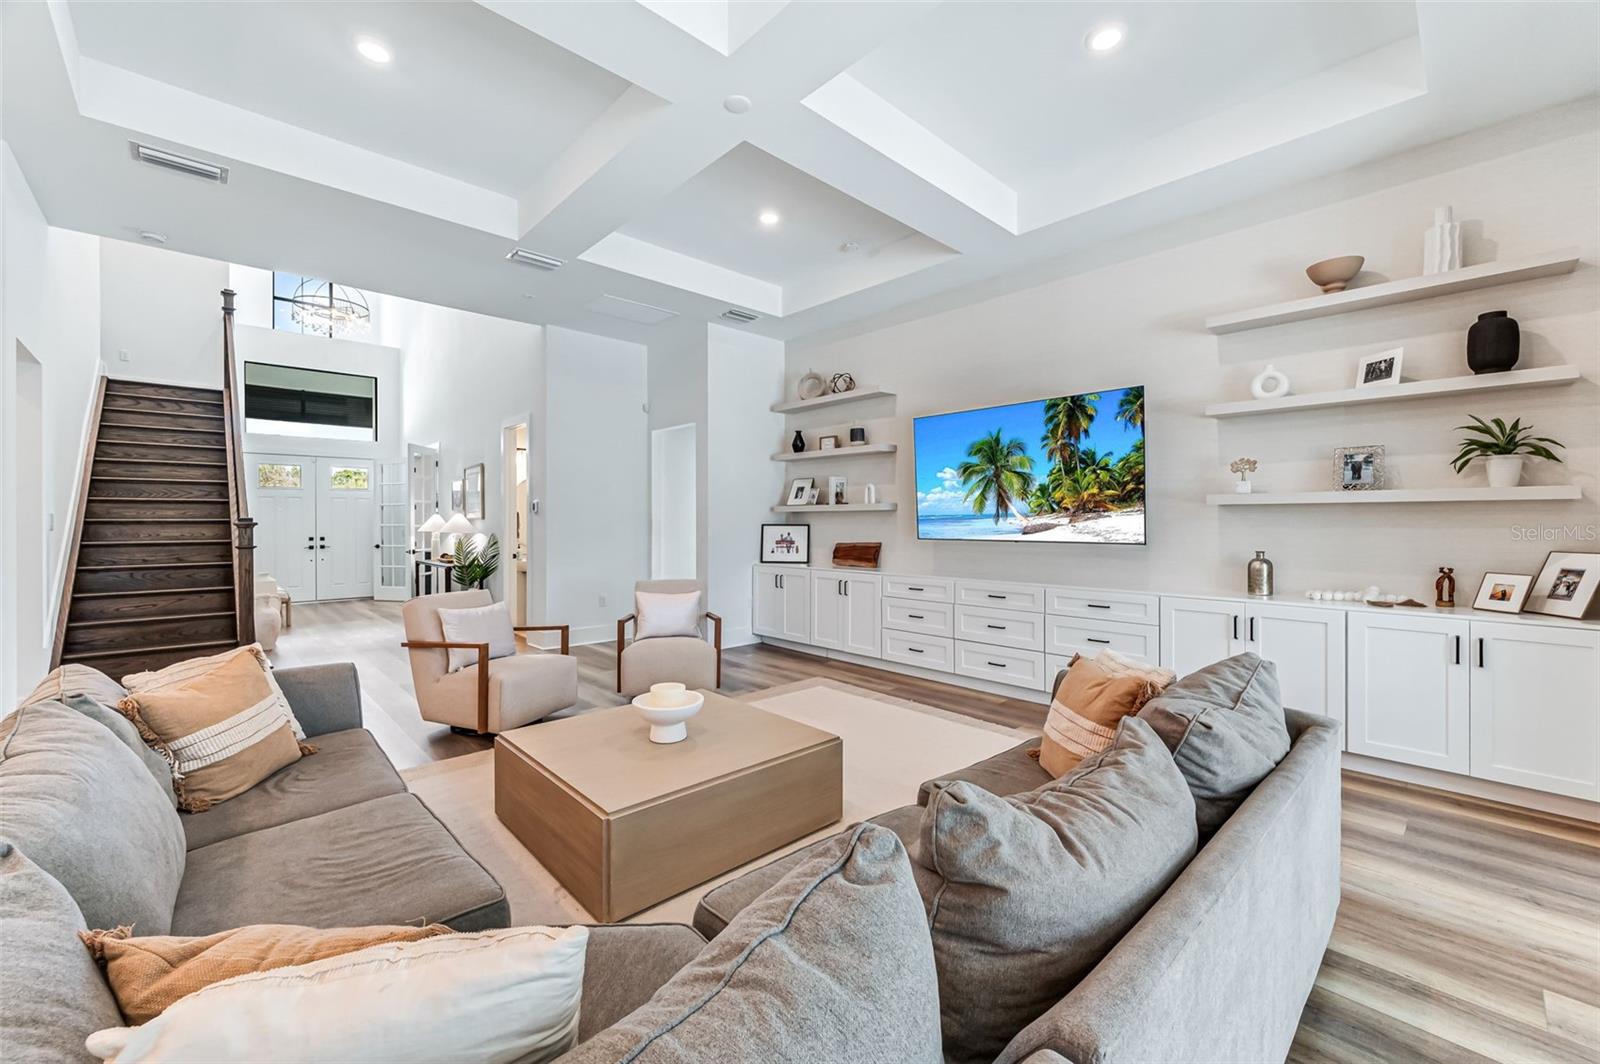
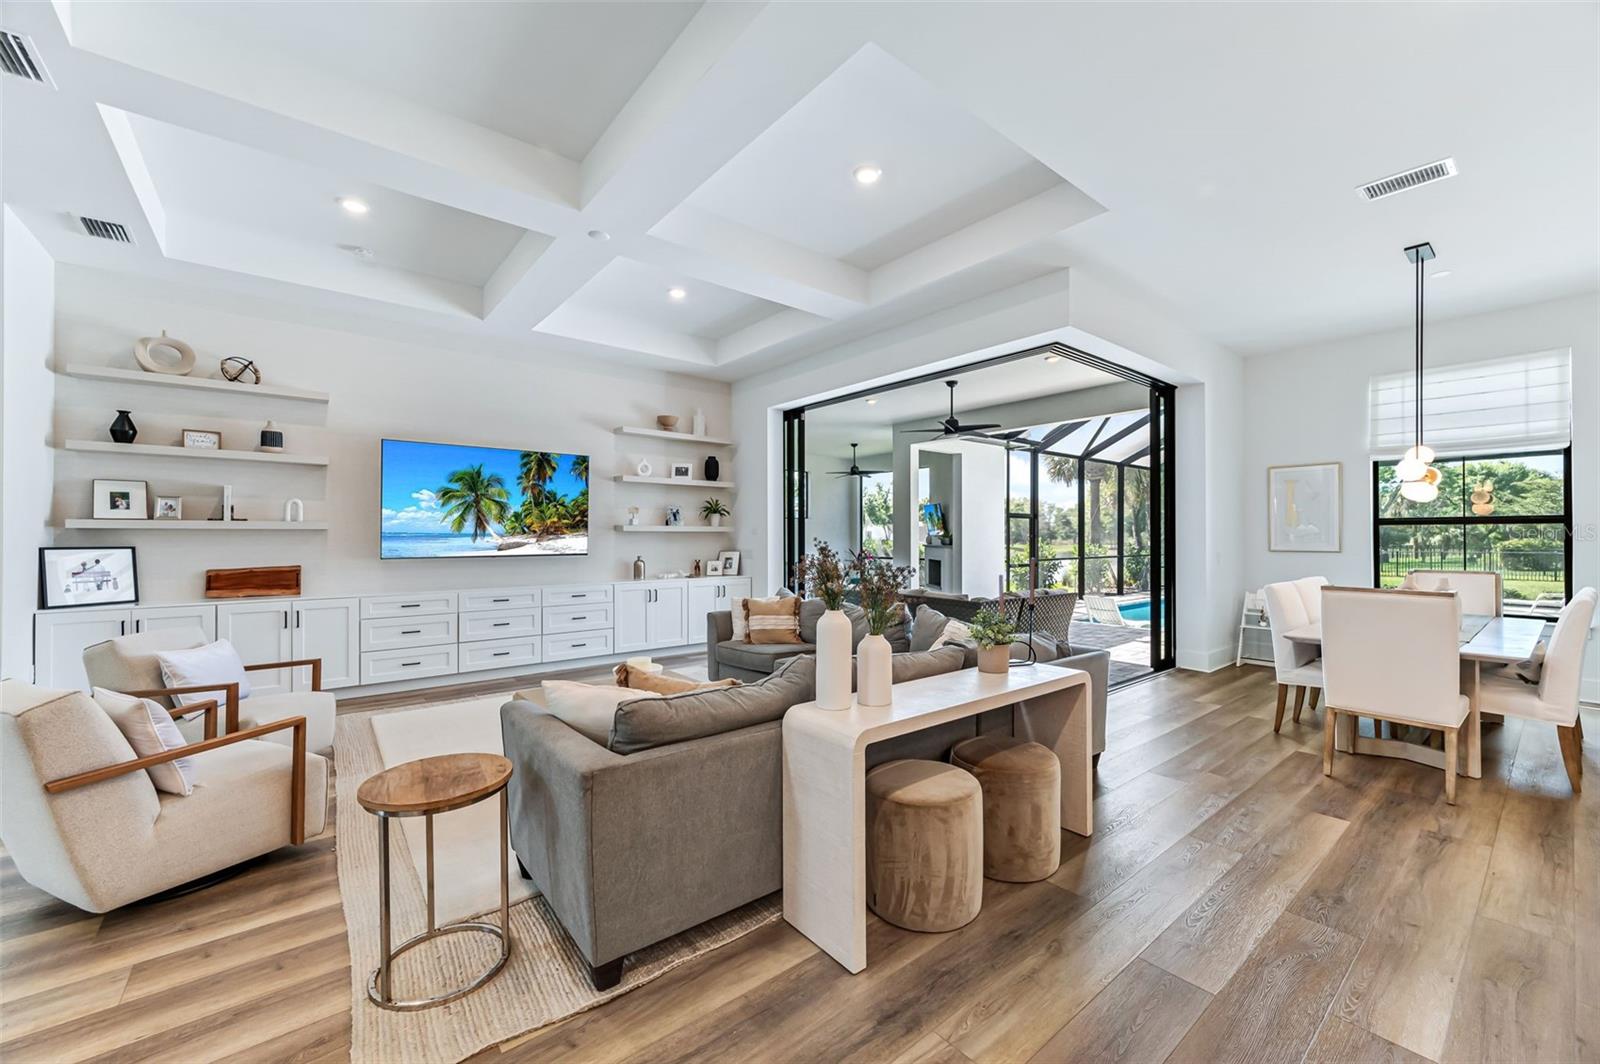
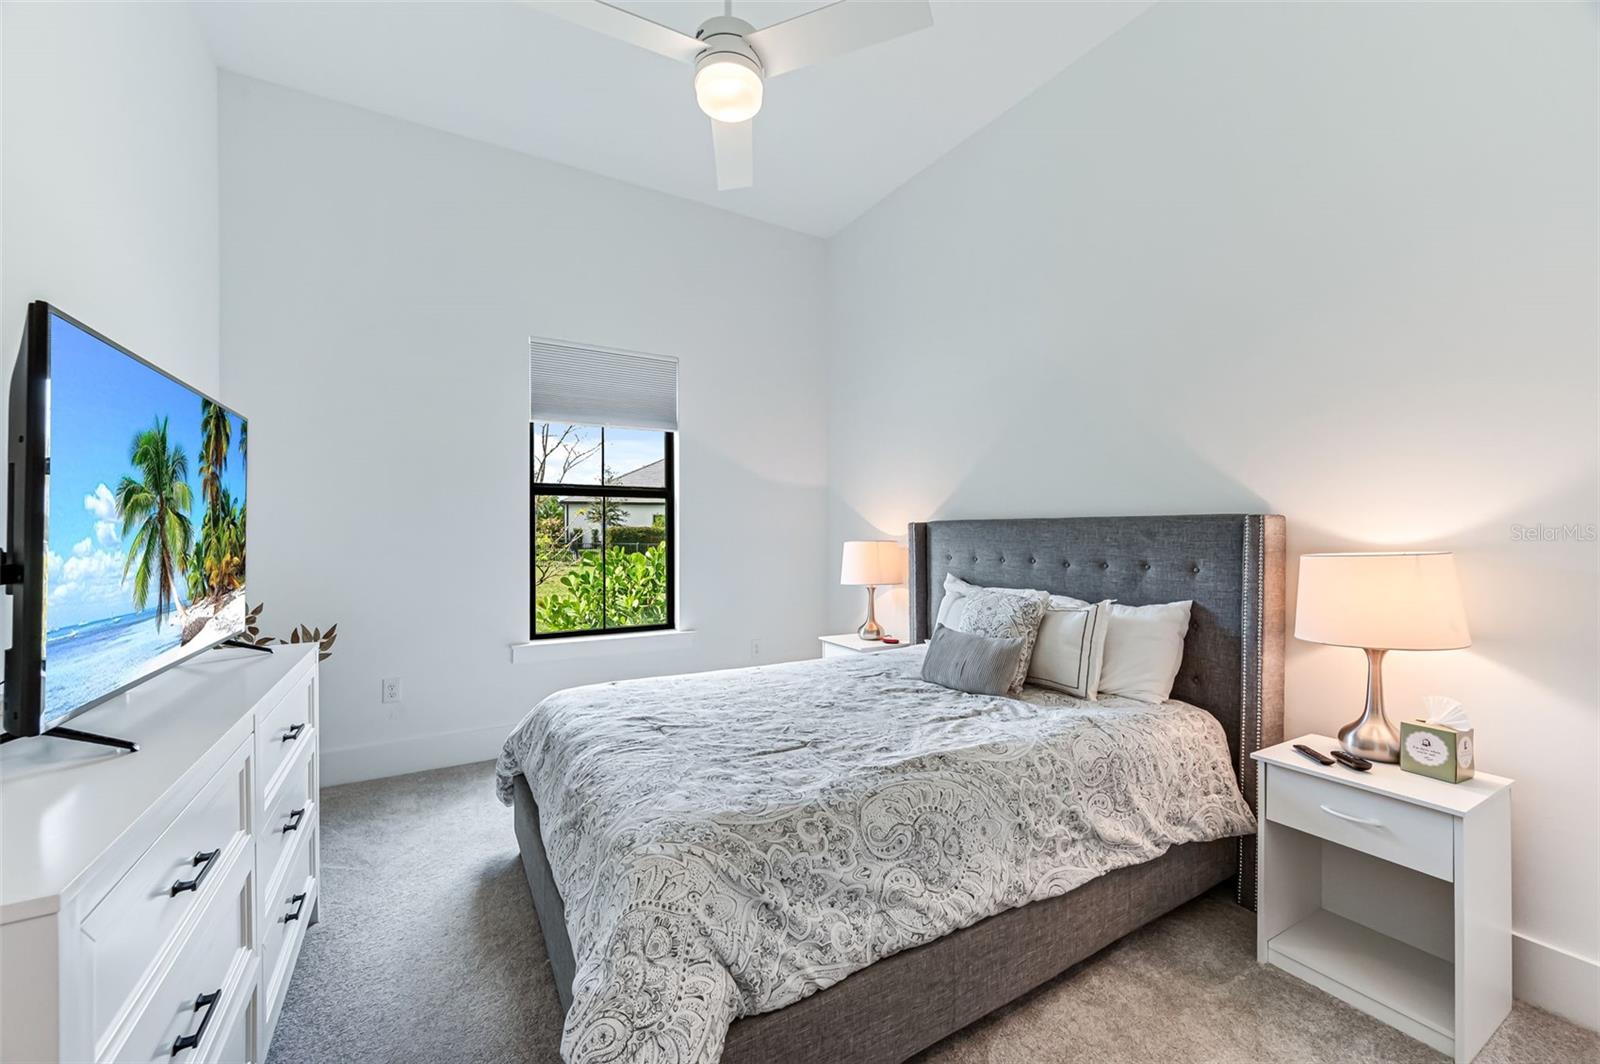
Experience unparalleled luxury in this Oakley model estate by Pulte Homes, nestled within the exclusive, privately gated Corkscrew Estates in Estero. This 4,389 sq. ft. home, completed in 2022, sits on nearly one acre of lush, manicured grounds, blending elegance, comfort, and modern convenience. Upon entry, a grand foyer with a custom chandelier welcomes you, setting the tone for sophistication. Soaring 10' to 12'+ ceilings, 8' solid-core doors, and tray and coffered ceilings throughout the main living areas enhance the architectural appeal. Custom built-in cabinetry and designer light fixtures exude luxury, while luxury plank flooring and upgraded tile offer durability and elegance. Every detail has been crafted with premium finishes, ensuring a high-end living experience. The chef's gourmet kitchen is a true highlight, featuring KitchenAid stainless steel appliances, a built-in wall oven, microwave with convection and air fry capabilities, a gas cooktop, and a 48" French door refrigerator. An oversized island with quartz countertops is perfect for casual dining and entertaining. Custom cabinetry with soft-close doors, drawers, and a walk-in pantry with built-in storage combine style and function. The upstairs loft/game room boasts a wet bar with custom floating shelves and a KitchenAid mini-fridge, which is making it ideal for entertaining. CAT6 wiring ensures seamless connectivity, and an integrated alarm system offers security and peace of mind. Designed for the ultimate indoor-outdoor lifestyle, this estate features corner pocket sliders open to a resort-style lanai with a heated chlorine pool, sun shelf, and elegant fireplace—perfect for enjoying Florida's cooler months. The western-facing exposure offers breathtaking sunsets, creating a stunning backdrop for evening relaxation. A custom outdoor kitchen with built-in storage enhances entertaining, while lush landscaping and a large fenced yard provide privacy and curb appeal. The lavish primary suite is a private sanctuary with custom his-and-her closets, electronic window treatments, and a spa-inspired en-suite bath. The Jack-and-Jill bedrooms also feature custom closets, offering boutique-style organization. Smart home features and pre-wiring for automation ensure this estate meets modern luxury standards. Additional highlights include PGT impact-resistant windows and doors, a whole-home 24kW generator, dual-zone HVACs, and a tankless water heater for ultimate efficiency and peace of mind. The three-car side-load garage with epoxy floors, ample storage, and a 220V electric car charging port is perfect for discerning buyers. Located in a natural gas community just minutes from world-class shopping, dining, and pristine Gulf beaches, this estate offers exclusivity and convenience. Experience the epitome of Florida luxury living.
Build Your Team
Quickly find investor-friendly professionals who can help you succeed in real estate investing at any stage of the investing journey.


Agents
Match with investor-friendly agents who can help you find, analyze, and close your next deal


Lenders
Get the best funding…find investor-friendly lenders who specialize in your deal strategy


Property Managers
Transition to passive investing. Find a trusted property management partnership that lasts.


Tax Pros & Accountants
Taxes and financial reporting made easy—find experts to create tax savings strategies, file taxes, and more
Location
Property Details
Parking
- Description: Driveway, Garage Door Opener, Garage Faces Side, Ground Level, Off Street, Oversized
- Details: Driveway, Garage Door Opener, Garage Faces Side, Off Street, Oversized, Attached
- Garage Spaces: 3
- Spaces Total: 0
Bedroom Information
- # of Bedrooms: 5
Bathroom Information
- # of Baths (Full): 4
- # of Baths (Partial): 1
- # of Baths (Total): 5.0
Interior Features
- # of Rooms: 4
- # of Stories: 2
- Fireplace: Yes
Exterior Features
- Exterior Walls Materials: Stucco
- Foundation: Slab
- Roof Type: IRR/Cathedral
- Roof Material: Tile
- Pool: Yes
HOA
- Has HOA: Yes
- Association: Signature One / Keith Wilking
- HOA Fee: $1,266/quarterly
Land Information
- Land Use: Residential
- Land Use Subtype: Single Family Residential
Lot Information
- Parcel ID: 2146260200000.0540
- Lot Size: 39465 sqft
Property Information
- Property Type: Single Family Residence
- Year Built: 2022
Tax Information
- Annual Tax: $17,576
Utilities
- Water & Sewer: Public
- Heating: Central
- Cooling: Central Air
Location
- County: Lee
Listing Details
Investment Summary
- Monthly Cash Flow
- -$8,287
- Cap Rate
- 1.5%
- Cash-on-Cash Return
- -20.3%
- Debt Coverage Ratio
- 0.24
- Internal Rate of Return (5 years)
- -15.7%
Cash Flow
Net Operating Income (NOI) minus mortgage payments.
Calculation:
NOI - Mortgage Payments
Cap Rate (Market Value)
Capitalization Rate is a rate of return that compares the yearly Net Operating Income (NOI) to the market value.
Calculation:
NOI / Market Value
Cash-on-Cash Return (CoC)
Annual Cash Flow / Cash Invested
Calculation:
Annual cash flow divided by initial cash invested.
Debt Coverage Ratio (DCR)
Net Operating Income (NOI) divided by total debt payments.
Calculation:
NOI / Total Debt Payments
Internal Rate of Return (IRR)
A metric for assessing profitability over time. IRR is the discount rate at which the net present value (NPV) of all future cash flows (positive and negative) from an investment equals zero — including both periodic cash flow (such as rent) and a projected sale at the end of the holding period. It represents the expected annualized return, accounting for income, expenses, and the recovery of capital through a future sale.
Purchase Details
Purchase PriceThe price paid for the property. Purchase price:
| $2,125,000 |
|---|---|
Amount FinancedThe amount of the purchase financed through a loan. Amount financed:
| -$1,700,000 |
Down paymentThe initial payment made towards the purchase. Down payment:
| $425,000 |
Closing CostsFees and expenses associated with purchasing a property, typically ranging from 2% to 5% of the home’s purchase price, paid at the end of a home purchase to cover services like lending, title transfer, and taxes. Closing costs:
| $63,750 |
Rehab CostsCosts incurred to repair or improve the property, including: roof, flooring, exterior siding, kitchen, exterior paint, bathrooms, etc. Rehab costs:
| $0 |
Initial Cash InvestedThe total initial cash invested in the property. Calculation:Down payment + Buying costs + Rehab costs Initial cash invested:
| $488,750 |
Square Feet (SQFT)The total square footage of the property. Square feet:
| 4,389 |
Cost Per Square FootCost per square foot of the property. Calculation:Purchase Price / Square Feet Cost per square foot:
| $484 |
Monthly Rent Per Square FootMonthly rent divided by the number of square feet. This ratio helps investors compare rental income efficiency across properties, markets, and unit sizes Calculation:Monthly Rent / Square Feet Monthly rent per square foot:
| $1.48 |
Financing Details
Loan AmountThe total sum of money borrowed from a lender to finance a property purchase. Calculation:Purchase Price - Down Payment
Loan amount:
| $1,700,000 |
|---|---|
Loan to Value Ratio (LTV)Loan amount divided by the market value of the property. Calculation:Loan Amount / Market Value
Loan to value ratio:
| 80.0% |
Loan TypeThe type of loan (e.g., fixed, adjustable).
Loan type:
| Amortizing |
TermThe loan repayment period in years.
Term:
| 30 years |
Interest RateThe percentage a lender charges on the borrowed amount of a loan, determining the cost of borrowing money.
Interest rate:
| 6.625% |
Principal & Interest (PI)The principal is the portion of the loan payment that reduces the loan balance. The interest is the lender's charge for borrowing money. Calculation:(P * r * (1 + r) ** n) / ((1 + r) ** n - 1) Where:
P = Loan amount (principal)
Principal & interest:
| $10,885 |
Property TaxesAnnual taxes levied by local governments on real estate properties. These taxes fund public services like schools, roads, and emergency services.
Property tax:
| $1,465 |
InsuranceThe costs for insurance coverage to protect against financial losses due to risks like fire, natural disasters, theft, liability, or tenant-related damages. Calculation:Assumes 7% of gross rental income, unless insurance rates are specified.
Insurance:
| $455 |
Private Mortgage Insurance (PMI)A fee that borrowers pay when they take out a conventional loan with a loan-to-value (LTV) ratio above 80%.
Private mortgage insurance (PMI):
| $0 |
Monthly PaymentThe fixed amount a borrower pays each month to repay a loan. It typically includes principal and interest (P&I) and may also cover property taxes, insurance, HOA fees, and PMI if escrowed. Monthly payment:
| $12,805 |
Operating Income
| % Rent | Monthly | Yearly | |
|---|---|---|---|
Gross RentThe total rental income received from tenants before deducting any expenses. Includes base rent, late fees, pet fees, parking fees, and other recurring charges.
Gross rent:
| $6,500 | $78,000 | |
Vacancy LossExpected loss of rent due to vacancies.
Vacancy loss:
(6%)
| 6% | -$390 | -$4,680 |
Operating IncomeGross rental income minus vacancy loss. Calculation:Gross rent - Vacancy loss
Operating income:
| $6,110 | $73,320 |
Operating Expenses
| % Rent | Monthly | Yearly | |
|---|---|---|---|
Property TaxesAnnual taxes levied by local governments on real estate properties. These taxes fund public services like schools, roads, and emergency services. | 23% | -$1,465 | -$17,576 |
InsuranceThe costs for insurance coverage to protect against financial losses due to risks like fire, natural disasters, theft, liability, or tenant-related damages. Calculation:Assumes 7% of gross rental income, unless insurance rates are specified. | 7% | -$455 | -$5,460 |
Property ManagementThe costs associated with hiring a property manager to handle the day-to-day operations of a rental property. Includes management fees, leasing fes, eviction fees, etc. Calculation:Assumes 8% of gross rental income. | 8% | -$520 | -$6,240 |
Repairs & MaintenanceOngoing costs for routine upkeep and minor fixes needed to keep a property in good working condition. Calculation:Assumes 5% of gross rental income. Varies by property age and condition. | 5% | -$325 | -$3,900 |
Capital ExpensesLarge, infrequent costs for major improvements or replacements, like a new roof, HVAC system, or appliances. Calculation:Assumes 5% of gross rental income. Varies by property age. | 5% | -$325 | -$3,900 |
HOA FeesRegular dues paid to a Homeowners Association for community maintenance, amenities, and management. Similar fees include: Condo Association Fees, Co-op Maintenance Fees, etc. | 6% | -$422 | -$5,064 |
Operating ExpensesRecurring costs required to maintain and manage a rental property, including property taxes, insurance, maintenance, repairs, utilities (if paid by the owner), property management fees, and other day-to-day expenses. Calculation:Insurance + Property Taxes + Property Management + Repairs & Maintenance + Capital Expenditures + HOA Fees | 54% | -$3,512 | -$42,140 |
Cash Flow
| Monthly | Yearly | |
|---|---|---|
Net Operating Income (NOI)The income generated from a property after deducting all operating expenses but before deducting mortgage payments, taxes, and capital expenditures. Calculation:Gross Operating Income - Operating Expenses
Net operating income:
| $2,598 | $31,176 |
Mortgage PaymentThe fixed amount a borrower pays each month to repay a loan. It typically includes principal and interest (P&I) and may also cover property taxes, insurance, HOA fees, and PMI if escrowed. | -$10,885 | -$130,620 |
Cash FlowNet Operating Income (NOI) minus mortgage payments. Calculation:NOI - Mortgage Payments | $8,287 | $99,444 |