$665,000
Investment Summary
- Monthly Cash Flow
- -$1,589
- Cap Rate
- 3.4%
- Cash-on-Cash Return
- -12.5%
- Debt Coverage Ratio
- 0.54
- Internal Rate of Return (5 years)
- -8.1%
Cash Flow
Net Operating Income (NOI) minus mortgage payments.
Calculation:
NOI - Mortgage Payments
Cap Rate (Market Value)
Capitalization Rate is a rate of return that compares the yearly Net Operating Income (NOI) to the market value.
Calculation:
NOI / Market Value
Cash-on-Cash Return (CoC)
Annual Cash Flow / Cash Invested
Calculation:
Annual cash flow divided by initial cash invested.
Debt Coverage Ratio (DCR)
Net Operating Income (NOI) divided by total debt payments.
Calculation:
NOI / Total Debt Payments
Internal Rate of Return (IRR)
A metric for assessing profitability over time. IRR is the discount rate at which the net present value (NPV) of all future cash flows (positive and negative) from an investment equals zero — including both periodic cash flow (such as rent) and a projected sale at the end of the holding period. It represents the expected annualized return, accounting for income, expenses, and the recovery of capital through a future sale.
Property Description
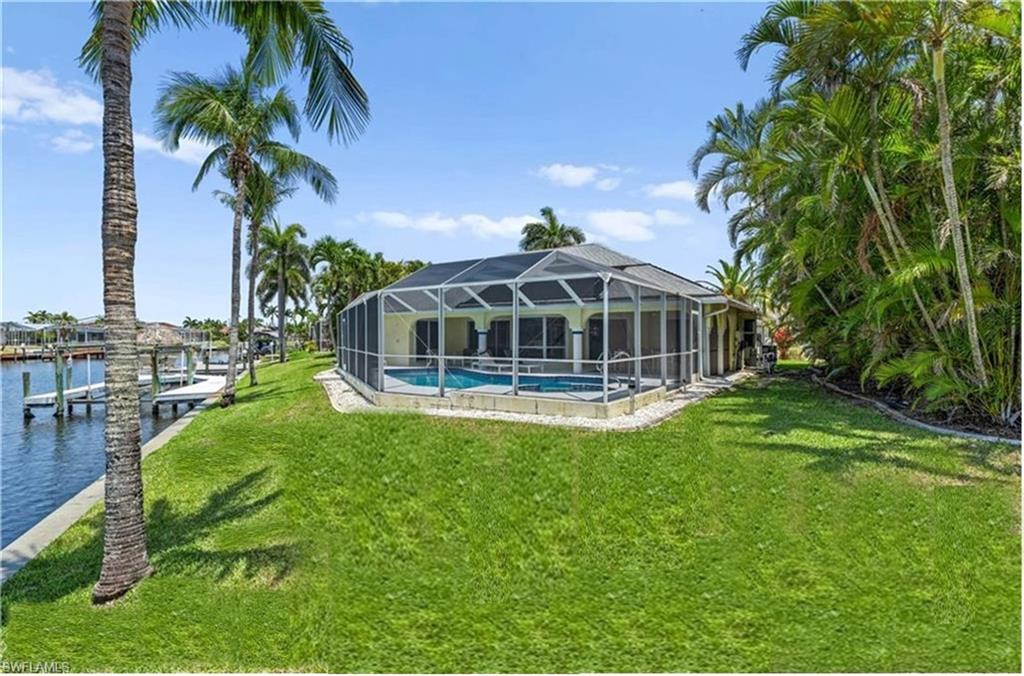
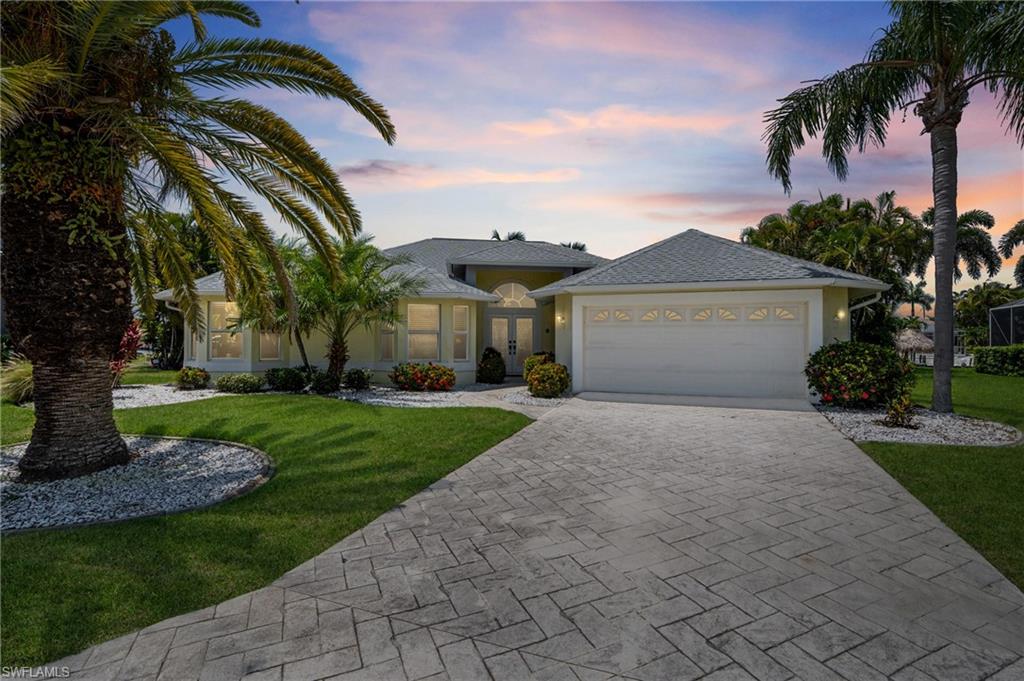
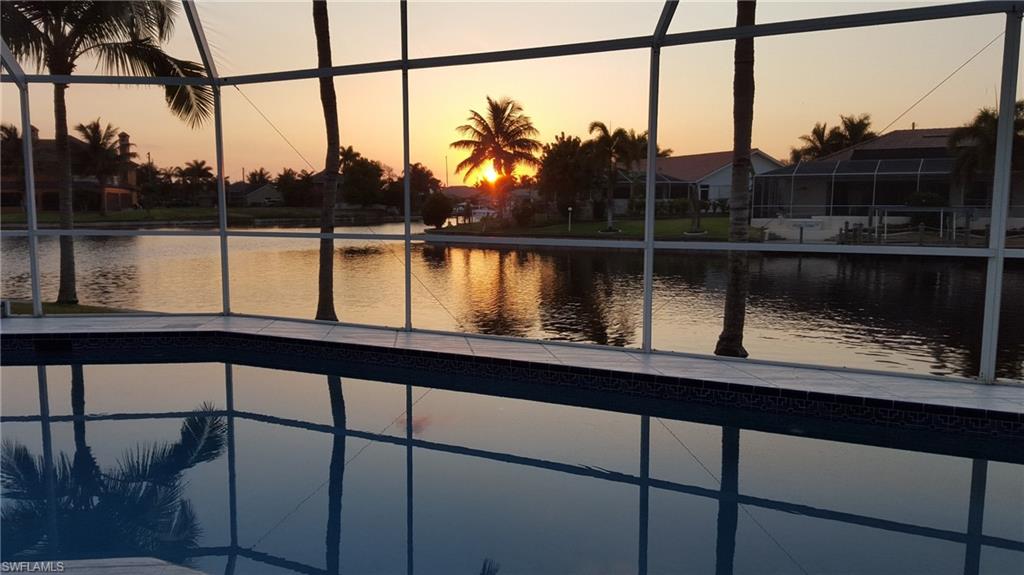
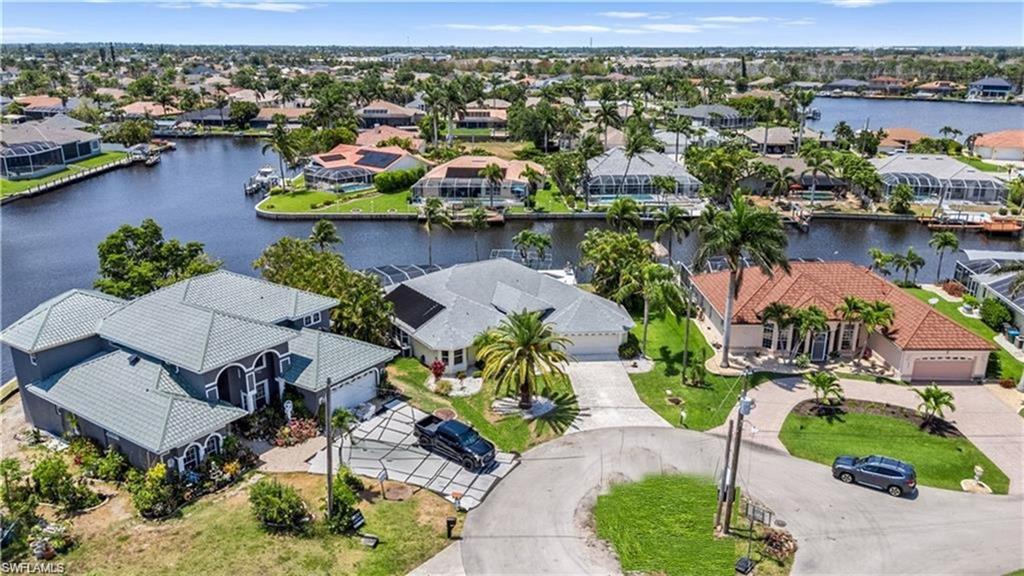
Price Improvement! If you are into boating, fishing, swimming or enjoying beautiful sunny days in a highly appealing gulf access waterfront pool home with gorgeous views - read on. Check out this wide intersecting canal view. It is one of the best in Cape Coral with fewer than 2% located at an intersection of canals. This oversized lot also measures 148 feet of seawall on the water and includes a dock and a lift! The SOUTHWEST REAR EXPOSURE overlooks Delbert and Dinwiddie canals and is just minutes from the river. From the screen enclosed pool with waterfall spa you will enjoy Florida sunshine and breezes all day long throughout the year. It is located on a very quiet cul de sac in the beautiful Four Mile Cove area. This house is convenient to Veterans Bridge and adjacent to the 365 acre Four Mile Cove Ecological Nature Preserve. This spacious home has served as a successful vacation rental for 15 years and could continue for the new owner if interested. Residents and guests will enjoy the many water related features of the property as well as the recreation and dining amenities found throughout the community and in the beautiful subtropical beaches of Southwest Florida. This home conveys turnkey furnished including furniture, kitchen equipment, linens, wall art, Smart TV etc. It is already set up for a new owner who can enjoy all it has to offer or for an investor who wants a steady income! The management company will also continue to provide services if desired. Beyond the double door front entrance is a spacious foyer leading into the large living area. Adding to the ambiance are high ceilings, an abundance of sliders and widows, and updated LED lighting throughout. Lots of natural light! The kitchen is central to the floor plan and features updated custom granite countertops, stainless steel appliances, a breakfast bar and an adjacent dining area. The living room has a fireplace, a large updated ceiling fan and a wall mounted TV large enough to be seen from all parts of the living area. Soak in the panoramic waterfront view from the kitchen, dining area, family room, and both primary bedroom suites. There are three bedrooms, two full baths and a half bath. There are two primary bedroom suites so this is a rare and appealing floor plan as a primary residence or an investment property! Ceiling fans, bay windows, walk-in closets, and new vinyl plank flooring add to the aesthetics, comfort and value of this house. The pool and spa are heated with solar and electric. The roof, screened lanai enclosure and solar panels were updated in 2018. Assessments are paid in full for the central water, sewer and irrigation - a huge savings for the buyer. This property is a rare combination of SOUTHWEST REAR EXPOSURE, INTERSECTING canals, wide water views, 148 feet on the water, and two primary bedroom suites. This house will provide years of enjoyment for a couple, a family or an investor. A wise investment and a place that you will be happy to call home!
Build Your Team
Quickly find investor-friendly professionals who can help you succeed in real estate investing at any stage of the investing journey.


Agents
Match with investor-friendly agents who can help you find, analyze, and close your next deal


Lenders
Get the best funding…find investor-friendly lenders who specialize in your deal strategy


Property Managers
Transition to passive investing. Find a trusted property management partnership that lasts.


Tax Pros & Accountants
Taxes and financial reporting made easy—find experts to create tax savings strategies, file taxes, and more
Location
Property Details
Parking
- Description: Garage
- Details: Garage Door Opener, Paved, Attached
- Garage Spaces: 2
- Spaces Total: 2
Bedroom Information
- # of Bedrooms: 3
Bathroom Information
- # of Baths (Full): 2
- # of Baths (Total): 3.0
Interior Features
- # of Stories: 1
Exterior Features
- Exterior Walls Materials: Stucco
- Roof Type: IRR/Cathedral
- Roof Material: Shingle
- Pool: Yes
Land Information
- Land Use: Residential
- Land Use Subtype: Single Family Residential
Lot Information
- Parcel ID: 294424C305402.0220
- Lot Size: 10411 sqft
Property Information
- Property Type: Single Family Residence
- Style: Ranch, Single Family
- Year Built: 1997
Tax Information
- Annual Tax: $10,406
Utilities
- Heating: Central, Electric
- Cooling: Ceiling Fan(s)
Location
- County: Lee
Listing Details
Investment Summary
- Monthly Cash Flow
- -$1,589
- Cap Rate
- 3.4%
- Cash-on-Cash Return
- -12.5%
- Debt Coverage Ratio
- 0.54
- Internal Rate of Return (5 years)
- -8.1%
Cash Flow
Net Operating Income (NOI) minus mortgage payments.
Calculation:
NOI - Mortgage Payments
Cap Rate (Market Value)
Capitalization Rate is a rate of return that compares the yearly Net Operating Income (NOI) to the market value.
Calculation:
NOI / Market Value
Cash-on-Cash Return (CoC)
Annual Cash Flow / Cash Invested
Calculation:
Annual cash flow divided by initial cash invested.
Debt Coverage Ratio (DCR)
Net Operating Income (NOI) divided by total debt payments.
Calculation:
NOI / Total Debt Payments
Internal Rate of Return (IRR)
A metric for assessing profitability over time. IRR is the discount rate at which the net present value (NPV) of all future cash flows (positive and negative) from an investment equals zero — including both periodic cash flow (such as rent) and a projected sale at the end of the holding period. It represents the expected annualized return, accounting for income, expenses, and the recovery of capital through a future sale.
Purchase Details
Purchase PriceThe price paid for the property. Purchase price:
| $665,000 |
|---|---|
Amount FinancedThe amount of the purchase financed through a loan. Amount financed:
| -$532,000 |
Down paymentThe initial payment made towards the purchase. Down payment:
| $133,000 |
Closing CostsFees and expenses associated with purchasing a property, typically ranging from 2% to 5% of the home’s purchase price, paid at the end of a home purchase to cover services like lending, title transfer, and taxes. Closing costs:
| $19,950 |
Rehab CostsCosts incurred to repair or improve the property, including: roof, flooring, exterior siding, kitchen, exterior paint, bathrooms, etc. Rehab costs:
| $0 |
Initial Cash InvestedThe total initial cash invested in the property. Calculation:Down payment + Buying costs + Rehab costs Initial cash invested:
| $152,950 |
Square Feet (SQFT)The total square footage of the property. Square feet:
| 2,124 |
Cost Per Square FootCost per square foot of the property. Calculation:Purchase Price / Square Feet Cost per square foot:
| $313 |
Monthly Rent Per Square FootMonthly rent divided by the number of square feet. This ratio helps investors compare rental income efficiency across properties, markets, and unit sizes Calculation:Monthly Rent / Square Feet Monthly rent per square foot:
| $1.88 |
Financing Details
Loan AmountThe total sum of money borrowed from a lender to finance a property purchase. Calculation:Purchase Price - Down Payment
Loan amount:
| $532,000 |
|---|---|
Loan to Value Ratio (LTV)Loan amount divided by the market value of the property. Calculation:Loan Amount / Market Value
Loan to value ratio:
| 80.0% |
Loan TypeThe type of loan (e.g., fixed, adjustable).
Loan type:
| Amortizing |
TermThe loan repayment period in years.
Term:
| 30 years |
Interest RateThe percentage a lender charges on the borrowed amount of a loan, determining the cost of borrowing money.
Interest rate:
| 6.840% |
Principal & Interest (PI)The principal is the portion of the loan payment that reduces the loan balance. The interest is the lender's charge for borrowing money. Calculation:(P * r * (1 + r) ** n) / ((1 + r) ** n - 1) Where:
P = Loan amount (principal)
Principal & interest:
| $3,482 |
Property TaxesAnnual taxes levied by local governments on real estate properties. These taxes fund public services like schools, roads, and emergency services.
Property tax:
| $867 |
InsuranceThe costs for insurance coverage to protect against financial losses due to risks like fire, natural disasters, theft, liability, or tenant-related damages. Calculation:Assumes 7% of gross rental income, unless insurance rates are specified.
Insurance:
| $280 |
Private Mortgage Insurance (PMI)A fee that borrowers pay when they take out a conventional loan with a loan-to-value (LTV) ratio above 80%.
Private mortgage insurance (PMI):
| $0 |
Monthly PaymentThe fixed amount a borrower pays each month to repay a loan. It typically includes principal and interest (P&I) and may also cover property taxes, insurance, HOA fees, and PMI if escrowed. Monthly payment:
| $4,629 |
Operating Income
| % Rent | Monthly | Yearly | |
|---|---|---|---|
Gross RentThe total rental income received from tenants before deducting any expenses. Includes base rent, late fees, pet fees, parking fees, and other recurring charges.
Gross rent:
| $4,000 | $48,000 | |
Vacancy LossExpected loss of rent due to vacancies.
Vacancy loss:
(6%)
| 6% | -$240 | -$2,880 |
Operating IncomeGross rental income minus vacancy loss. Calculation:Gross rent - Vacancy loss
Operating income:
| $3,760 | $45,120 |
Operating Expenses
| % Rent | Monthly | Yearly | |
|---|---|---|---|
Property TaxesAnnual taxes levied by local governments on real estate properties. These taxes fund public services like schools, roads, and emergency services. | 22% | -$867 | -$10,406 |
InsuranceThe costs for insurance coverage to protect against financial losses due to risks like fire, natural disasters, theft, liability, or tenant-related damages. Calculation:Assumes 7% of gross rental income, unless insurance rates are specified. | 7% | -$280 | -$3,360 |
Property ManagementThe costs associated with hiring a property manager to handle the day-to-day operations of a rental property. Includes management fees, leasing fes, eviction fees, etc. Calculation:Assumes 8% of gross rental income. | 8% | -$320 | -$3,840 |
Repairs & MaintenanceOngoing costs for routine upkeep and minor fixes needed to keep a property in good working condition. Calculation:Assumes 5% of gross rental income. Varies by property age and condition. | 5% | -$200 | -$2,400 |
Capital ExpensesLarge, infrequent costs for major improvements or replacements, like a new roof, HVAC system, or appliances. Calculation:Assumes 5% of gross rental income. Varies by property age. | 5% | -$200 | -$2,400 |
HOA FeesRegular dues paid to a Homeowners Association for community maintenance, amenities, and management. Similar fees include: Condo Association Fees, Co-op Maintenance Fees, etc. | n/a | n/a | n/a |
Operating ExpensesRecurring costs required to maintain and manage a rental property, including property taxes, insurance, maintenance, repairs, utilities (if paid by the owner), property management fees, and other day-to-day expenses. Calculation:Insurance + Property Taxes + Property Management + Repairs & Maintenance + Capital Expenditures + HOA Fees | 47% | -$1,867 | -$22,406 |
Cash Flow
| Monthly | Yearly | |
|---|---|---|
Net Operating Income (NOI)The income generated from a property after deducting all operating expenses but before deducting mortgage payments, taxes, and capital expenditures. Calculation:Gross Operating Income - Operating Expenses
Net operating income:
| $1,893 | $22,716 |
Mortgage PaymentThe fixed amount a borrower pays each month to repay a loan. It typically includes principal and interest (P&I) and may also cover property taxes, insurance, HOA fees, and PMI if escrowed. | -$3,482 | -$41,784 |
Cash FlowNet Operating Income (NOI) minus mortgage payments. Calculation:NOI - Mortgage Payments | $1,589 | $19,068 |