$355,000
Investment Summary
- Monthly Cash Flow
- -$659
- Cap Rate
- 3.9%
- Cash-on-Cash Return
- -9.7%
- Debt Coverage Ratio
- 0.64
- Internal Rate of Return (5 years)
- -5.4%
Cash Flow
Net Operating Income (NOI) minus mortgage payments.
Calculation:
NOI - Mortgage Payments
Cap Rate (Market Value)
Capitalization Rate is a rate of return that compares the yearly Net Operating Income (NOI) to the market value.
Calculation:
NOI / Market Value
Cash-on-Cash Return (CoC)
Annual Cash Flow / Cash Invested
Calculation:
Annual cash flow divided by initial cash invested.
Debt Coverage Ratio (DCR)
Net Operating Income (NOI) divided by total debt payments.
Calculation:
NOI / Total Debt Payments
Internal Rate of Return (IRR)
A metric for assessing profitability over time. IRR is the discount rate at which the net present value (NPV) of all future cash flows (positive and negative) from an investment equals zero — including both periodic cash flow (such as rent) and a projected sale at the end of the holding period. It represents the expected annualized return, accounting for income, expenses, and the recovery of capital through a future sale.
Property Description
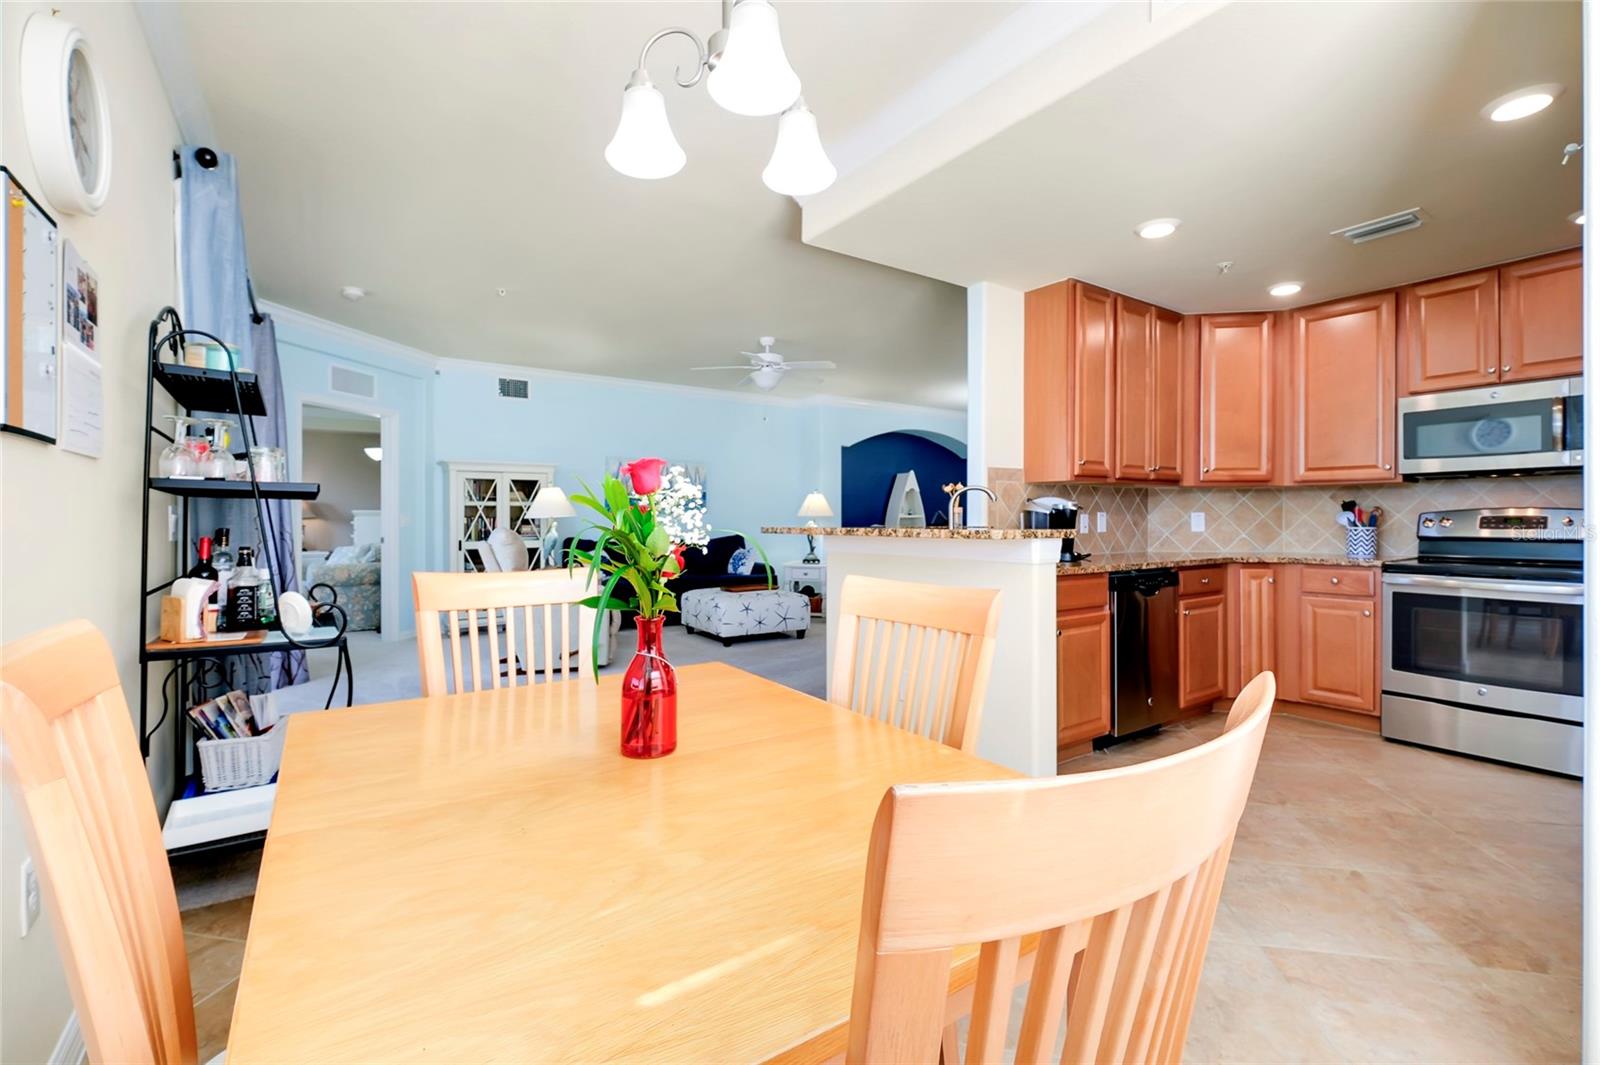
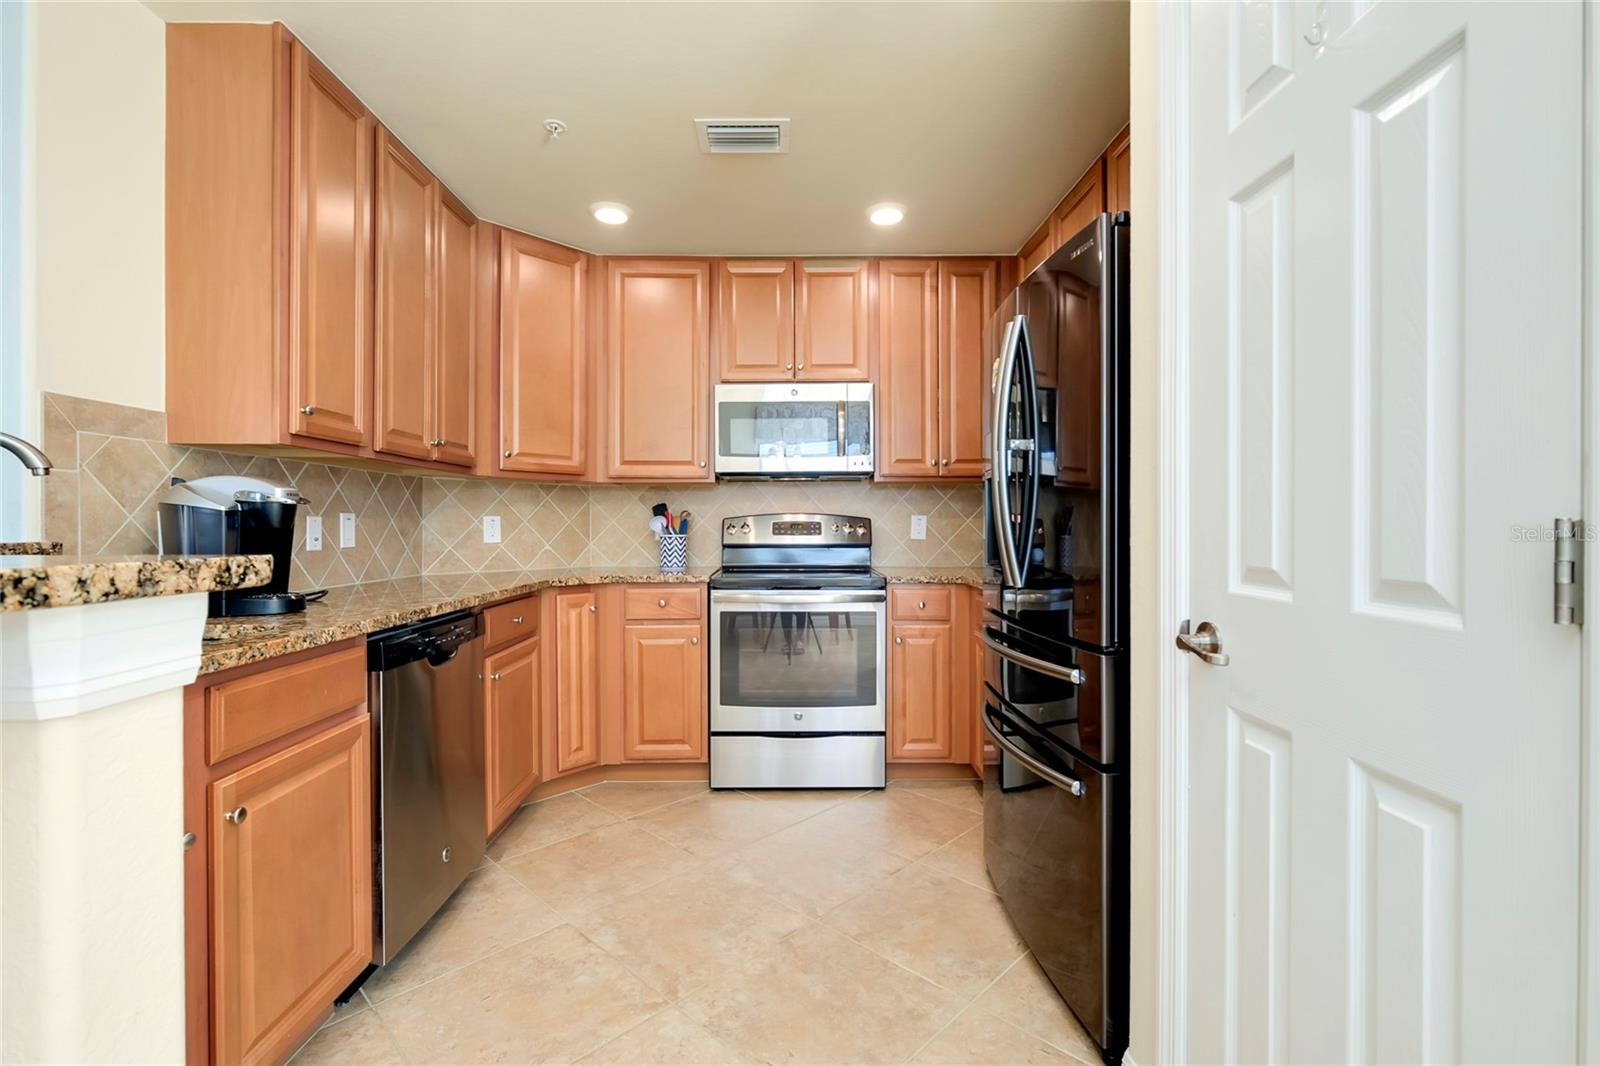
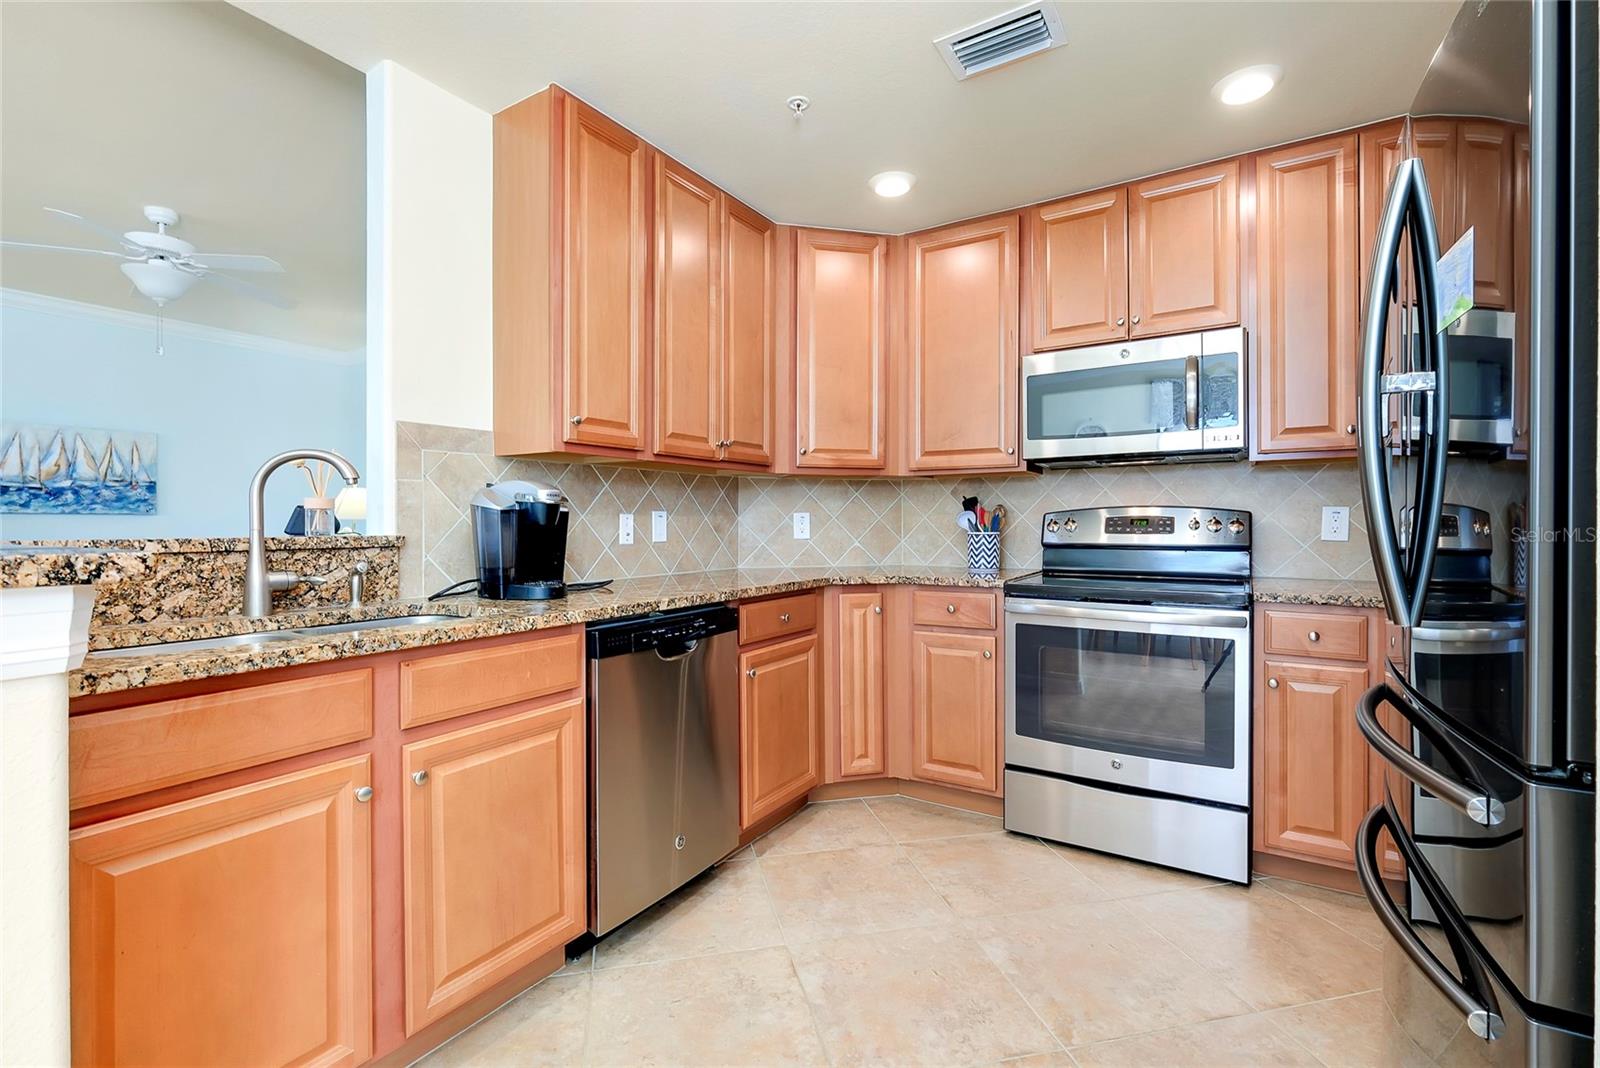
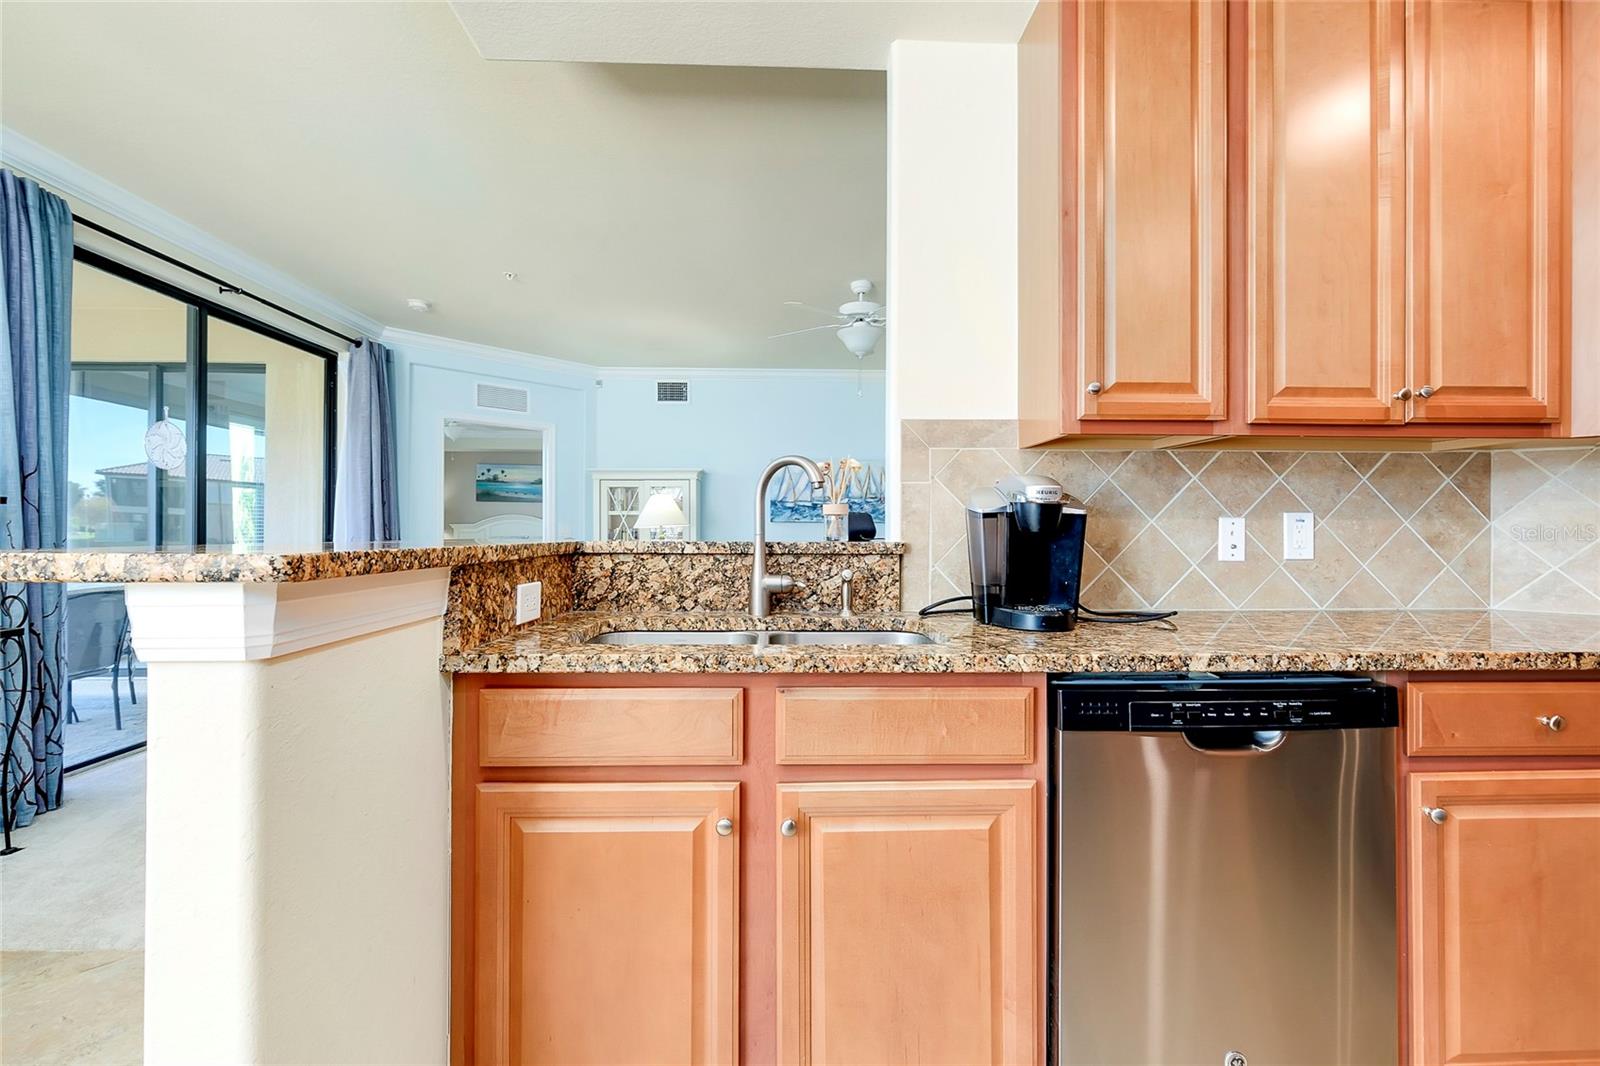
LOWEST PRICED COACH ..... HOME MOVE-IN READY | LAKE VIEW | HURRICANE WINDOWS | NO STAIRS | GATED COMMUNITY | FULLY FURNISHED Stunning 3-Bedroom, 2-Bath First-Floor Coach Home in Gran Paradiso, Venice FL – Turnkey Furnished! Experience luxury Florida living in this beautifully upgraded 3-bedroom, 2-bathroom coach home in the resort-style, maintenance-free community of Gran Paradiso at Wellen Park. Located on the first floor (no stairs!), this spacious 1,706 sq. ft. home features hurricane-impact windows, a built-in fire sprinkler system, and breathtaking lake views from your private 23-ft screened lanai. Key Features & Upgrades: First-Floor, No Stairs – Easy access for all ages; perfect for seasonal or full-time residents. Panoramic Lake Views – Enjoy peaceful water views from your lanai—ideal for relaxing or entertaining. Turnkey Furnished – Professionally decorated and sold fully furnished. Just bring your suitcase! Hurricane-Rated Windows – No shutters required; premium storm protection built-in. Luxury Finishes – Granite countertops, crown molding, high ceilings, upgraded plush carpet, and modern ceiling fans. Smart Home Features – Trane A/C, keyless entry, smart thermostat, garage keypad access. Oversized Storage Room – Rare in coach homes; perfect for bikes, beach gear, and more. Primary Suite Retreat – Spacious bedroom with lake views, dual vanities, walk-in shower, garden tub, and two closets. All Major Appliances Included – Washer, dryer, refrigerator, dishwasher, and more. 2-Car Garage – Ample space for vehicles, golf cart, and storage. Paver Driveway & Walkway – Adds curb appeal and elegance. Fiber Optic Internet + Underground Utilities – Stay connected with fast, reliable service included in HOA. Gran Paradiso Resort-Style Amenities: Heated Lagoon-Style Pool & Spa 24-Hour Fitness Center with state-of-the-art equipment Pickleball, Tennis & Basketball Courts Billiards Room, Library, and Clubhouse Meeting Rooms Men’s & Women’s Saunas and Locker Rooms Outdoor Fireplace & Year-Round Community Events Playground Gated Entrance, Sidewalks, Lush Landscaping, and Onsite Management HOA covers exterior maintenance, roof care, painting, pressure washing, lawn care, irrigation, internet, and cable—making this truly low-maintenance living! Prime Venice, FL Location – Minutes from Everything: Beaches – Manasota Key, Venice Beach & Nokomis Beach are all nearby! Wellen Park Downtown – Waterfront dining, new restaurants, shops & scenic trails. CoolToday Park – Home of the Atlanta Braves Spring Training. Downtown Venice – Historic charm, boutiques, theaters, fine dining, and events. Close to I-75 – Easy access to Sarasota, Fort Myers, and Tampa airports. Why This Home Stands Out: Move-in ready, lightly lived-in, and meticulously maintained. High-demand community with resort amenities and top-tier management. Perfect for snowbirds, full-time residents, or rental investment (ask about seasonal rental potential!). Located in NO FLOOD ZONE – Insurance savings and peace of mind. Schedule your private showing today and make this Florida dream home yours!
Build Your Team
Quickly find investor-friendly professionals who can help you succeed in real estate investing at any stage of the investing journey.


Agents
Match with investor-friendly agents who can help you find, analyze, and close your next deal


Lenders
Get the best funding…find investor-friendly lenders who specialize in your deal strategy


Property Managers
Transition to passive investing. Find a trusted property management partnership that lasts.


Tax Pros & Accountants
Taxes and financial reporting made easy—find experts to create tax savings strategies, file taxes, and more
Location
Property Details
Parking
- Description: Garage
- Details: Attached
- Garage Spaces: 2
- Spaces Total: 0
Bedroom Information
- # of Bedrooms: 3
Bathroom Information
- # of Baths (Full): 2
- # of Baths (Total): 2.0
Interior Features
- # of Rooms: 10
- # of Stories: 1
Exterior Features
- Exterior Walls Materials: Stucco
- Foundation: Slab
- Roof Type: Hip
- Roof Material: Concrete, Tile
HOA
- Has HOA: Yes
- Association: Scott Schlemmel
- HOA Fee: $765/quarterly
Land Information
- Land Use: Residential
- Land Use Subtype: Condominium Unit
Lot Information
- Parcel ID: 0778031073
- Lot Size: 449746 sqft
Property Information
- Property Type: Condominium
- Style: Florida
- Year Built: 2016
Tax Information
- Annual Tax: $6,216
Utilities
- Water & Sewer: Public
- Heating: Central
- Cooling: Central Air
Location
- County: Sarasota
Listing Details
Investment Summary
- Monthly Cash Flow
- -$659
- Cap Rate
- 3.9%
- Cash-on-Cash Return
- -9.7%
- Debt Coverage Ratio
- 0.64
- Internal Rate of Return (5 years)
- -5.4%
Cash Flow
Net Operating Income (NOI) minus mortgage payments.
Calculation:
NOI - Mortgage Payments
Cap Rate (Market Value)
Capitalization Rate is a rate of return that compares the yearly Net Operating Income (NOI) to the market value.
Calculation:
NOI / Market Value
Cash-on-Cash Return (CoC)
Annual Cash Flow / Cash Invested
Calculation:
Annual cash flow divided by initial cash invested.
Debt Coverage Ratio (DCR)
Net Operating Income (NOI) divided by total debt payments.
Calculation:
NOI / Total Debt Payments
Internal Rate of Return (IRR)
A metric for assessing profitability over time. IRR is the discount rate at which the net present value (NPV) of all future cash flows (positive and negative) from an investment equals zero — including both periodic cash flow (such as rent) and a projected sale at the end of the holding period. It represents the expected annualized return, accounting for income, expenses, and the recovery of capital through a future sale.
Purchase Details
Purchase PriceThe price paid for the property. Purchase price:
| $355,000 |
|---|---|
Amount FinancedThe amount of the purchase financed through a loan. Amount financed:
| -$284,000 |
Down paymentThe initial payment made towards the purchase. Down payment:
| $71,000 |
Closing CostsFees and expenses associated with purchasing a property, typically ranging from 2% to 5% of the home’s purchase price, paid at the end of a home purchase to cover services like lending, title transfer, and taxes. Closing costs:
| $10,650 |
Rehab CostsCosts incurred to repair or improve the property, including: roof, flooring, exterior siding, kitchen, exterior paint, bathrooms, etc. Rehab costs:
| $0 |
Initial Cash InvestedThe total initial cash invested in the property. Calculation:Down payment + Buying costs + Rehab costs Initial cash invested:
| $81,650 |
Square Feet (SQFT)The total square footage of the property. Square feet:
| 1,706 |
Cost Per Square FootCost per square foot of the property. Calculation:Purchase Price / Square Feet Cost per square foot:
| $208 |
Monthly Rent Per Square FootMonthly rent divided by the number of square feet. This ratio helps investors compare rental income efficiency across properties, markets, and unit sizes Calculation:Monthly Rent / Square Feet Monthly rent per square foot:
| $1.64 |
Financing Details
Loan AmountThe total sum of money borrowed from a lender to finance a property purchase. Calculation:Purchase Price - Down Payment
Loan amount:
| $284,000 |
|---|---|
Loan to Value Ratio (LTV)Loan amount divided by the market value of the property. Calculation:Loan Amount / Market Value
Loan to value ratio:
| 80.0% |
Loan TypeThe type of loan (e.g., fixed, adjustable).
Loan type:
| Amortizing |
TermThe loan repayment period in years.
Term:
| 30 years |
Interest RateThe percentage a lender charges on the borrowed amount of a loan, determining the cost of borrowing money.
Interest rate:
| 6.625% |
Principal & Interest (PI)The principal is the portion of the loan payment that reduces the loan balance. The interest is the lender's charge for borrowing money. Calculation:(P * r * (1 + r) ** n) / ((1 + r) ** n - 1) Where:
P = Loan amount (principal)
Principal & interest:
| $1,818 |
Property TaxesAnnual taxes levied by local governments on real estate properties. These taxes fund public services like schools, roads, and emergency services.
Property tax:
| $518 |
InsuranceThe costs for insurance coverage to protect against financial losses due to risks like fire, natural disasters, theft, liability, or tenant-related damages. Calculation:Assumes 7% of gross rental income, unless insurance rates are specified.
Insurance:
| $196 |
Private Mortgage Insurance (PMI)A fee that borrowers pay when they take out a conventional loan with a loan-to-value (LTV) ratio above 80%.
Private mortgage insurance (PMI):
| $0 |
Monthly PaymentThe fixed amount a borrower pays each month to repay a loan. It typically includes principal and interest (P&I) and may also cover property taxes, insurance, HOA fees, and PMI if escrowed. Monthly payment:
| $2,532 |
Operating Income
| % Rent | Monthly | Yearly | |
|---|---|---|---|
Gross RentThe total rental income received from tenants before deducting any expenses. Includes base rent, late fees, pet fees, parking fees, and other recurring charges.
Gross rent:
| $2,800 | $33,600 | |
Vacancy LossExpected loss of rent due to vacancies.
Vacancy loss:
(6%)
| 6% | -$168 | -$2,016 |
Operating IncomeGross rental income minus vacancy loss. Calculation:Gross rent - Vacancy loss
Operating income:
| $2,632 | $31,584 |
Operating Expenses
| % Rent | Monthly | Yearly | |
|---|---|---|---|
Property TaxesAnnual taxes levied by local governments on real estate properties. These taxes fund public services like schools, roads, and emergency services. | 19% | -$518 | -$6,217 |
InsuranceThe costs for insurance coverage to protect against financial losses due to risks like fire, natural disasters, theft, liability, or tenant-related damages. Calculation:Assumes 7% of gross rental income, unless insurance rates are specified. | 7% | -$196 | -$2,352 |
Property ManagementThe costs associated with hiring a property manager to handle the day-to-day operations of a rental property. Includes management fees, leasing fes, eviction fees, etc. Calculation:Assumes 8% of gross rental income. | 8% | -$224 | -$2,688 |
Repairs & MaintenanceOngoing costs for routine upkeep and minor fixes needed to keep a property in good working condition. Calculation:Assumes 5% of gross rental income. Varies by property age and condition. | 5% | -$140 | -$1,680 |
Capital ExpensesLarge, infrequent costs for major improvements or replacements, like a new roof, HVAC system, or appliances. Calculation:Assumes 5% of gross rental income. Varies by property age. | 5% | -$140 | -$1,680 |
HOA FeesRegular dues paid to a Homeowners Association for community maintenance, amenities, and management. Similar fees include: Condo Association Fees, Co-op Maintenance Fees, etc. | 9% | -$255 | -$3,060 |
Operating ExpensesRecurring costs required to maintain and manage a rental property, including property taxes, insurance, maintenance, repairs, utilities (if paid by the owner), property management fees, and other day-to-day expenses. Calculation:Insurance + Property Taxes + Property Management + Repairs & Maintenance + Capital Expenditures + HOA Fees | 53% | -$1,473 | -$17,677 |
Cash Flow
| Monthly | Yearly | |
|---|---|---|
Net Operating Income (NOI)The income generated from a property after deducting all operating expenses but before deducting mortgage payments, taxes, and capital expenditures. Calculation:Gross Operating Income - Operating Expenses
Net operating income:
| $1,159 | $13,908 |
Mortgage PaymentThe fixed amount a borrower pays each month to repay a loan. It typically includes principal and interest (P&I) and may also cover property taxes, insurance, HOA fees, and PMI if escrowed. | -$1,818 | -$21,816 |
Cash FlowNet Operating Income (NOI) minus mortgage payments. Calculation:NOI - Mortgage Payments | $659 | $7,908 |