$775,000
Investment Summary
- Monthly Cash Flow
- -$2,218
- Cap Rate
- 2.7%
- Cash-on-Cash Return
- -14.9%
- Debt Coverage Ratio
- 0.44
- Internal Rate of Return (5 years)
- -10.4%
Cash Flow
Net Operating Income (NOI) minus mortgage payments.
Calculation:
NOI - Mortgage Payments
Cap Rate (Market Value)
Capitalization Rate is a rate of return that compares the yearly Net Operating Income (NOI) to the market value.
Calculation:
NOI / Market Value
Cash-on-Cash Return (CoC)
Annual Cash Flow / Cash Invested
Calculation:
Annual cash flow divided by initial cash invested.
Debt Coverage Ratio (DCR)
Net Operating Income (NOI) divided by total debt payments.
Calculation:
NOI / Total Debt Payments
Internal Rate of Return (IRR)
A metric for assessing profitability over time. IRR is the discount rate at which the net present value (NPV) of all future cash flows (positive and negative) from an investment equals zero — including both periodic cash flow (such as rent) and a projected sale at the end of the holding period. It represents the expected annualized return, accounting for income, expenses, and the recovery of capital through a future sale.
Property Description
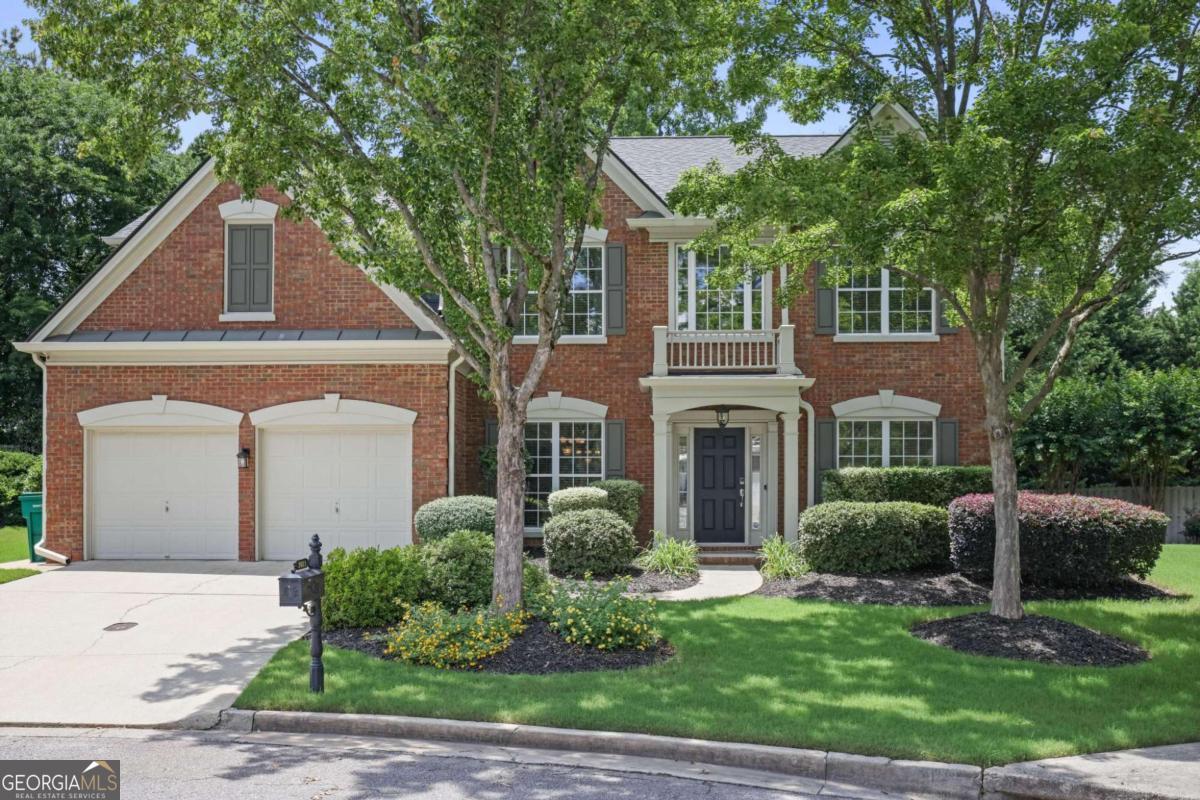
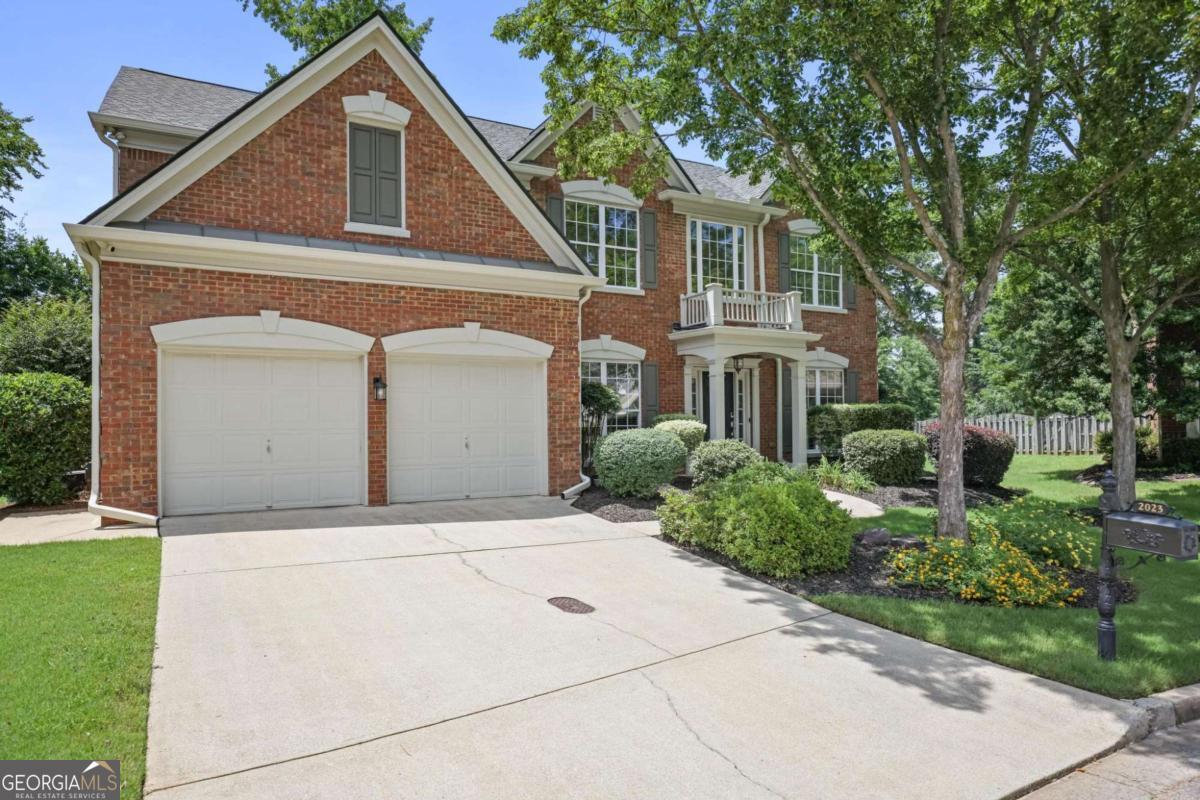
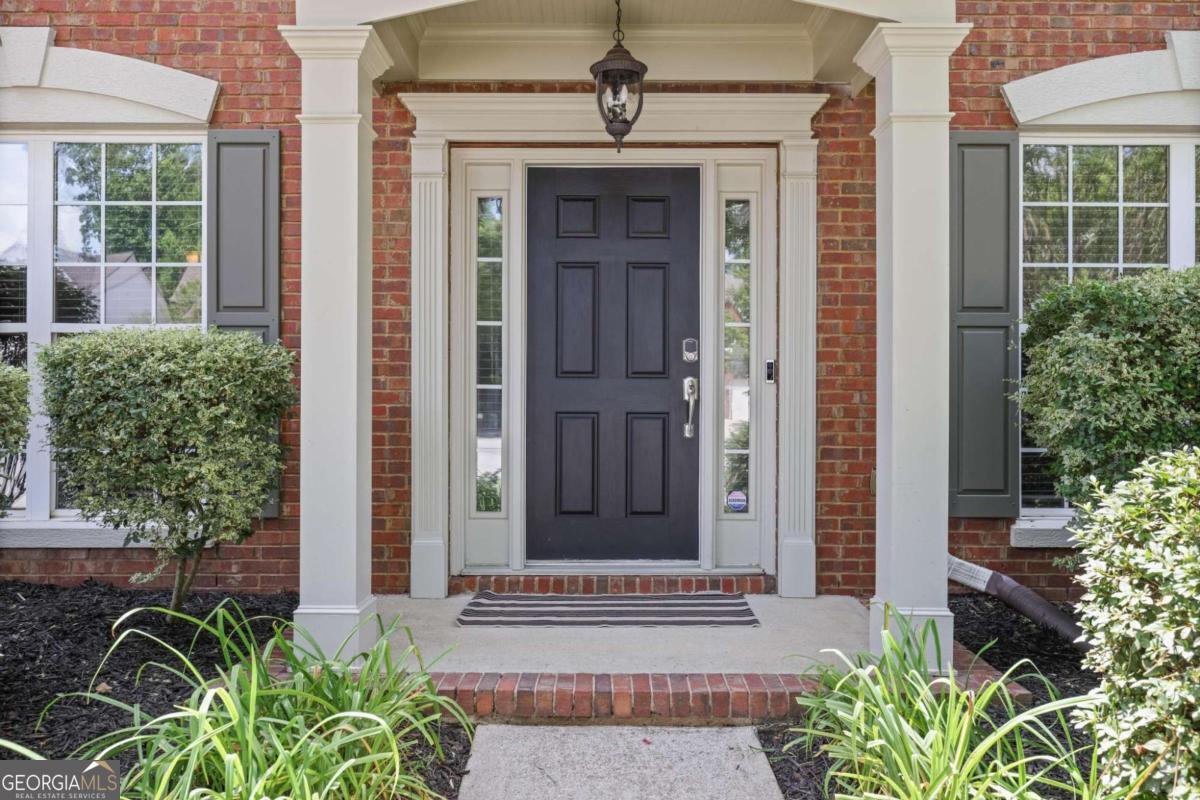
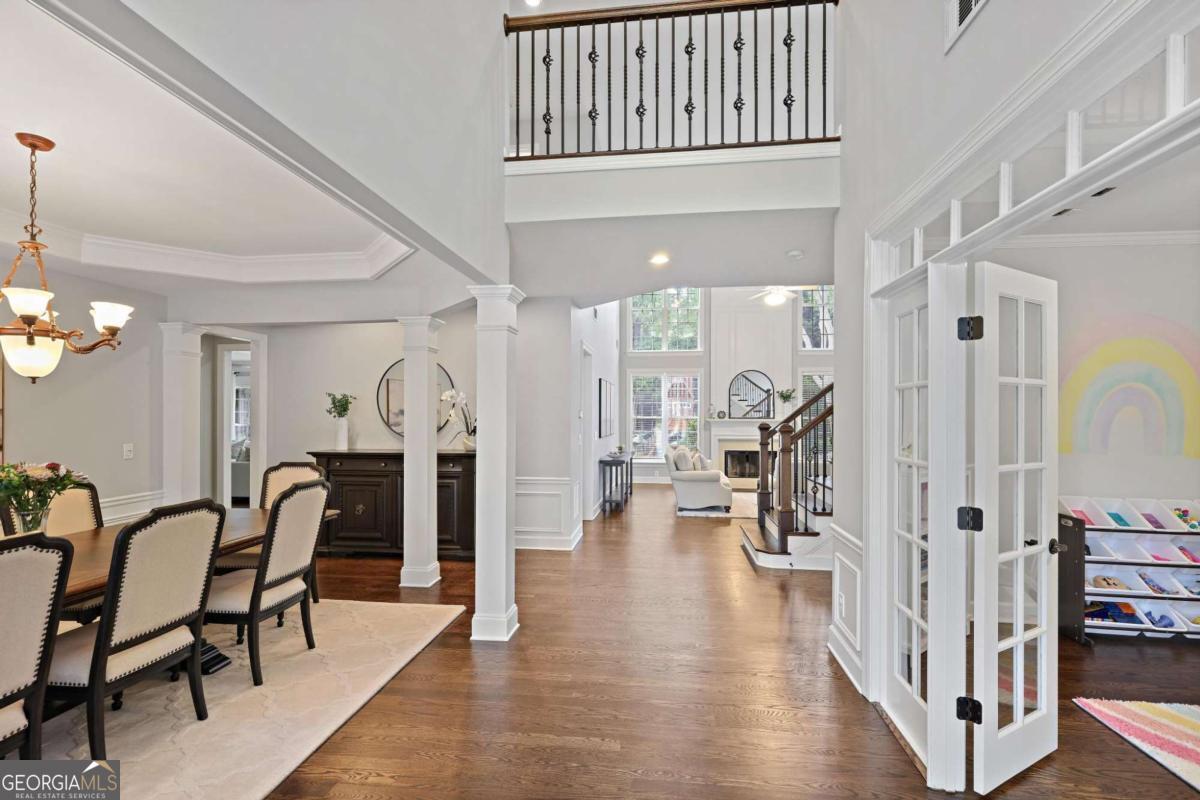
Welcome to 2023 Belridge Court - where elegance meets everyday ease in the heart of Smyrna! Tucked away on a quiet cul-de-sac in one of Smyrna's most desirable neighborhoods, this immaculate brick beauty is a rare find-boasting the largest floor plan and one of the largest lots and backyards in the community with an unbeatable location. From the moment you enter, you're greeted by beautifully refinished hardwood floors that flow gracefully through both levels and highlight the gorgeous open floor plan. A multitude of windows create an abundance of natural light and the spacious two-story great room with fireplace and sweeping staircase is truly a true showstopper. An open dining room and office or playroom space with french doors also grace the foyer for functional living and entertaining. The heart of the home is a fully renovated designer kitchen (updated in 2021) featuring quartz countertops, double ovens, stainless steel appliances, and a built-in beverage fridge. An entertainer's dream, the large kitchen island overlooks a light-filled breakfast nook and a spacious yet cozy keeping room with an additional fireplace and custom cabinetry. Off the kitchen, enjoy your butler's pantry, a mud bench drop-zone just off the garage entry, as well as a fully renovated powder room. Retreat upstairs to your luxurious owner's suite, complete with trey ceilings, a spa-like bath remodeled in 2017 with frameless glass shower, rainfall showerhead, separate soaking tub, quartz dual vanity, and a large walk-in closet for additional storage. Three well sized secondary bedrooms - one including an ensuite full bath and two including spacious walk-in closets, offer space and plentiful storage. Another full hall bath, laundry room with utility sink, and a generous upper hallway linen closet complete your second level. Saving the best for last, step outside from your breakfast nook into your private backyard oasis: A pergola-covered paver patio with built-in fan offers the perfect shady escape, while a leveled green space and mulched play area make it ideal for family fun. Enjoy serene evenings in this thoughtfully landscaped yard-designed for privacy so you can relax without views of neighboring yards. Plus there's two side yards on each side of the house that are perfect additional entertaining, playing, or gardening spaces. Major Upgrades & Peace of Mind Features Include: New Roof (2022), New Gutters (2023), Two New Lennox HVACs & Furnaces w/ 10-Year Warranty (2022), New Water Heater (2023), Full Re-Pipe with PEX (2021) and more (full upgrades list available). With a prime location that's walkable to the neighborhood pool yet quietly tucked away, this home truly has it all: space, style, function, and all the upgrades done for you. Just minutes from Smyrna Market Village, The Battery, Taylor Brawner Park & Food Truck Tuesday, the Silver Comet Trail, and all the major highways, this home is an absolute GEM!
Build Your Team
Quickly find investor-friendly professionals who can help you succeed in real estate investing at any stage of the investing journey.


Agents
Match with investor-friendly agents who can help you find, analyze, and close your next deal


Lenders
Get the best funding…find investor-friendly lenders who specialize in your deal strategy


Property Managers
Transition to passive investing. Find a trusted property management partnership that lasts.


Tax Pros & Accountants
Taxes and financial reporting made easy—find experts to create tax savings strategies, file taxes, and more
Location
Property Details
Parking
- Description: Driveway, Garage
- Details: Garage, Kitchen Level
- Garage Spaces: 2
- Spaces Total: 2
Bedroom Information
- # of Bedrooms: 4
Bathroom Information
- # of Baths (Full): 3
- # of Baths (Partial): 1
- # of Baths (Total): 3.5
Interior Features
- # of Rooms: 9
- # of Stories: 2
- Basement Description: None
- Fireplace: Yes
Exterior Features
- Exterior Walls Materials: Brick
- Foundation: Slab
- Roof Material: Composition
HOA
- Has HOA: Yes
- HOA Fee: $1,200/annually
Land Information
- Land Use: Residential
- Land Use Subtype: Single Family Residential
Lot Information
- Parcel ID: 17070000710
- Lot Size: 0 sqft
Property Information
- Property Type: Single Family Residence
- Style: Brick 3 Side, Traditional
- Year Built: 2002
Tax Information
- Annual Tax: $6,752
Utilities
- Water & Sewer: Public
- Heating: Central, Zoned
- Cooling: Central Air, Zoned
Location
- County: Cobb
Listing Details
Investment Summary
- Monthly Cash Flow
- -$2,218
- Cap Rate
- 2.7%
- Cash-on-Cash Return
- -14.9%
- Debt Coverage Ratio
- 0.44
- Internal Rate of Return (5 years)
- -10.4%
Cash Flow
Net Operating Income (NOI) minus mortgage payments.
Calculation:
NOI - Mortgage Payments
Cap Rate (Market Value)
Capitalization Rate is a rate of return that compares the yearly Net Operating Income (NOI) to the market value.
Calculation:
NOI / Market Value
Cash-on-Cash Return (CoC)
Annual Cash Flow / Cash Invested
Calculation:
Annual cash flow divided by initial cash invested.
Debt Coverage Ratio (DCR)
Net Operating Income (NOI) divided by total debt payments.
Calculation:
NOI / Total Debt Payments
Internal Rate of Return (IRR)
A metric for assessing profitability over time. IRR is the discount rate at which the net present value (NPV) of all future cash flows (positive and negative) from an investment equals zero — including both periodic cash flow (such as rent) and a projected sale at the end of the holding period. It represents the expected annualized return, accounting for income, expenses, and the recovery of capital through a future sale.
Purchase Details
Purchase PriceThe price paid for the property. Purchase price:
| $775,000 |
|---|---|
Amount FinancedThe amount of the purchase financed through a loan. Amount financed:
| -$620,000 |
Down paymentThe initial payment made towards the purchase. Down payment:
| $155,000 |
Closing CostsFees and expenses associated with purchasing a property, typically ranging from 2% to 5% of the home’s purchase price, paid at the end of a home purchase to cover services like lending, title transfer, and taxes. Closing costs:
| $23,250 |
Rehab CostsCosts incurred to repair or improve the property, including: roof, flooring, exterior siding, kitchen, exterior paint, bathrooms, etc. Rehab costs:
| $0 |
Initial Cash InvestedThe total initial cash invested in the property. Calculation:Down payment + Buying costs + Rehab costs Initial cash invested:
| $178,250 |
Square Feet (SQFT)The total square footage of the property. Square feet:
| 3,607 |
Cost Per Square FootCost per square foot of the property. Calculation:Purchase Price / Square Feet Cost per square foot:
| $215 |
Monthly Rent Per Square FootMonthly rent divided by the number of square feet. This ratio helps investors compare rental income efficiency across properties, markets, and unit sizes Calculation:Monthly Rent / Square Feet Monthly rent per square foot:
| $0.97 |
Financing Details
Loan AmountThe total sum of money borrowed from a lender to finance a property purchase. Calculation:Purchase Price - Down Payment
Loan amount:
| $620,000 |
|---|---|
Loan to Value Ratio (LTV)Loan amount divided by the market value of the property. Calculation:Loan Amount / Market Value
Loan to value ratio:
| 80.0% |
Loan TypeThe type of loan (e.g., fixed, adjustable).
Loan type:
| Amortizing |
TermThe loan repayment period in years.
Term:
| 30 years |
Interest RateThe percentage a lender charges on the borrowed amount of a loan, determining the cost of borrowing money.
Interest rate:
| 6.625% |
Principal & Interest (PI)The principal is the portion of the loan payment that reduces the loan balance. The interest is the lender's charge for borrowing money. Calculation:(P * r * (1 + r) ** n) / ((1 + r) ** n - 1) Where:
P = Loan amount (principal)
Principal & interest:
| $3,970 |
Property TaxesAnnual taxes levied by local governments on real estate properties. These taxes fund public services like schools, roads, and emergency services.
Property tax:
| $563 |
InsuranceThe costs for insurance coverage to protect against financial losses due to risks like fire, natural disasters, theft, liability, or tenant-related damages. Calculation:Assumes 7% of gross rental income, unless insurance rates are specified.
Insurance:
| $245 |
Private Mortgage Insurance (PMI)A fee that borrowers pay when they take out a conventional loan with a loan-to-value (LTV) ratio above 80%.
Private mortgage insurance (PMI):
| $0 |
Monthly PaymentThe fixed amount a borrower pays each month to repay a loan. It typically includes principal and interest (P&I) and may also cover property taxes, insurance, HOA fees, and PMI if escrowed. Monthly payment:
| $4,778 |
Operating Income
| % Rent | Monthly | Yearly | |
|---|---|---|---|
Gross RentThe total rental income received from tenants before deducting any expenses. Includes base rent, late fees, pet fees, parking fees, and other recurring charges.
Gross rent:
| $3,500 | $42,000 | |
Vacancy LossExpected loss of rent due to vacancies.
Vacancy loss:
(6%)
| 6% | -$210 | -$2,520 |
Operating IncomeGross rental income minus vacancy loss. Calculation:Gross rent - Vacancy loss
Operating income:
| $3,290 | $39,480 |
Operating Expenses
| % Rent | Monthly | Yearly | |
|---|---|---|---|
Property TaxesAnnual taxes levied by local governments on real estate properties. These taxes fund public services like schools, roads, and emergency services. | 16% | -$563 | -$6,752 |
InsuranceThe costs for insurance coverage to protect against financial losses due to risks like fire, natural disasters, theft, liability, or tenant-related damages. Calculation:Assumes 7% of gross rental income, unless insurance rates are specified. | 7% | -$245 | -$2,940 |
Property ManagementThe costs associated with hiring a property manager to handle the day-to-day operations of a rental property. Includes management fees, leasing fes, eviction fees, etc. Calculation:Assumes 8% of gross rental income. | 8% | -$280 | -$3,360 |
Repairs & MaintenanceOngoing costs for routine upkeep and minor fixes needed to keep a property in good working condition. Calculation:Assumes 5% of gross rental income. Varies by property age and condition. | 5% | -$175 | -$2,100 |
Capital ExpensesLarge, infrequent costs for major improvements or replacements, like a new roof, HVAC system, or appliances. Calculation:Assumes 5% of gross rental income. Varies by property age. | 5% | -$175 | -$2,100 |
HOA FeesRegular dues paid to a Homeowners Association for community maintenance, amenities, and management. Similar fees include: Condo Association Fees, Co-op Maintenance Fees, etc. | 3% | -$100 | -$1,200 |
Operating ExpensesRecurring costs required to maintain and manage a rental property, including property taxes, insurance, maintenance, repairs, utilities (if paid by the owner), property management fees, and other day-to-day expenses. Calculation:Insurance + Property Taxes + Property Management + Repairs & Maintenance + Capital Expenditures + HOA Fees | 44% | -$1,538 | -$18,452 |
Cash Flow
| Monthly | Yearly | |
|---|---|---|
Net Operating Income (NOI)The income generated from a property after deducting all operating expenses but before deducting mortgage payments, taxes, and capital expenditures. Calculation:Gross Operating Income - Operating Expenses
Net operating income:
| $1,752 | $21,024 |
Mortgage PaymentThe fixed amount a borrower pays each month to repay a loan. It typically includes principal and interest (P&I) and may also cover property taxes, insurance, HOA fees, and PMI if escrowed. | -$3,970 | -$47,640 |
Cash FlowNet Operating Income (NOI) minus mortgage payments. Calculation:NOI - Mortgage Payments | $2,218 | $26,616 |