$799,000
Investment Summary
- Monthly Cash Flow
- -$1,951
- Cap Rate
- 3.2%
- Cash-on-Cash Return
- -12.7%
- Debt Coverage Ratio
- 0.52
- Internal Rate of Return (5 years)
- -8.3%
Cash Flow
Net Operating Income (NOI) minus mortgage payments.
Calculation:
NOI - Mortgage Payments
Cap Rate (Market Value)
Capitalization Rate is a rate of return that compares the yearly Net Operating Income (NOI) to the market value.
Calculation:
NOI / Market Value
Cash-on-Cash Return (CoC)
Annual Cash Flow / Cash Invested
Calculation:
Annual cash flow divided by initial cash invested.
Debt Coverage Ratio (DCR)
Net Operating Income (NOI) divided by total debt payments.
Calculation:
NOI / Total Debt Payments
Internal Rate of Return (IRR)
A metric for assessing profitability over time. IRR is the discount rate at which the net present value (NPV) of all future cash flows (positive and negative) from an investment equals zero — including both periodic cash flow (such as rent) and a projected sale at the end of the holding period. It represents the expected annualized return, accounting for income, expenses, and the recovery of capital through a future sale.
Property Description
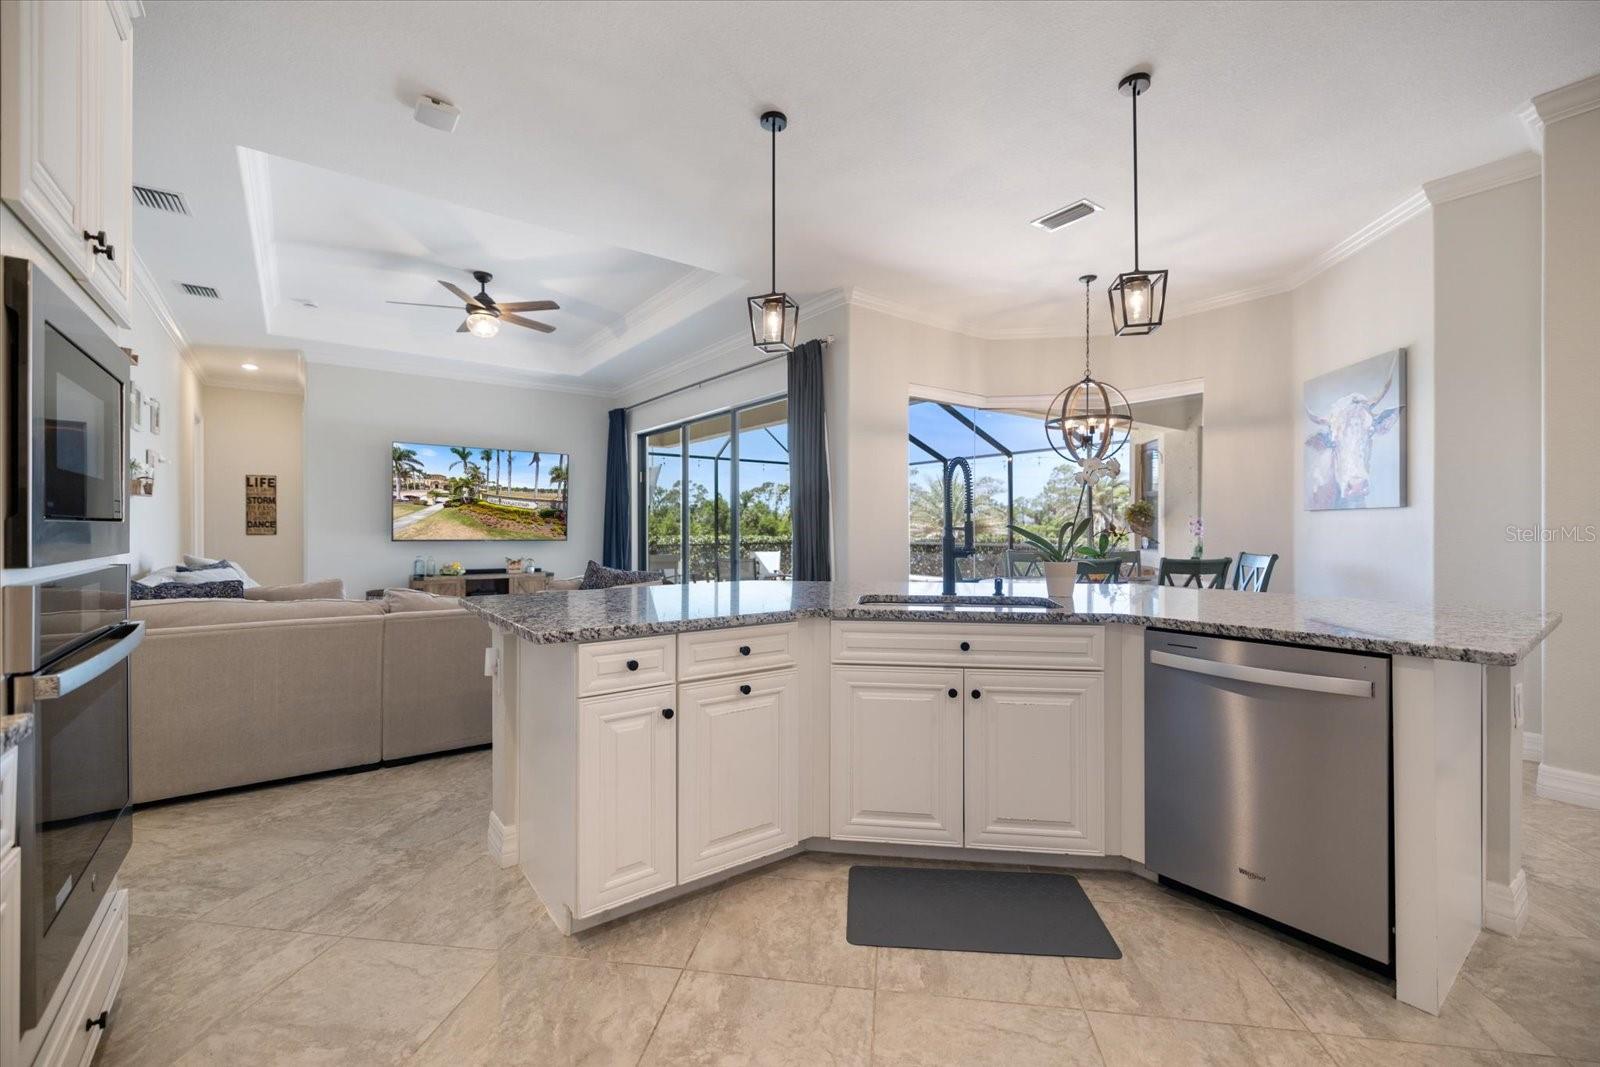
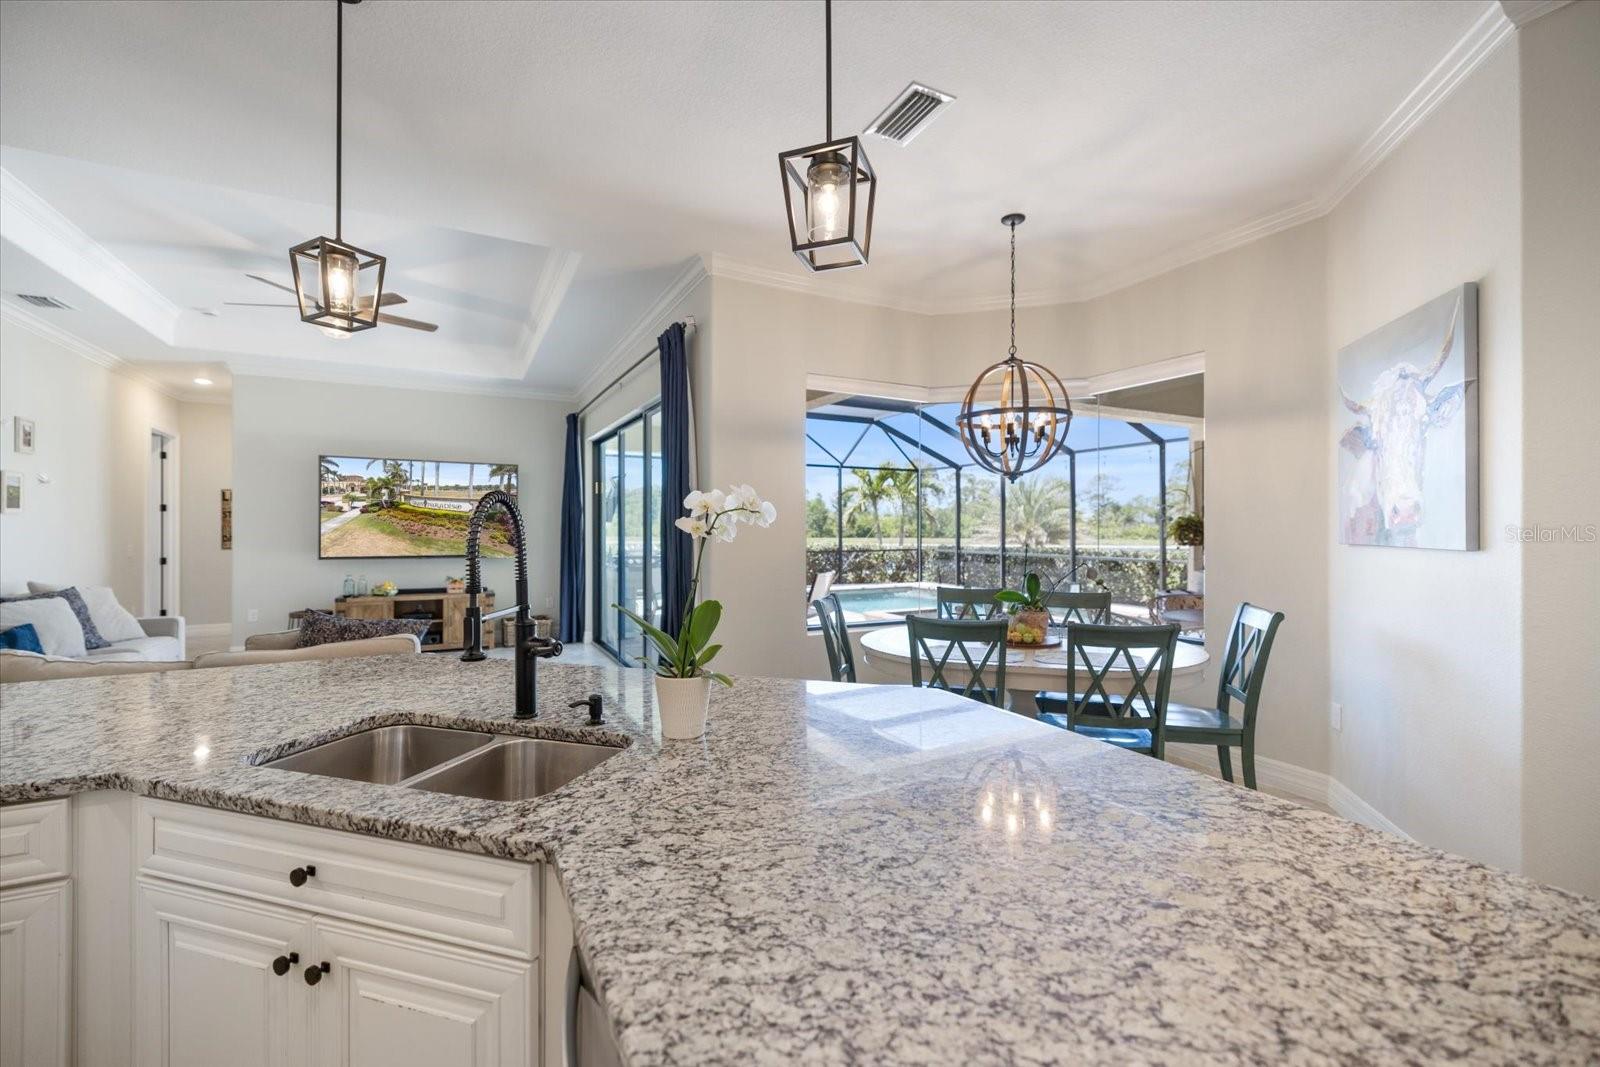
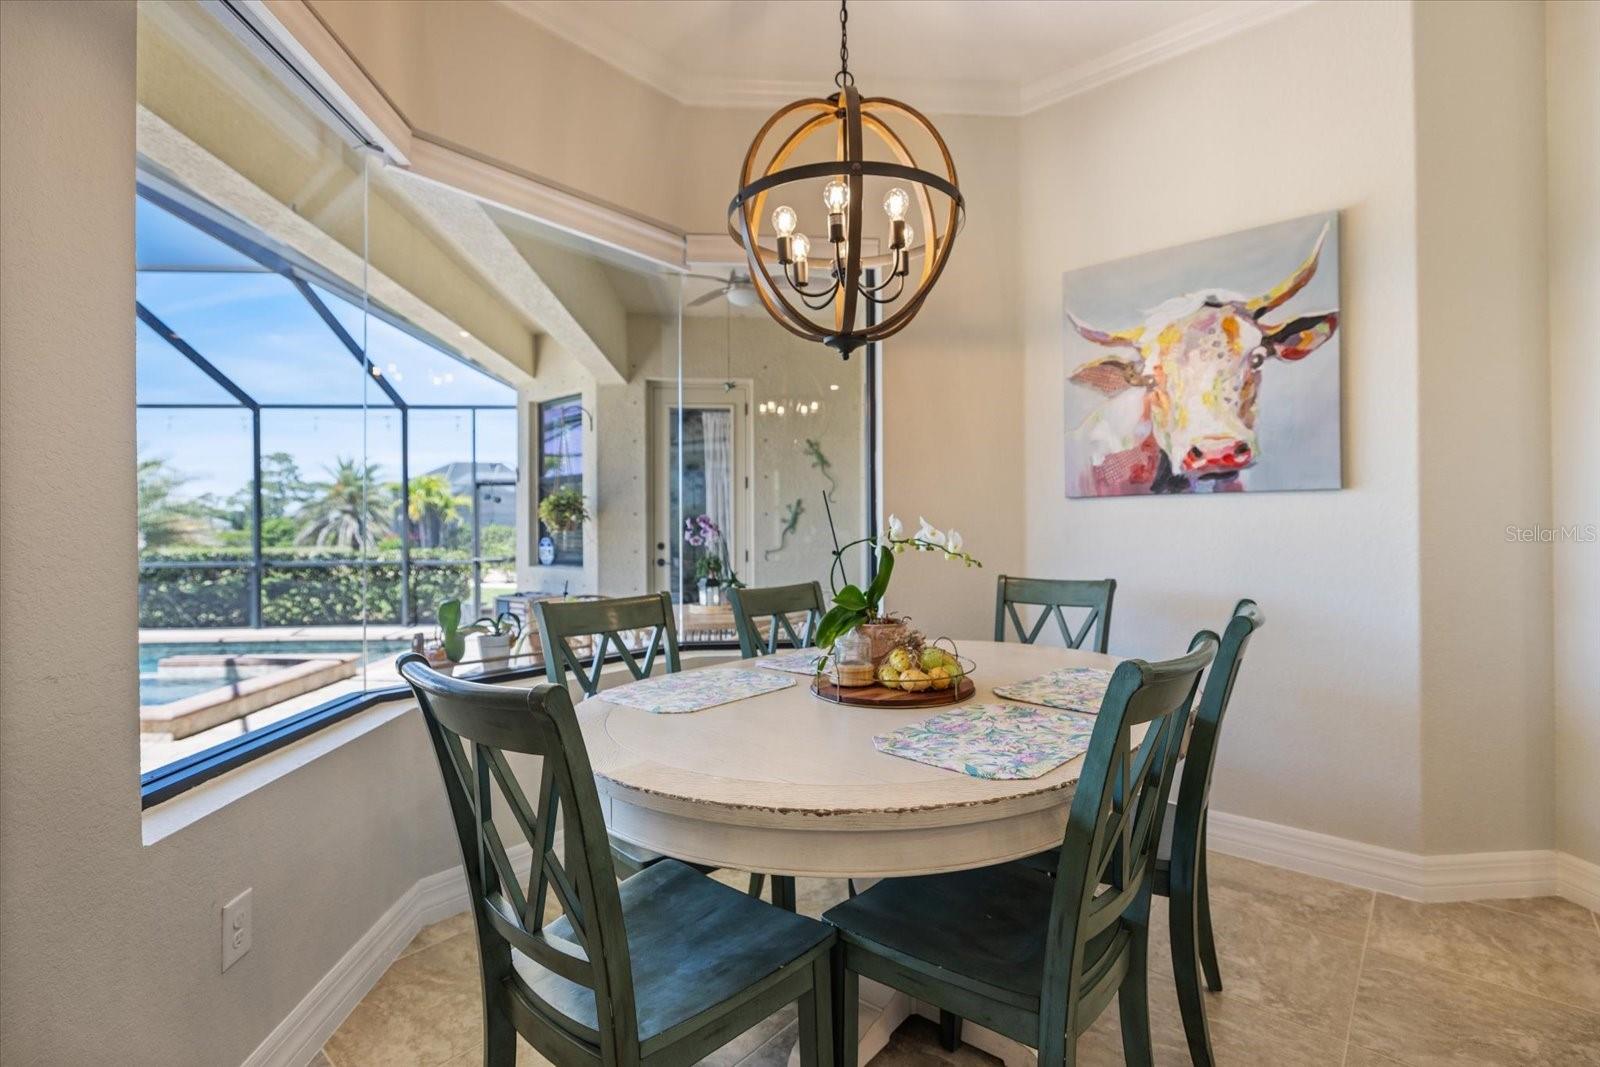
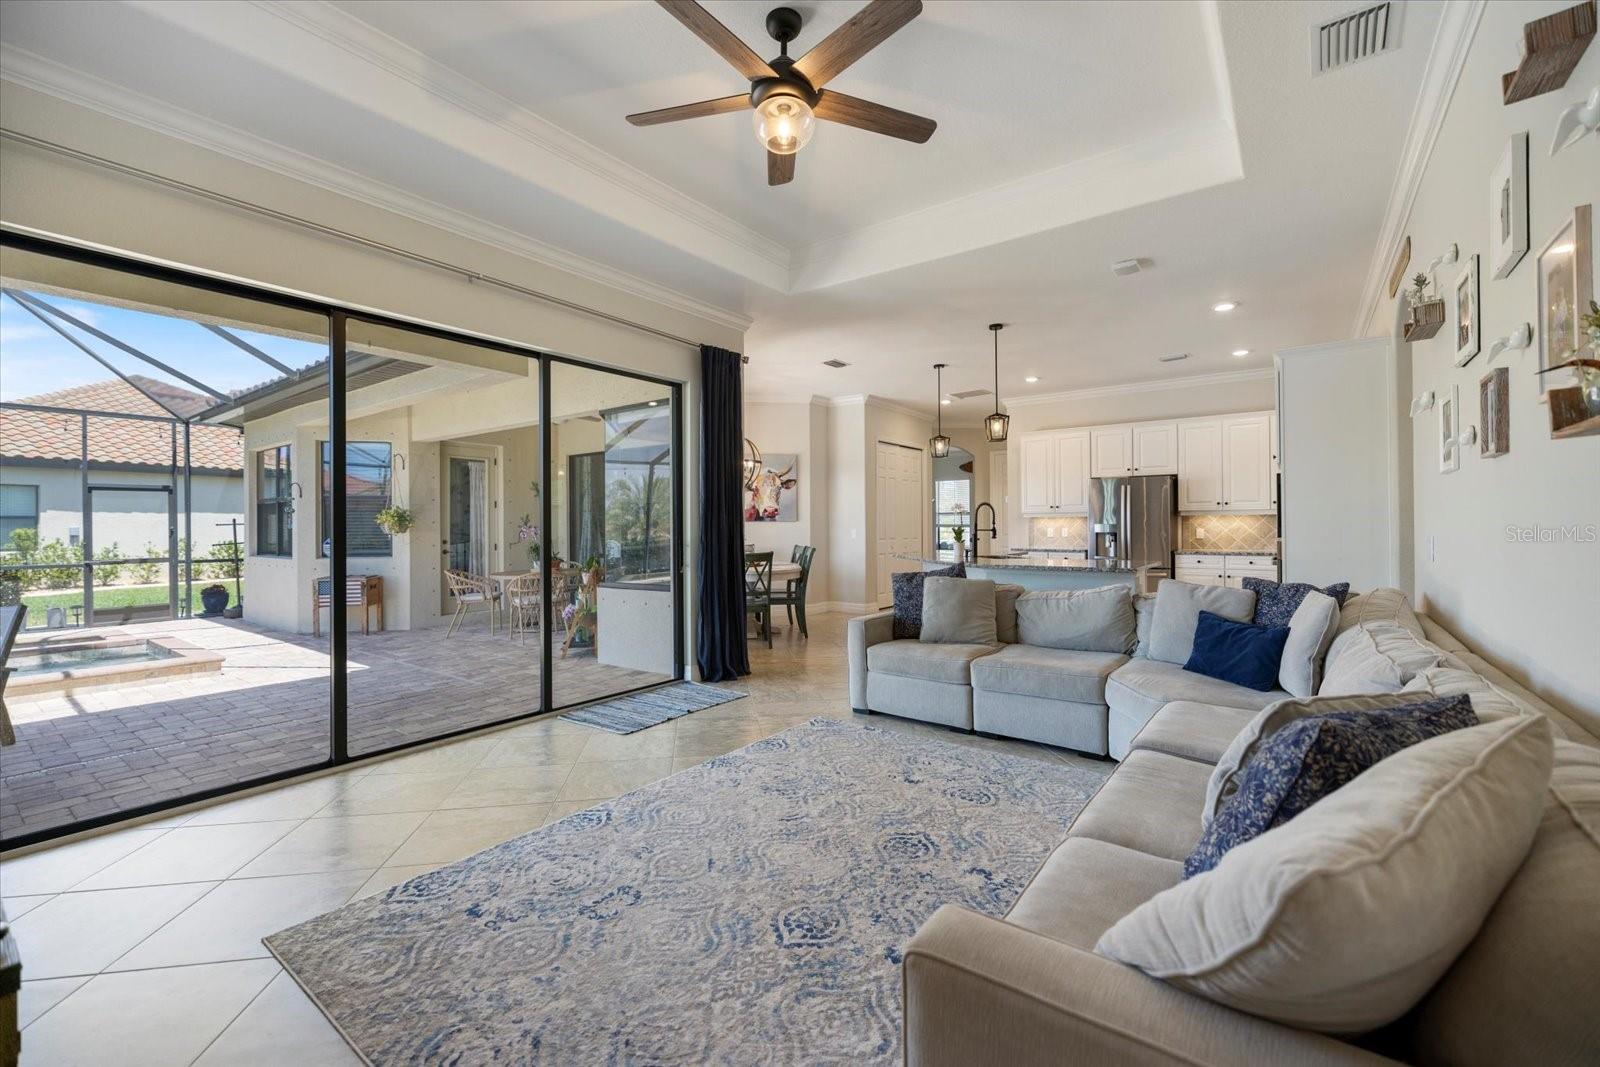
GOLF CART AND 1 YEAR HOME WARRANTY INCLUDED TO NEW BUYER. Welcome to this GOLF CART FRIENDLY community of Wellen Park! This 4 bedroom, 3 full bathroom with 3-CAR garage estate home is stunning! Upgrades galore and stunning water views while watching the Sunset from your exceptional outdoor living space designed for entertaining. From the moment you step into this fully TILED throughout home, you will find a stunning foyer, high ceilings, extended height doorways, custom crown molding, and an open-concept kitchen and living room that is perfect for gatherings with family and friends. The spacious kitchen features plenty of white cabinetry, granite countertops, tiled backsplash, large pantry, and stainless steel appliances. The breakfast nook includes AQUARIUM GLASS, where you will spend most of your time with the best views in the house! The Living Room offers a tray ceiling and opens up with full wall sliders to the Lanai, an abundance of natural light and fresh air is what Florida living is all about. The primary suite is a private retreat with a tray ceiling, bay window overlooking the lake, private entrance to the screened lanai, walk-in closet, spacious en-suite bathroom, stand up shower, separated double sinks, and soaking tub. A formal dining room provides that space for special occasions and larger families. Three extra bedrooms are generously sized, while one at the back of the home would be great as an in-law suite or for guests as it offers a nearby bathroom that doubles as a POOL BATH. The EXPANSIVE screened-in lanai is a must see and adds an additional 1,000 sq feet of outdoor space, with paver decking and panoramic views built for an entertainer. The connected POOL SPA was placed just right, relaxing with the views of the most stunning Florida Sunsets over the lake right from your Lanai oasis. The oversized 3-car garage offers 620 sq ft of space with overhead storage. HURRICANE PROTECTION for all windows/sliders provides that peace of mind along with an X Flood Zone adding no extra costs. A UV light has been added to the HVAC system, improving the indoor air quality of your home. This home is situated on an oversized lot with mature landscaping making your pool exclusively private. Cable, internet, lawn maintenance, and amenities are included the monthly HOA fee. The community is a guard-gated community that offers resort-style amenities, including a clubhouse where many gatherings are offered from ladies nights to happy hours, large resort walk in community pool, fitness center, sauna, hot tub, tennis courts, pickleball courts, basketball courts and playground. Located just minutes from multiple beaches, shopping, dining, CoolToday Atlanta Braves Stadium and Downtown Venice. Take a Golf Cart ride over to the vibrant downtown of Wellen Park for nightly music, concerts, dinner, tournaments, yoga, cycling groups, farmers market, hospitals, schools and so much more. Why keep waiting for that Florida dream lifestyle, book your showing today!
Build Your Team
Quickly find investor-friendly professionals who can help you succeed in real estate investing at any stage of the investing journey.


Agents
Match with investor-friendly agents who can help you find, analyze, and close your next deal


Lenders
Get the best funding…find investor-friendly lenders who specialize in your deal strategy


Property Managers
Transition to passive investing. Find a trusted property management partnership that lasts.


Tax Pros & Accountants
Taxes and financial reporting made easy—find experts to create tax savings strategies, file taxes, and more
Location
Property Details
Parking
- Description: Driveway, Garage Door Opener
- Details: Attached
- Garage Spaces: 3
- Spaces Total: 0
Bedroom Information
- # of Bedrooms: 4
Bathroom Information
- # of Baths (Full): 3
- # of Baths (Total): 3.0
Interior Features
- # of Rooms: 4
- # of Stories: 1
Exterior Features
- Exterior Walls Materials: Stucco
- Foundation: Slab
- Roof Type: Hip
- Roof Material: Shingle
- Pool: Yes
- Pool Community: Yes
HOA
- Has HOA: Yes
- Association: Castle group Gran Paradiso
- HOA Fee: $987/quarterly
Land Information
- Land Use: Residential
- Land Use Subtype: Single Family Residential
Lot Information
- Parcel ID: 0779021131
- Lot Size: 11593 sqft
Property Information
- Property Type: Single Family Residence
- Year Built: 2019
Tax Information
- Annual Tax: $8,434
Utilities
- Water & Sewer: Public
- Heating: Central
- Cooling: Central Air
Location
- County: Sarasota
Listing Details
Investment Summary
- Monthly Cash Flow
- -$1,951
- Cap Rate
- 3.2%
- Cash-on-Cash Return
- -12.7%
- Debt Coverage Ratio
- 0.52
- Internal Rate of Return (5 years)
- -8.3%
Cash Flow
Net Operating Income (NOI) minus mortgage payments.
Calculation:
NOI - Mortgage Payments
Cap Rate (Market Value)
Capitalization Rate is a rate of return that compares the yearly Net Operating Income (NOI) to the market value.
Calculation:
NOI / Market Value
Cash-on-Cash Return (CoC)
Annual Cash Flow / Cash Invested
Calculation:
Annual cash flow divided by initial cash invested.
Debt Coverage Ratio (DCR)
Net Operating Income (NOI) divided by total debt payments.
Calculation:
NOI / Total Debt Payments
Internal Rate of Return (IRR)
A metric for assessing profitability over time. IRR is the discount rate at which the net present value (NPV) of all future cash flows (positive and negative) from an investment equals zero — including both periodic cash flow (such as rent) and a projected sale at the end of the holding period. It represents the expected annualized return, accounting for income, expenses, and the recovery of capital through a future sale.
Purchase Details
Purchase PriceThe price paid for the property. Purchase price:
| $799,000 |
|---|---|
Amount FinancedThe amount of the purchase financed through a loan. Amount financed:
| -$639,200 |
Down paymentThe initial payment made towards the purchase. Down payment:
| $159,800 |
Closing CostsFees and expenses associated with purchasing a property, typically ranging from 2% to 5% of the home’s purchase price, paid at the end of a home purchase to cover services like lending, title transfer, and taxes. Closing costs:
| $23,970 |
Rehab CostsCosts incurred to repair or improve the property, including: roof, flooring, exterior siding, kitchen, exterior paint, bathrooms, etc. Rehab costs:
| $0 |
Initial Cash InvestedThe total initial cash invested in the property. Calculation:Down payment + Buying costs + Rehab costs Initial cash invested:
| $183,770 |
Square Feet (SQFT)The total square footage of the property. Square feet:
| 2,548 |
Cost Per Square FootCost per square foot of the property. Calculation:Purchase Price / Square Feet Cost per square foot:
| $314 |
Monthly Rent Per Square FootMonthly rent divided by the number of square feet. This ratio helps investors compare rental income efficiency across properties, markets, and unit sizes Calculation:Monthly Rent / Square Feet Monthly rent per square foot:
| $1.81 |
Financing Details
Loan AmountThe total sum of money borrowed from a lender to finance a property purchase. Calculation:Purchase Price - Down Payment
Loan amount:
| $639,200 |
|---|---|
Loan to Value Ratio (LTV)Loan amount divided by the market value of the property. Calculation:Loan Amount / Market Value
Loan to value ratio:
| 80.0% |
Loan TypeThe type of loan (e.g., fixed, adjustable).
Loan type:
| Amortizing |
TermThe loan repayment period in years.
Term:
| 30 years |
Interest RateThe percentage a lender charges on the borrowed amount of a loan, determining the cost of borrowing money.
Interest rate:
| 6.625% |
Principal & Interest (PI)The principal is the portion of the loan payment that reduces the loan balance. The interest is the lender's charge for borrowing money. Calculation:(P * r * (1 + r) ** n) / ((1 + r) ** n - 1) Where:
P = Loan amount (principal)
Principal & interest:
| $4,093 |
Property TaxesAnnual taxes levied by local governments on real estate properties. These taxes fund public services like schools, roads, and emergency services.
Property tax:
| $703 |
InsuranceThe costs for insurance coverage to protect against financial losses due to risks like fire, natural disasters, theft, liability, or tenant-related damages. Calculation:Assumes 7% of gross rental income, unless insurance rates are specified.
Insurance:
| $322 |
Private Mortgage Insurance (PMI)A fee that borrowers pay when they take out a conventional loan with a loan-to-value (LTV) ratio above 80%.
Private mortgage insurance (PMI):
| $0 |
Monthly PaymentThe fixed amount a borrower pays each month to repay a loan. It typically includes principal and interest (P&I) and may also cover property taxes, insurance, HOA fees, and PMI if escrowed. Monthly payment:
| $5,118 |
Operating Income
| % Rent | Monthly | Yearly | |
|---|---|---|---|
Gross RentThe total rental income received from tenants before deducting any expenses. Includes base rent, late fees, pet fees, parking fees, and other recurring charges.
Gross rent:
| $4,600 | $55,200 | |
Vacancy LossExpected loss of rent due to vacancies.
Vacancy loss:
(6%)
| 6% | -$276 | -$3,312 |
Operating IncomeGross rental income minus vacancy loss. Calculation:Gross rent - Vacancy loss
Operating income:
| $4,324 | $51,888 |
Operating Expenses
| % Rent | Monthly | Yearly | |
|---|---|---|---|
Property TaxesAnnual taxes levied by local governments on real estate properties. These taxes fund public services like schools, roads, and emergency services. | 15% | -$703 | -$8,434 |
InsuranceThe costs for insurance coverage to protect against financial losses due to risks like fire, natural disasters, theft, liability, or tenant-related damages. Calculation:Assumes 7% of gross rental income, unless insurance rates are specified. | 7% | -$322 | -$3,864 |
Property ManagementThe costs associated with hiring a property manager to handle the day-to-day operations of a rental property. Includes management fees, leasing fes, eviction fees, etc. Calculation:Assumes 8% of gross rental income. | 8% | -$368 | -$4,416 |
Repairs & MaintenanceOngoing costs for routine upkeep and minor fixes needed to keep a property in good working condition. Calculation:Assumes 5% of gross rental income. Varies by property age and condition. | 5% | -$230 | -$2,760 |
Capital ExpensesLarge, infrequent costs for major improvements or replacements, like a new roof, HVAC system, or appliances. Calculation:Assumes 5% of gross rental income. Varies by property age. | 5% | -$230 | -$2,760 |
HOA FeesRegular dues paid to a Homeowners Association for community maintenance, amenities, and management. Similar fees include: Condo Association Fees, Co-op Maintenance Fees, etc. | 7% | -$329 | -$3,948 |
Operating ExpensesRecurring costs required to maintain and manage a rental property, including property taxes, insurance, maintenance, repairs, utilities (if paid by the owner), property management fees, and other day-to-day expenses. Calculation:Insurance + Property Taxes + Property Management + Repairs & Maintenance + Capital Expenditures + HOA Fees | 47% | -$2,182 | -$26,182 |
Cash Flow
| Monthly | Yearly | |
|---|---|---|
Net Operating Income (NOI)The income generated from a property after deducting all operating expenses but before deducting mortgage payments, taxes, and capital expenditures. Calculation:Gross Operating Income - Operating Expenses
Net operating income:
| $2,142 | $25,704 |
Mortgage PaymentThe fixed amount a borrower pays each month to repay a loan. It typically includes principal and interest (P&I) and may also cover property taxes, insurance, HOA fees, and PMI if escrowed. | -$4,093 | -$49,116 |
Cash FlowNet Operating Income (NOI) minus mortgage payments. Calculation:NOI - Mortgage Payments | $1,951 | $23,412 |