


$1,950,000
Investment Summary
- Monthly Cash Flow
- -$5,668
- Cap Rate
- 2.2%
- Cash-on-Cash Return
- -15.2%
- Debt Coverage Ratio
- 0.39
- Internal Rate of Return (5 years)
- -10.7%
Cash Flow
Net Operating Income (NOI) minus mortgage payments.
Calculation:
NOI - Mortgage Payments
Cap Rate (Market Value)
Capitalization Rate is a rate of return that compares the yearly Net Operating Income (NOI) to the market value.
Calculation:
NOI / Market Value
Cash-on-Cash Return (CoC)
Annual Cash Flow / Cash Invested
Calculation:
Annual cash flow divided by initial cash invested.
Debt Coverage Ratio (DCR)
Net Operating Income (NOI) divided by total debt payments.
Calculation:
NOI / Total Debt Payments
Internal Rate of Return (IRR)
A metric for assessing profitability over time. IRR is the discount rate at which the net present value (NPV) of all future cash flows (positive and negative) from an investment equals zero — including both periodic cash flow (such as rent) and a projected sale at the end of the holding period. It represents the expected annualized return, accounting for income, expenses, and the recovery of capital through a future sale.
Property Description
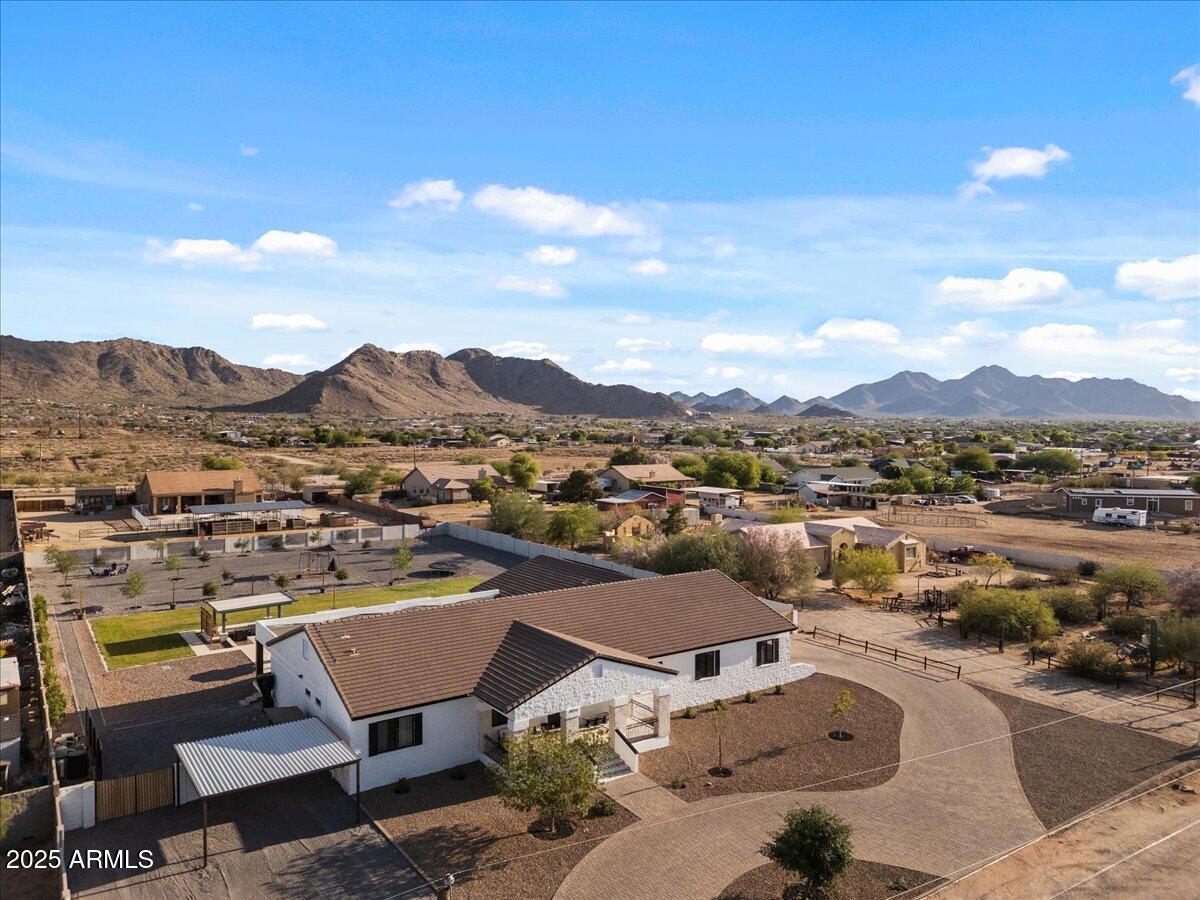
**Voted BEST on Queen Creek LUXURY HOME TOUR** Welcome to this ONE OF A KIND property, where superior craftsmanship meets panoramic views. This DISTINGUISHED property offers TWO separate LIVING AREAS within one home, making it ideal for multi-gen living, outdoor enthusiasts or a home office. There are NO HOA FEES OR RESTRICTIONS. This CUSTOM 6 bedroom Ranch estate features 4,278sf of refined living space on a substantial 1.25-ACRE LOT. Boasting a striking white, energy-efficient SPLIT FACE BLOCK exterior with a tile roof, seamlessly blending modern amenities with timeless elegance. Enjoy breathtaking MOUNTAIN VIEWS and PRIVACY afforded by this meticulously-maintained property. The RESORT-STYLE backyard facilitates seamless indoor-outdoor living, designed for those who love to entertain! Your dream home awaits you offering 2 living spaces; 6 generously sized bedrooms, 2 master suites and 4 full bathrooms, there's room for everyone to have their own space or support alternative living arrangements. The expansive 1.25-acre lot provides endless opportunities for outdoor play and family gatherings; and who can resist a lavish swimming pool for those hot Arizona days? The centerpiece of this home, a spacious kitchen that is an entertainer's dream. While boasting a large island, stainless-steel appliances and a gourmet gas range that is perfect for the aspiring chef. The kitchen flows seamlessly to both the main family room and the backyard oasis. The grand-living area, bathed in natural light creates an atmosphere of unparalleled elegance, opening onto a large, covered patio, making it ideal for entertaining and poolside activities. Experience luxury with this extra-large pool, featuring refreshing, crystal-clear water and various water features. It includes a Baja area and swim-up bar. The pool offers built-in seating, shallow areas for kids, deeper sections for adults and diving, ensuring there's something for everyone. The BBQ area is equipped with a pellet BBQ smoker/grill, an outdoor refrigerator, and a bar area for your convenience. Pool management is effortless with IntelliCenter, a state-of-the-art pool and spa automation system. This system allows you to control various pool and spa features, including lights, pumps, heaters, and water features, remotely through a mobile app or touchscreen interface. Additionally, the pool features two heaters: an electric heater that takes the chill off the water before summer, and a gas heater that quickly warms the hot tub or pool for gatherings. Enjoy the perfect combination of comfort and convenience! Impressive finishing touches include wood-look tile flooring, quartz countertops, stylish tile backsplashes, new hardware throughout; and new dual-pane windows, patio sliders and garage doors. The property has been freshly painted inside and out. Additional outdoor features include citrus trees, a custom dog run, and chicken coop complete with chickens; all adding to the charm of this magnificent estate. Space for all your toys, an RV Garage, Horses, maybe a Casita and more. Don't miss the opportunity to make 20715 E Watford Dr your forever home. This property offers the space, comfort, and location your family deserves.
Build Your Team
Quickly find investor-friendly professionals who can help you succeed in real estate investing at any stage of the investing journey.


Agents
Match with investor-friendly agents who can help you find, analyze, and close your next deal


Lenders
Get the best funding…find investor-friendly lenders who specialize in your deal strategy


Property Managers
Transition to passive investing. Find a trusted property management partnership that lasts.


Tax Pros & Accountants
Taxes and financial reporting made easy—find experts to create tax savings strategies, file taxes, and more
Location
Property Details
Parking
- Description: Electric Door Opener, RV Gate, RV Access/Parking
- Details: RV Access/Parking, Garage Door Opener, Direct Access, Circular Driveway
- Garage Spaces: 3
- Spaces Total: 6
Bedroom Information
- # of Bedrooms: 6
Bathroom Information
- # of Baths (Total): 4.0
Interior Features
- # of Rooms: 9
- # of Stories: 1
- Fireplace: Yes
Exterior Features
- Exterior Walls Materials: Block
- Roof Material: Tile, Concrete, Rolled/Hot Mop
- Pool: Yes
Land Information
- Land Use: Residential
- Land Use Subtype: Single Family Residential
Lot Information
- Parcel ID: 30491049K
- Lot Size: 54450 sqft
Property Information
- Property Type: Single Family Residence
- Style: Ranch
- Year Built: 2006
Tax Information
- Annual Tax: $4,473
Utilities
- Water & Sewer: Public
- Heating: ENERGY STAR Qualified Equipment, Electric
- Cooling: Central Air, Ceiling Fan(s), ENERGY STAR Qualified Equipment
Location
- County: Maricopa
Listing Details
Investment Summary
- Monthly Cash Flow
- -$5,668
- Cap Rate
- 2.2%
- Cash-on-Cash Return
- -15.2%
- Debt Coverage Ratio
- 0.39
- Internal Rate of Return (5 years)
- -10.7%
Cash Flow
Net Operating Income (NOI) minus mortgage payments.
Calculation:
NOI - Mortgage Payments
Cap Rate (Market Value)
Capitalization Rate is a rate of return that compares the yearly Net Operating Income (NOI) to the market value.
Calculation:
NOI / Market Value
Cash-on-Cash Return (CoC)
Annual Cash Flow / Cash Invested
Calculation:
Annual cash flow divided by initial cash invested.
Debt Coverage Ratio (DCR)
Net Operating Income (NOI) divided by total debt payments.
Calculation:
NOI / Total Debt Payments
Internal Rate of Return (IRR)
A metric for assessing profitability over time. IRR is the discount rate at which the net present value (NPV) of all future cash flows (positive and negative) from an investment equals zero — including both periodic cash flow (such as rent) and a projected sale at the end of the holding period. It represents the expected annualized return, accounting for income, expenses, and the recovery of capital through a future sale.
Purchase Details
Purchase PriceThe price paid for the property. Purchase price:
| $1,950,000 |
|---|---|
Amount FinancedThe amount of the purchase financed through a loan. Amount financed:
| -$1,560,000 |
Down paymentThe initial payment made towards the purchase. Down payment:
| $390,000 |
Closing CostsFees and expenses associated with purchasing a property, typically ranging from 2% to 5% of the home’s purchase price, paid at the end of a home purchase to cover services like lending, title transfer, and taxes. Closing costs:
| $58,500 |
Rehab CostsCosts incurred to repair or improve the property, including: roof, flooring, exterior siding, kitchen, exterior paint, bathrooms, etc. Rehab costs:
| $0 |
Initial Cash InvestedThe total initial cash invested in the property. Calculation:Down payment + Buying costs + Rehab costs Initial cash invested:
| $448,500 |
Square Feet (SQFT)The total square footage of the property. Square feet:
| 4,278 |
Cost Per Square FootCost per square foot of the property. Calculation:Purchase Price / Square Feet Cost per square foot:
| $456 |
Monthly Rent Per Square FootMonthly rent divided by the number of square feet. This ratio helps investors compare rental income efficiency across properties, markets, and unit sizes Calculation:Monthly Rent / Square Feet Monthly rent per square foot:
| $1.33 |
Financing Details
Loan AmountThe total sum of money borrowed from a lender to finance a property purchase. Calculation:Purchase Price - Down Payment
Loan amount:
| $1,560,000 |
|---|---|
Loan to Value Ratio (LTV)Loan amount divided by the market value of the property. Calculation:Loan Amount / Market Value
Loan to value ratio:
| 80.0% |
Loan TypeThe type of loan (e.g., fixed, adjustable).
Loan type:
| Amortizing |
TermThe loan repayment period in years.
Term:
| 30 years |
Interest RateThe percentage a lender charges on the borrowed amount of a loan, determining the cost of borrowing money.
Interest rate:
| 5.875% |
Principal & Interest (PI)The principal is the portion of the loan payment that reduces the loan balance. The interest is the lender's charge for borrowing money. Calculation:(P * r * (1 + r) ** n) / ((1 + r) ** n - 1) Where:
P = Loan amount (principal)
Principal & interest:
| $9,228 |
Property TaxesAnnual taxes levied by local governments on real estate properties. These taxes fund public services like schools, roads, and emergency services.
Property tax:
| $373 |
InsuranceThe costs for insurance coverage to protect against financial losses due to risks like fire, natural disasters, theft, liability, or tenant-related damages. Calculation:Assumes 7% of gross rental income, unless insurance rates are specified.
Insurance:
| $399 |
Private Mortgage Insurance (PMI)A fee that borrowers pay when they take out a conventional loan with a loan-to-value (LTV) ratio above 80%.
Private mortgage insurance (PMI):
| $0 |
Monthly PaymentThe fixed amount a borrower pays each month to repay a loan. It typically includes principal and interest (P&I) and may also cover property taxes, insurance, HOA fees, and PMI if escrowed. Monthly payment:
| $10,000 |
Operating Income
| % Rent | Monthly | Yearly | |
|---|---|---|---|
Gross RentThe total rental income received from tenants before deducting any expenses. Includes base rent, late fees, pet fees, parking fees, and other recurring charges.
Gross rent:
| $5,700 | $68,400 | |
Vacancy LossExpected loss of rent due to vacancies.
Vacancy loss:
(6%)
| 6% | -$342 | -$4,104 |
Operating IncomeGross rental income minus vacancy loss. Calculation:Gross rent - Vacancy loss
Operating income:
| $5,358 | $64,296 |
Operating Expenses
| % Rent | Monthly | Yearly | |
|---|---|---|---|
Property TaxesAnnual taxes levied by local governments on real estate properties. These taxes fund public services like schools, roads, and emergency services. | 7% | -$373 | -$4,473 |
InsuranceThe costs for insurance coverage to protect against financial losses due to risks like fire, natural disasters, theft, liability, or tenant-related damages. Calculation:Assumes 7% of gross rental income, unless insurance rates are specified. | 7% | -$399 | -$4,788 |
Property ManagementThe costs associated with hiring a property manager to handle the day-to-day operations of a rental property. Includes management fees, leasing fes, eviction fees, etc. Calculation:Assumes 8% of gross rental income. | 8% | -$456 | -$5,472 |
Repairs & MaintenanceOngoing costs for routine upkeep and minor fixes needed to keep a property in good working condition. Calculation:Assumes 5% of gross rental income. Varies by property age and condition. | 5% | -$285 | -$3,420 |
Capital ExpensesLarge, infrequent costs for major improvements or replacements, like a new roof, HVAC system, or appliances. Calculation:Assumes 5% of gross rental income. Varies by property age. | 5% | -$285 | -$3,420 |
HOA FeesRegular dues paid to a Homeowners Association for community maintenance, amenities, and management. Similar fees include: Condo Association Fees, Co-op Maintenance Fees, etc. | n/a | n/a | n/a |
Operating ExpensesRecurring costs required to maintain and manage a rental property, including property taxes, insurance, maintenance, repairs, utilities (if paid by the owner), property management fees, and other day-to-day expenses. Calculation:Insurance + Property Taxes + Property Management + Repairs & Maintenance + Capital Expenditures + HOA Fees | 32% | -$1,798 | -$21,573 |
Cash Flow
| Monthly | Yearly | |
|---|---|---|
Net Operating Income (NOI)The income generated from a property after deducting all operating expenses but before deducting mortgage payments, taxes, and capital expenditures. Calculation:Gross Operating Income - Operating Expenses
Net operating income:
| $3,560 | $42,720 |
Mortgage PaymentThe fixed amount a borrower pays each month to repay a loan. It typically includes principal and interest (P&I) and may also cover property taxes, insurance, HOA fees, and PMI if escrowed. | -$9,228 | -$110,736 |
Cash FlowNet Operating Income (NOI) minus mortgage payments. Calculation:NOI - Mortgage Payments | $5,668 | $68,016 |