$7,995,000
Investment Summary
- Monthly Cash Flow
- -$39,663
- Cap Rate
- 0.2%
- Cash-on-Cash Return
- -25.9%
- Debt Coverage Ratio
- 0.03
- Internal Rate of Return (5 years)
- -21.0%
Cash Flow
Net Operating Income (NOI) minus mortgage payments.
Calculation:
NOI - Mortgage Payments
Cap Rate (Market Value)
Capitalization Rate is a rate of return that compares the yearly Net Operating Income (NOI) to the market value.
Calculation:
NOI / Market Value
Cash-on-Cash Return (CoC)
Annual Cash Flow / Cash Invested
Calculation:
Annual cash flow divided by initial cash invested.
Debt Coverage Ratio (DCR)
Net Operating Income (NOI) divided by total debt payments.
Calculation:
NOI / Total Debt Payments
Internal Rate of Return (IRR)
A metric for assessing profitability over time. IRR is the discount rate at which the net present value (NPV) of all future cash flows (positive and negative) from an investment equals zero — including both periodic cash flow (such as rent) and a projected sale at the end of the holding period. It represents the expected annualized return, accounting for income, expenses, and the recovery of capital through a future sale.
Property Description
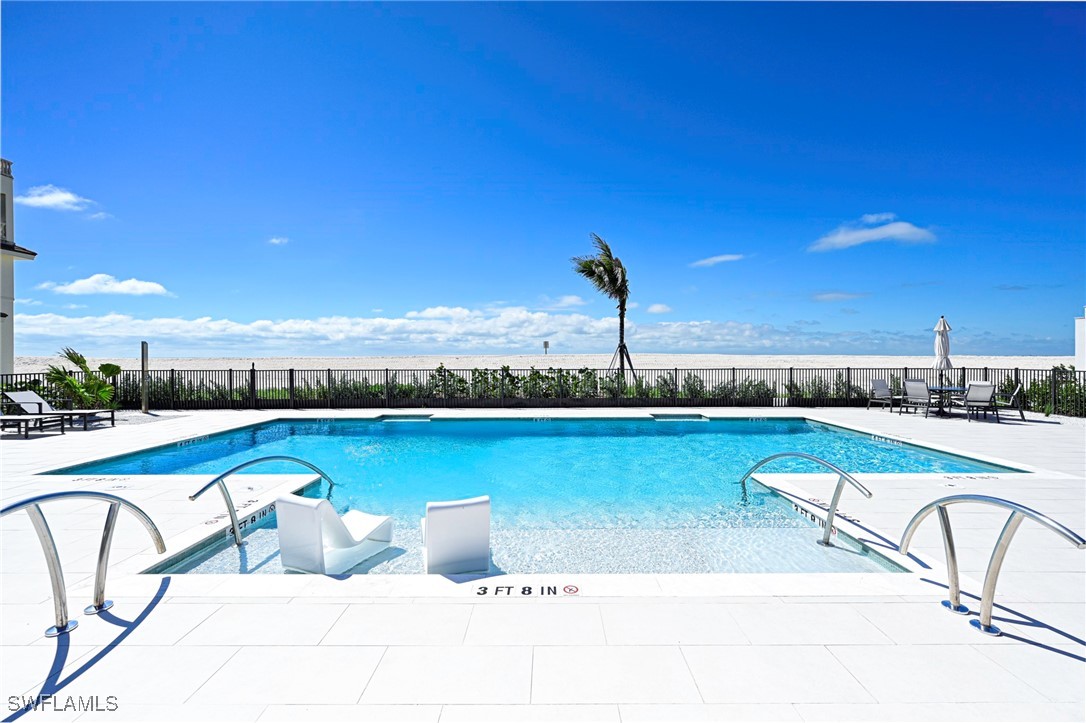
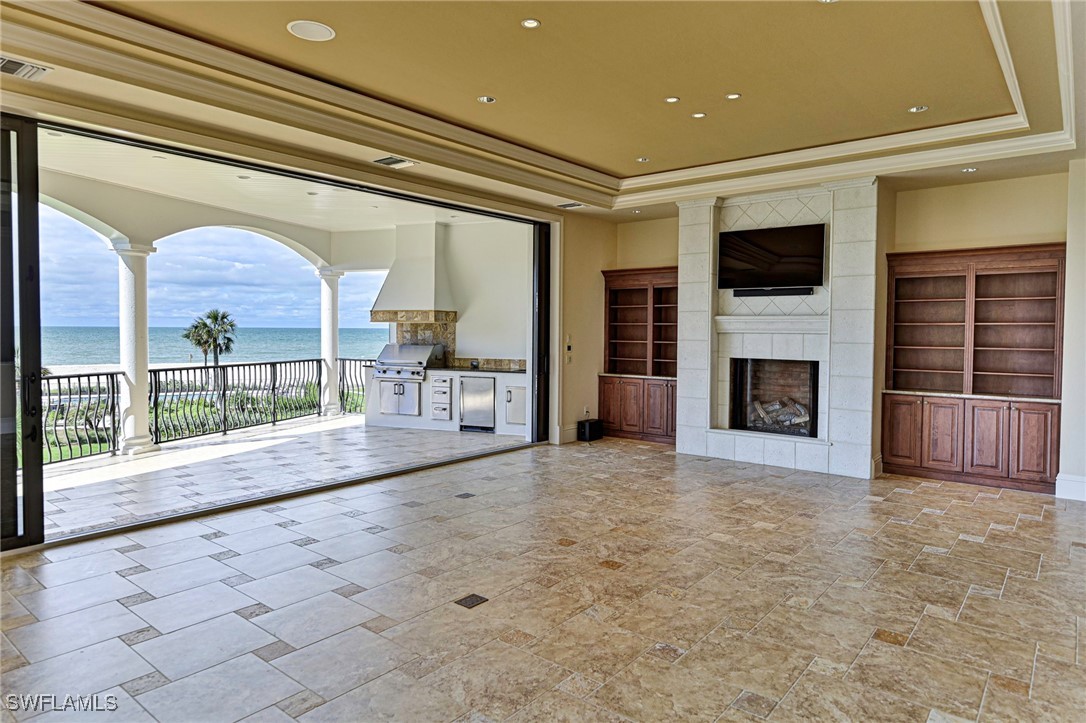
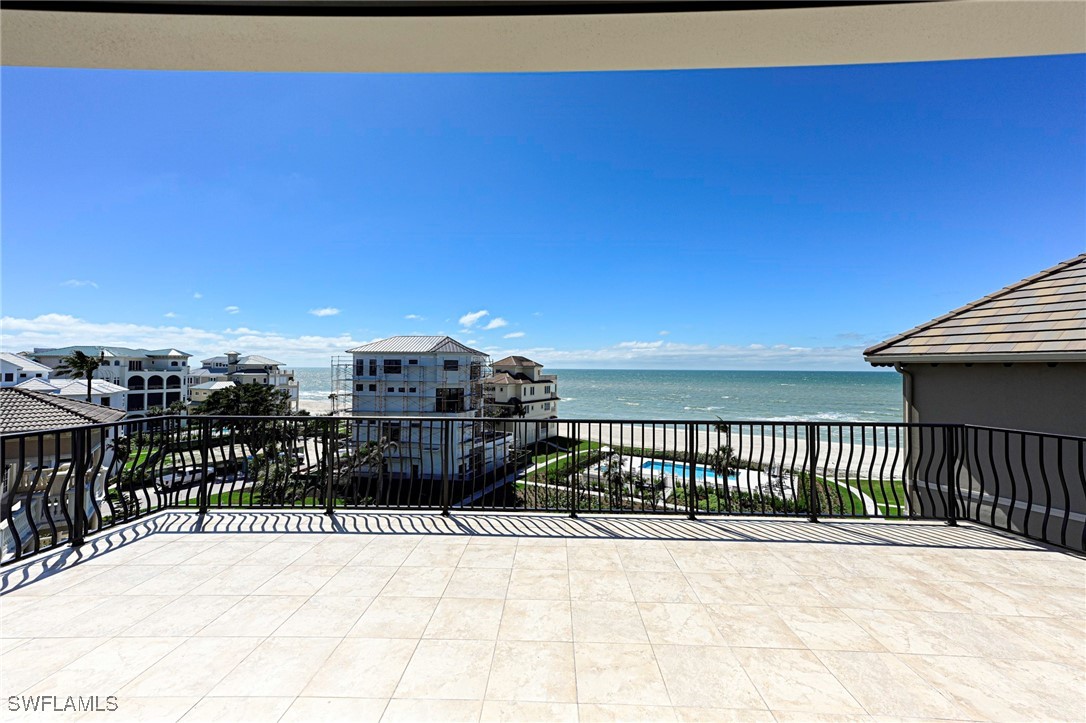
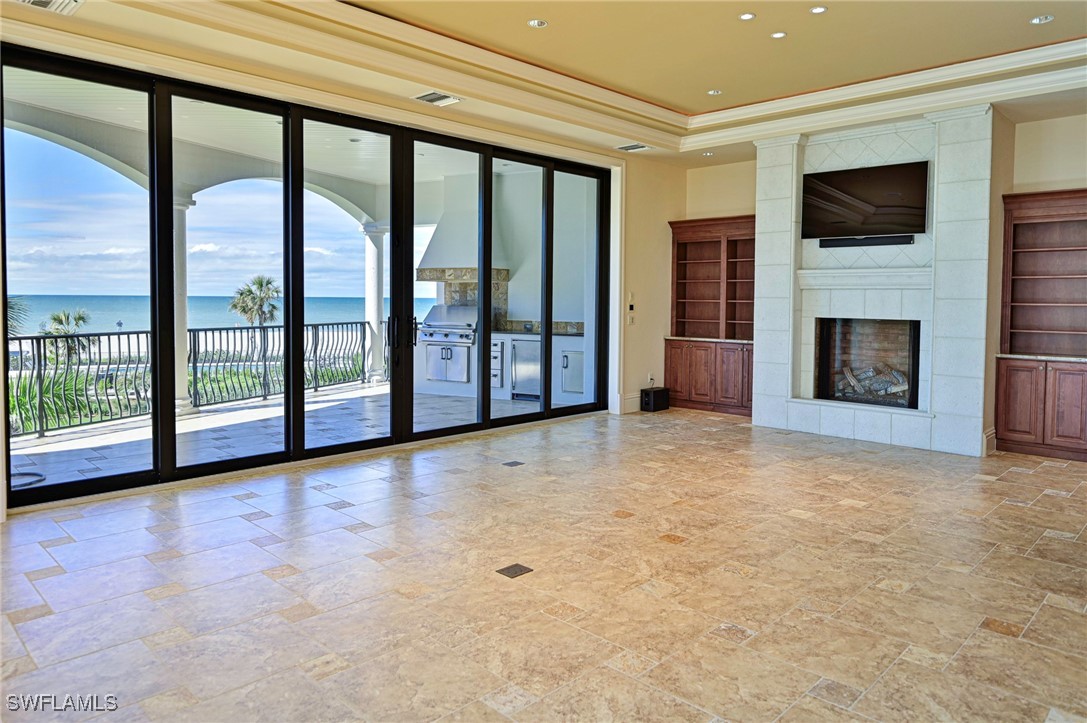
This Barefoot Beach 4 story home offers wide Gulf views from all levels over the beautifully landscaped beach garden and new resort style pool, spa, deck and fire pit. The floor plan boasts approximately 6,183 ac sq ft & 10,274 total sq. ft. Features include 4/5 bedrooms, office, flex room/cloud room with sit at bar, 4 full baths, 2 half baths, 6-car garage, private elevator, extensive millwork, stunning architecture, hurricane windows/doors & concrete construction. The main living level with open floorplan includes a gourmet kitchen with high end appliances including 48” gas range built in steamer & custom cabinetry, dining, and a great room with gas fireplace, built ins and tv above, all that open to a spacious lanai with outdoor kitchen. There is also a formal dining room, large walk behind bar, office, powder bath and a guest bedroom w/private bath. The third living level includes the master bedroom & 2 guest bedrooms w/private baths and a laundry room with 2 sets of washers and dryers. Wake up to the sounds of the Gulf from your oversized master suite with sitting area, large walk-in closet including quality built ins and a shoe closet The master bath offers jetted tub, bidet, walk in shower & his/her vanities and the master morning kitchen includes built in coffee maker, microwave, sink, wine cooler and refrigerator. The fourth floor is perfect for entertaining w/a bonus cloud room, sit at bar with full size refrigerator, microwave, sink and built in beer tap for entertaining guest and parties, home theatre room/ media room & sundeck overlooking the Gulf of America with ever changing sunsets. The exterior of the home was just repainted with new lighting installed, new upgraded garage doors ($60,000) installed, the all concrete garage features stucco walls and epoxy floor for easy maintenance and cleaning, and even the foyer walls are all concrete board with a smooth finish. This immaculate one owner home had very limited use, is in move in ready condition for a quick close as owners have moved to Arizona to be near family. Barefoot Beach homes amenities include gated entrance with 24 hour guard patrols, beach garden pool, private beach, tennis & pickleball courts, fitness & clubhouse. Option to purchase boat dock across the street - separate contract. Also option to join the Club at Barefoot Beach (located within the community) which offers casual and fine dining restaurants, pool & beachside food, drinks and chair service, indoor & outdoor bars, tennis courts with pro & a full events calendar. (waitlist with limited usage during wait period). Barefoot Beach is centrally located to dining, entertainment, golfing, arenas in Naples and Bonita Springs and is close RSW Airport, the Promenade, Coconut Point, Mercato & Waterside Shops and Old Naples. Note: Barefoot Beach is currently being renourished/widened and is slated to be completed in April 2025.
Build Your Team
Quickly find investor-friendly professionals who can help you succeed in real estate investing at any stage of the investing journey.


Agents
Match with investor-friendly agents who can help you find, analyze, and close your next deal


Lenders
Get the best funding…find investor-friendly lenders who specialize in your deal strategy


Property Managers
Transition to passive investing. Find a trusted property management partnership that lasts.


Tax Pros & Accountants
Taxes and financial reporting made easy—find experts to create tax savings strategies, file taxes, and more
Location
Property Details
Parking
- Details: Attached, Driveway, Garage, Paved, Garage Door Opener
- Garage Spaces: 6
- Spaces Total: 0
Bedroom Information
- # of Bedrooms: 5
Bathroom Information
- # of Baths (Full): 4
- # of Baths (Total): 6.0
Interior Features
- # of Stories: 4
- Fireplace: Yes
Exterior Features
- Foundation: Pillar/Post/Pier, Raised
- Roof Material: Tile
HOA
- Has HOA: Yes
- Additional HOA Fee: $2,845/quarterly
Land Information
- Land Use: Residential
- Land Use Subtype: Single Family Residential
Lot Information
- Parcel ID: 54751880004
- Lot Size: 0 sqft
Property Information
- Property Type: Single Family Residence
- Style: Multi Level
- Year Built: 2009
Tax Information
- Annual Tax: $46,822
Utilities
- Water & Sewer: Public
- Heating: Central, Electric, Zoned
- Cooling: Central Air, Ceiling Fan(s), Electric, Humidity Control, Zoned
Location
- County: Collier
Listing Details
Investment Summary
- Monthly Cash Flow
- -$39,663
- Cap Rate
- 0.2%
- Cash-on-Cash Return
- -25.9%
- Debt Coverage Ratio
- 0.03
- Internal Rate of Return (5 years)
- -21.0%
Cash Flow
Net Operating Income (NOI) minus mortgage payments.
Calculation:
NOI - Mortgage Payments
Cap Rate (Market Value)
Capitalization Rate is a rate of return that compares the yearly Net Operating Income (NOI) to the market value.
Calculation:
NOI / Market Value
Cash-on-Cash Return (CoC)
Annual Cash Flow / Cash Invested
Calculation:
Annual cash flow divided by initial cash invested.
Debt Coverage Ratio (DCR)
Net Operating Income (NOI) divided by total debt payments.
Calculation:
NOI / Total Debt Payments
Internal Rate of Return (IRR)
A metric for assessing profitability over time. IRR is the discount rate at which the net present value (NPV) of all future cash flows (positive and negative) from an investment equals zero — including both periodic cash flow (such as rent) and a projected sale at the end of the holding period. It represents the expected annualized return, accounting for income, expenses, and the recovery of capital through a future sale.
Purchase Details
Purchase PriceThe price paid for the property. Purchase price:
| $7,995,000 |
|---|---|
Amount FinancedThe amount of the purchase financed through a loan. Amount financed:
| -$6,396,000 |
Down paymentThe initial payment made towards the purchase. Down payment:
| $1,599,000 |
Closing CostsFees and expenses associated with purchasing a property, typically ranging from 2% to 5% of the home’s purchase price, paid at the end of a home purchase to cover services like lending, title transfer, and taxes. Closing costs:
| $239,850 |
Rehab CostsCosts incurred to repair or improve the property, including: roof, flooring, exterior siding, kitchen, exterior paint, bathrooms, etc. Rehab costs:
| $0 |
Initial Cash InvestedThe total initial cash invested in the property. Calculation:Down payment + Buying costs + Rehab costs Initial cash invested:
| $1,838,850 |
Square Feet (SQFT)The total square footage of the property. Square feet:
| 6,183 |
Cost Per Square FootCost per square foot of the property. Calculation:Purchase Price / Square Feet Cost per square foot:
| $1,293 |
Monthly Rent Per Square FootMonthly rent divided by the number of square feet. This ratio helps investors compare rental income efficiency across properties, markets, and unit sizes Calculation:Monthly Rent / Square Feet Monthly rent per square foot:
| $1.44 |
Financing Details
Loan AmountThe total sum of money borrowed from a lender to finance a property purchase. Calculation:Purchase Price - Down Payment
Loan amount:
| $6,396,000 |
|---|---|
Loan to Value Ratio (LTV)Loan amount divided by the market value of the property. Calculation:Loan Amount / Market Value
Loan to value ratio:
| 80.0% |
Loan TypeThe type of loan (e.g., fixed, adjustable).
Loan type:
| Amortizing |
TermThe loan repayment period in years.
Term:
| 30 years |
Interest RateThe percentage a lender charges on the borrowed amount of a loan, determining the cost of borrowing money.
Interest rate:
| 6.625% |
Principal & Interest (PI)The principal is the portion of the loan payment that reduces the loan balance. The interest is the lender's charge for borrowing money. Calculation:(P * r * (1 + r) ** n) / ((1 + r) ** n - 1) Where:
P = Loan amount (principal)
Principal & interest:
| $40,954 |
Property TaxesAnnual taxes levied by local governments on real estate properties. These taxes fund public services like schools, roads, and emergency services.
Property tax:
| $3,902 |
InsuranceThe costs for insurance coverage to protect against financial losses due to risks like fire, natural disasters, theft, liability, or tenant-related damages. Calculation:Assumes 7% of gross rental income, unless insurance rates are specified.
Insurance:
| $623 |
Private Mortgage Insurance (PMI)A fee that borrowers pay when they take out a conventional loan with a loan-to-value (LTV) ratio above 80%.
Private mortgage insurance (PMI):
| $0 |
Monthly PaymentThe fixed amount a borrower pays each month to repay a loan. It typically includes principal and interest (P&I) and may also cover property taxes, insurance, HOA fees, and PMI if escrowed. Monthly payment:
| $45,479 |
Operating Income
| % Rent | Monthly | Yearly | |
|---|---|---|---|
Gross RentThe total rental income received from tenants before deducting any expenses. Includes base rent, late fees, pet fees, parking fees, and other recurring charges.
Gross rent:
| $8,900 | $106,800 | |
Vacancy LossExpected loss of rent due to vacancies.
Vacancy loss:
(6%)
| 6% | -$534 | -$6,408 |
Operating IncomeGross rental income minus vacancy loss. Calculation:Gross rent - Vacancy loss
Operating income:
| $8,366 | $100,392 |
Operating Expenses
| % Rent | Monthly | Yearly | |
|---|---|---|---|
Property TaxesAnnual taxes levied by local governments on real estate properties. These taxes fund public services like schools, roads, and emergency services. | 44% | -$3,902 | -$46,822 |
InsuranceThe costs for insurance coverage to protect against financial losses due to risks like fire, natural disasters, theft, liability, or tenant-related damages. Calculation:Assumes 7% of gross rental income, unless insurance rates are specified. | 7% | -$623 | -$7,476 |
Property ManagementThe costs associated with hiring a property manager to handle the day-to-day operations of a rental property. Includes management fees, leasing fes, eviction fees, etc. Calculation:Assumes 8% of gross rental income. | 8% | -$712 | -$8,544 |
Repairs & MaintenanceOngoing costs for routine upkeep and minor fixes needed to keep a property in good working condition. Calculation:Assumes 5% of gross rental income. Varies by property age and condition. | 5% | -$445 | -$5,340 |
Capital ExpensesLarge, infrequent costs for major improvements or replacements, like a new roof, HVAC system, or appliances. Calculation:Assumes 5% of gross rental income. Varies by property age. | 5% | -$445 | -$5,340 |
HOA FeesRegular dues paid to a Homeowners Association for community maintenance, amenities, and management. Similar fees include: Condo Association Fees, Co-op Maintenance Fees, etc. | 11% | -$948 | -$11,376 |
Operating ExpensesRecurring costs required to maintain and manage a rental property, including property taxes, insurance, maintenance, repairs, utilities (if paid by the owner), property management fees, and other day-to-day expenses. Calculation:Insurance + Property Taxes + Property Management + Repairs & Maintenance + Capital Expenditures + HOA Fees | 79% | -$7,075 | -$84,898 |
Cash Flow
| Monthly | Yearly | |
|---|---|---|
Net Operating Income (NOI)The income generated from a property after deducting all operating expenses but before deducting mortgage payments, taxes, and capital expenditures. Calculation:Gross Operating Income - Operating Expenses
Net operating income:
| $1,291 | $15,492 |
Mortgage PaymentThe fixed amount a borrower pays each month to repay a loan. It typically includes principal and interest (P&I) and may also cover property taxes, insurance, HOA fees, and PMI if escrowed. | -$40,954 | -$491,448 |
Cash FlowNet Operating Income (NOI) minus mortgage payments. Calculation:NOI - Mortgage Payments | $39,663 | $475,956 |