

$424,000
Investment Summary
- Monthly Cash Flow
- -$1,265
- Cap Rate
- 2.6%
- Cash-on-Cash Return
- -15.6%
- Debt Coverage Ratio
- 0.42
- Internal Rate of Return (5 years)
- -11.1%
Cash Flow
Net Operating Income (NOI) minus mortgage payments.
Calculation:
NOI - Mortgage Payments
Cap Rate (Market Value)
Capitalization Rate is a rate of return that compares the yearly Net Operating Income (NOI) to the market value.
Calculation:
NOI / Market Value
Cash-on-Cash Return (CoC)
Annual Cash Flow / Cash Invested
Calculation:
Annual cash flow divided by initial cash invested.
Debt Coverage Ratio (DCR)
Net Operating Income (NOI) divided by total debt payments.
Calculation:
NOI / Total Debt Payments
Internal Rate of Return (IRR)
A metric for assessing profitability over time. IRR is the discount rate at which the net present value (NPV) of all future cash flows (positive and negative) from an investment equals zero — including both periodic cash flow (such as rent) and a projected sale at the end of the holding period. It represents the expected annualized return, accounting for income, expenses, and the recovery of capital through a future sale.
Property Description
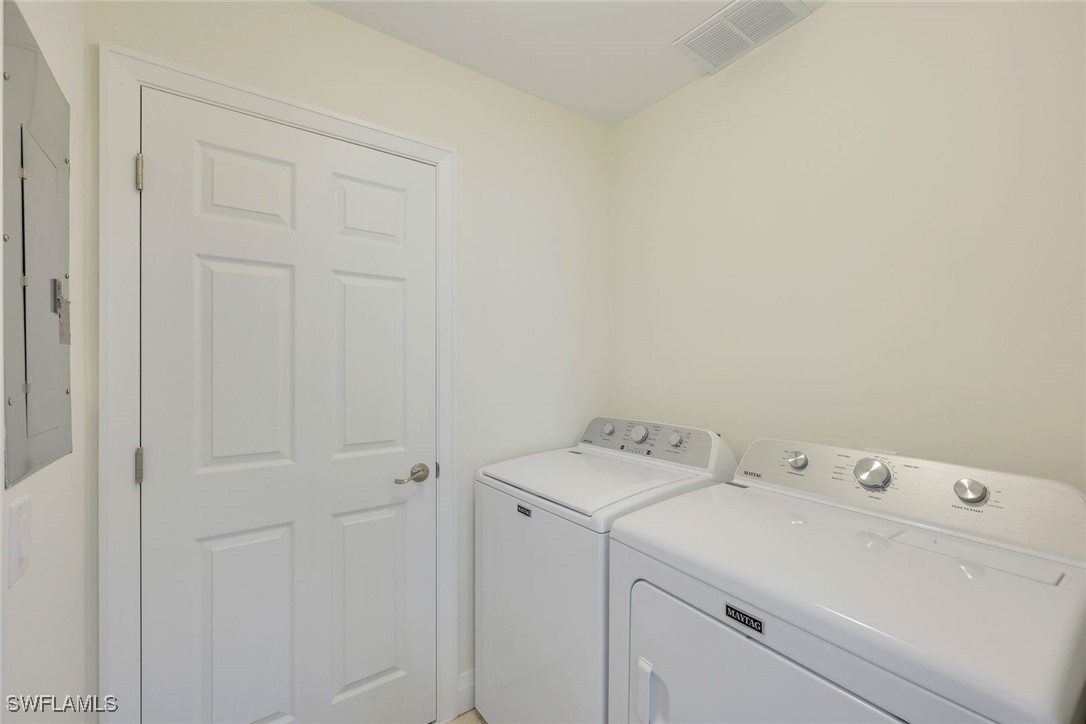
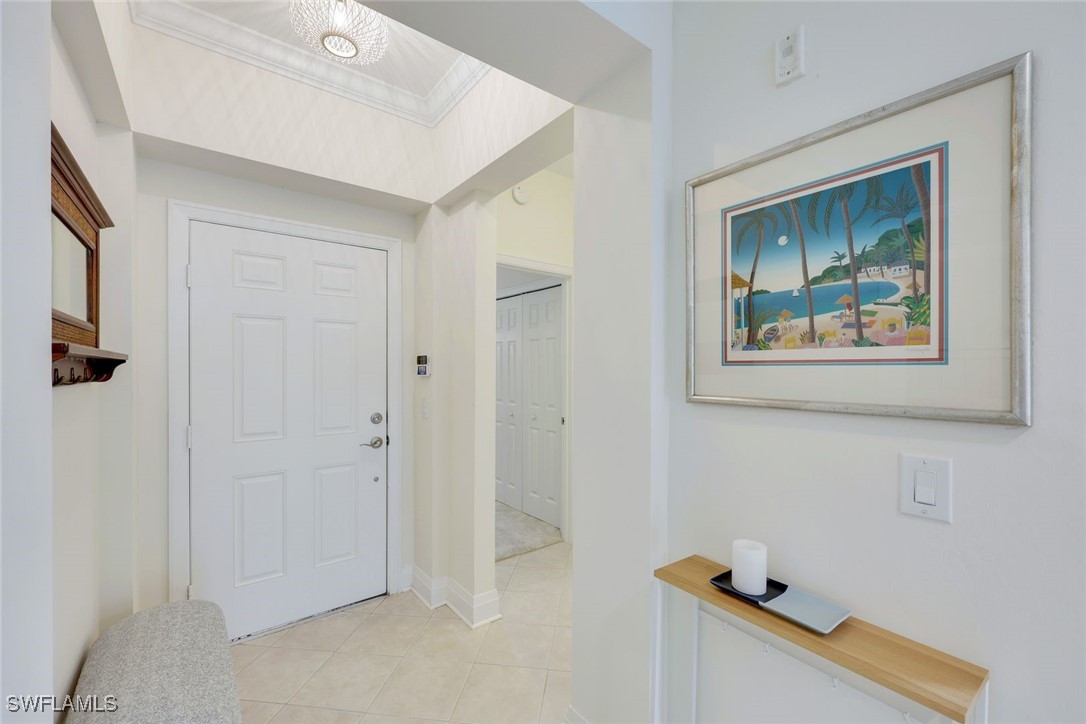
Buy this sunny and spacious 3 bedroom end unit home for less than a significantly smaller 2 bedroom unit! Motivated sellers are offering an incredible value, especially for a home in the amenity rich, highly sought after Pelican Sound Golf and River Club! Another thing for our midwestern folks to consider and that you are intimately familiar with - is this question - Can you prepare for a tornado? Not really but you CAN prepare for a tropical storm. Owner has installed a state of the art flood barrier system that is easy to install and remove, and will give you the peace of mind you are looking for to purchase. Tiny bit of water intrusion in the last 300 years and you will now have protection from water here. Friends will be envious of the deal you are getting on this beautiful move in ready home, close to the best pool in Pelican Sound, close to the new racquet center, the River Club, and the water taxi out to the Gulf! Located on the sunny south end of the building; your picture window screened lanai gives you the feeling you are completely outside! Wonderful sunsets from your west facing lanai with just enough tropical vegetation to give you a little screen! You will appreciate the perfect privacy with no one near on the side or back of you, yet this home is situated within walking distance to the best pool and spa in Pelican Sound! Short stroll to the state-of-the-art racquet center, the attended fitness center, and the ever-popular, casual River Club on the Estero River. This home was completely renovated in 2023 and features all new, stylishly upgraded kitchen and bathrooms. Convenient additions in the kitchen are 42” cabinets finished with crown molding and soft-close doors; not one but 2 great Lazy Susan cabinets to fully utilize the corner spaces; nicely hidden in-cabinet trash; 3 overhead can lights make cooking much easier for the eyes! Top of the line Silestone Quartz countertops complete the space with its gorgeous yet durable designer touch. The bathrooms are beautifully finished - light and bright, with the latest in trough style sinks and a frameless walk-in shower in the master! New AC system installed late 2022. The 2023 high quality Maytag washer and dryer will treat your Florida cottons gently. This home is done in lovely neutral colors so you can add your own touches of color. Offered turnkey furnished with very few art exclusions. Situated west of US 41 in exciting Estero, Pelican Sound is widely considered to be the very best bundled golf community in the entire region. Start with 27 holes of championship golf PLUS direct access to the Gulf of Mexico from the community boat ramp. Launch your own boat that you have stored in the secure storage area or take the community water taxi to the beach at Lovers Key; add har-tru tennis courts, 12 pickleball courts- all with attendant teaching pros; 2 newer, award-winning clubhouses with a total of 4 wonderful dining venues! You will love everything about living in Pelican Sound!
Build Your Team
Quickly find investor-friendly professionals who can help you succeed in real estate investing at any stage of the investing journey.


Agents
Match with investor-friendly agents who can help you find, analyze, and close your next deal


Lenders
Get the best funding…find investor-friendly lenders who specialize in your deal strategy


Property Managers
Transition to passive investing. Find a trusted property management partnership that lasts.


Tax Pros & Accountants
Taxes and financial reporting made easy—find experts to create tax savings strategies, file taxes, and more
Location
Property Details
Parking
- Description: Assigned, Guest, Paved, OneSpace, DetachedCarport
- Details: Assigned, Guest, Paved, Detached Carport
- Garage Spaces: 0
- Spaces Total: 0
Bedroom Information
- # of Bedrooms: 3
Bathroom Information
- # of Baths (Full): 2
- # of Baths (Total): 2.0
Interior Features
- # of Stories: 1
Exterior Features
- Roof Material: Tile
- Pool Community: Yes
HOA
- Has HOA: Yes
- HOA Fee: $10,745/annually
Land Information
- Land Use: Residential
- Land Use Subtype: Condominium Unit
Lot Information
- Parcel ID: 324625E130020.0101
- Lot Size: 0 sqft
Property Information
- Property Type: Condominium
- Style: Garden Home, Mid Rise
- Year Built: 2002
Tax Information
- Annual Tax: $4,872
Utilities
- Water & Sewer: Public
- Heating: Central, Electric
- Cooling: Central Air, Ceiling Fan(s), Electric, Humidity Control
Location
- County: Lee
Listing Details
Investment Summary
- Monthly Cash Flow
- -$1,265
- Cap Rate
- 2.6%
- Cash-on-Cash Return
- -15.6%
- Debt Coverage Ratio
- 0.42
- Internal Rate of Return (5 years)
- -11.1%
Cash Flow
Net Operating Income (NOI) minus mortgage payments.
Calculation:
NOI - Mortgage Payments
Cap Rate (Market Value)
Capitalization Rate is a rate of return that compares the yearly Net Operating Income (NOI) to the market value.
Calculation:
NOI / Market Value
Cash-on-Cash Return (CoC)
Annual Cash Flow / Cash Invested
Calculation:
Annual cash flow divided by initial cash invested.
Debt Coverage Ratio (DCR)
Net Operating Income (NOI) divided by total debt payments.
Calculation:
NOI / Total Debt Payments
Internal Rate of Return (IRR)
A metric for assessing profitability over time. IRR is the discount rate at which the net present value (NPV) of all future cash flows (positive and negative) from an investment equals zero — including both periodic cash flow (such as rent) and a projected sale at the end of the holding period. It represents the expected annualized return, accounting for income, expenses, and the recovery of capital through a future sale.
Purchase Details
Purchase PriceThe price paid for the property. Purchase price:
| $424,000 |
|---|---|
Amount FinancedThe amount of the purchase financed through a loan. Amount financed:
| -$339,200 |
Down paymentThe initial payment made towards the purchase. Down payment:
| $84,800 |
Closing CostsFees and expenses associated with purchasing a property, typically ranging from 2% to 5% of the home’s purchase price, paid at the end of a home purchase to cover services like lending, title transfer, and taxes. Closing costs:
| $12,720 |
Rehab CostsCosts incurred to repair or improve the property, including: roof, flooring, exterior siding, kitchen, exterior paint, bathrooms, etc. Rehab costs:
| $0 |
Initial Cash InvestedThe total initial cash invested in the property. Calculation:Down payment + Buying costs + Rehab costs Initial cash invested:
| $97,520 |
Square Feet (SQFT)The total square footage of the property. Square feet:
| 1,450 |
Cost Per Square FootCost per square foot of the property. Calculation:Purchase Price / Square Feet Cost per square foot:
| $292 |
Monthly Rent Per Square FootMonthly rent divided by the number of square feet. This ratio helps investors compare rental income efficiency across properties, markets, and unit sizes Calculation:Monthly Rent / Square Feet Monthly rent per square foot:
| $2.21 |
Financing Details
Loan AmountThe total sum of money borrowed from a lender to finance a property purchase. Calculation:Purchase Price - Down Payment
Loan amount:
| $339,200 |
|---|---|
Loan to Value Ratio (LTV)Loan amount divided by the market value of the property. Calculation:Loan Amount / Market Value
Loan to value ratio:
| 80.0% |
Loan TypeThe type of loan (e.g., fixed, adjustable).
Loan type:
| Amortizing |
TermThe loan repayment period in years.
Term:
| 30 years |
Interest RateThe percentage a lender charges on the borrowed amount of a loan, determining the cost of borrowing money.
Interest rate:
| 6.625% |
Principal & Interest (PI)The principal is the portion of the loan payment that reduces the loan balance. The interest is the lender's charge for borrowing money. Calculation:(P * r * (1 + r) ** n) / ((1 + r) ** n - 1) Where:
P = Loan amount (principal)
Principal & interest:
| $2,172 |
Property TaxesAnnual taxes levied by local governments on real estate properties. These taxes fund public services like schools, roads, and emergency services.
Property tax:
| $406 |
InsuranceThe costs for insurance coverage to protect against financial losses due to risks like fire, natural disasters, theft, liability, or tenant-related damages. Calculation:Assumes 7% of gross rental income, unless insurance rates are specified.
Insurance:
| $224 |
Private Mortgage Insurance (PMI)A fee that borrowers pay when they take out a conventional loan with a loan-to-value (LTV) ratio above 80%.
Private mortgage insurance (PMI):
| $0 |
Monthly PaymentThe fixed amount a borrower pays each month to repay a loan. It typically includes principal and interest (P&I) and may also cover property taxes, insurance, HOA fees, and PMI if escrowed. Monthly payment:
| $2,802 |
Operating Income
| % Rent | Monthly | Yearly | |
|---|---|---|---|
Gross RentThe total rental income received from tenants before deducting any expenses. Includes base rent, late fees, pet fees, parking fees, and other recurring charges.
Gross rent:
| $3,200 | $38,400 | |
Vacancy LossExpected loss of rent due to vacancies.
Vacancy loss:
(6%)
| 6% | -$192 | -$2,304 |
Operating IncomeGross rental income minus vacancy loss. Calculation:Gross rent - Vacancy loss
Operating income:
| $3,008 | $36,096 |
Operating Expenses
| % Rent | Monthly | Yearly | |
|---|---|---|---|
Property TaxesAnnual taxes levied by local governments on real estate properties. These taxes fund public services like schools, roads, and emergency services. | 13% | -$406 | -$4,873 |
InsuranceThe costs for insurance coverage to protect against financial losses due to risks like fire, natural disasters, theft, liability, or tenant-related damages. Calculation:Assumes 7% of gross rental income, unless insurance rates are specified. | 7% | -$224 | -$2,688 |
Property ManagementThe costs associated with hiring a property manager to handle the day-to-day operations of a rental property. Includes management fees, leasing fes, eviction fees, etc. Calculation:Assumes 8% of gross rental income. | 8% | -$256 | -$3,072 |
Repairs & MaintenanceOngoing costs for routine upkeep and minor fixes needed to keep a property in good working condition. Calculation:Assumes 5% of gross rental income. Varies by property age and condition. | 5% | -$160 | -$1,920 |
Capital ExpensesLarge, infrequent costs for major improvements or replacements, like a new roof, HVAC system, or appliances. Calculation:Assumes 5% of gross rental income. Varies by property age. | 5% | -$160 | -$1,920 |
HOA FeesRegular dues paid to a Homeowners Association for community maintenance, amenities, and management. Similar fees include: Condo Association Fees, Co-op Maintenance Fees, etc. | 28% | -$895 | -$10,740 |
Operating ExpensesRecurring costs required to maintain and manage a rental property, including property taxes, insurance, maintenance, repairs, utilities (if paid by the owner), property management fees, and other day-to-day expenses. Calculation:Insurance + Property Taxes + Property Management + Repairs & Maintenance + Capital Expenditures + HOA Fees | 66% | -$2,101 | -$25,213 |
Cash Flow
| Monthly | Yearly | |
|---|---|---|
Net Operating Income (NOI)The income generated from a property after deducting all operating expenses but before deducting mortgage payments, taxes, and capital expenditures. Calculation:Gross Operating Income - Operating Expenses
Net operating income:
| $907 | $10,884 |
Mortgage PaymentThe fixed amount a borrower pays each month to repay a loan. It typically includes principal and interest (P&I) and may also cover property taxes, insurance, HOA fees, and PMI if escrowed. | -$2,172 | -$26,064 |
Cash FlowNet Operating Income (NOI) minus mortgage payments. Calculation:NOI - Mortgage Payments | $1,265 | $15,180 |