$865,000
Investment Summary
- Monthly Cash Flow
- -$1,272
- Cap Rate
- 4.3%
- Cash-on-Cash Return
- -7.7%
- Debt Coverage Ratio
- 0.71
- Internal Rate of Return (5 years)
- -3.4%
Cash Flow
Net Operating Income (NOI) minus mortgage payments.
Calculation:
NOI - Mortgage Payments
Cap Rate (Market Value)
Capitalization Rate is a rate of return that compares the yearly Net Operating Income (NOI) to the market value.
Calculation:
NOI / Market Value
Cash-on-Cash Return (CoC)
Annual Cash Flow / Cash Invested
Calculation:
Annual cash flow divided by initial cash invested.
Debt Coverage Ratio (DCR)
Net Operating Income (NOI) divided by total debt payments.
Calculation:
NOI / Total Debt Payments
Internal Rate of Return (IRR)
A metric for assessing profitability over time. IRR is the discount rate at which the net present value (NPV) of all future cash flows (positive and negative) from an investment equals zero — including both periodic cash flow (such as rent) and a projected sale at the end of the holding period. It represents the expected annualized return, accounting for income, expenses, and the recovery of capital through a future sale.
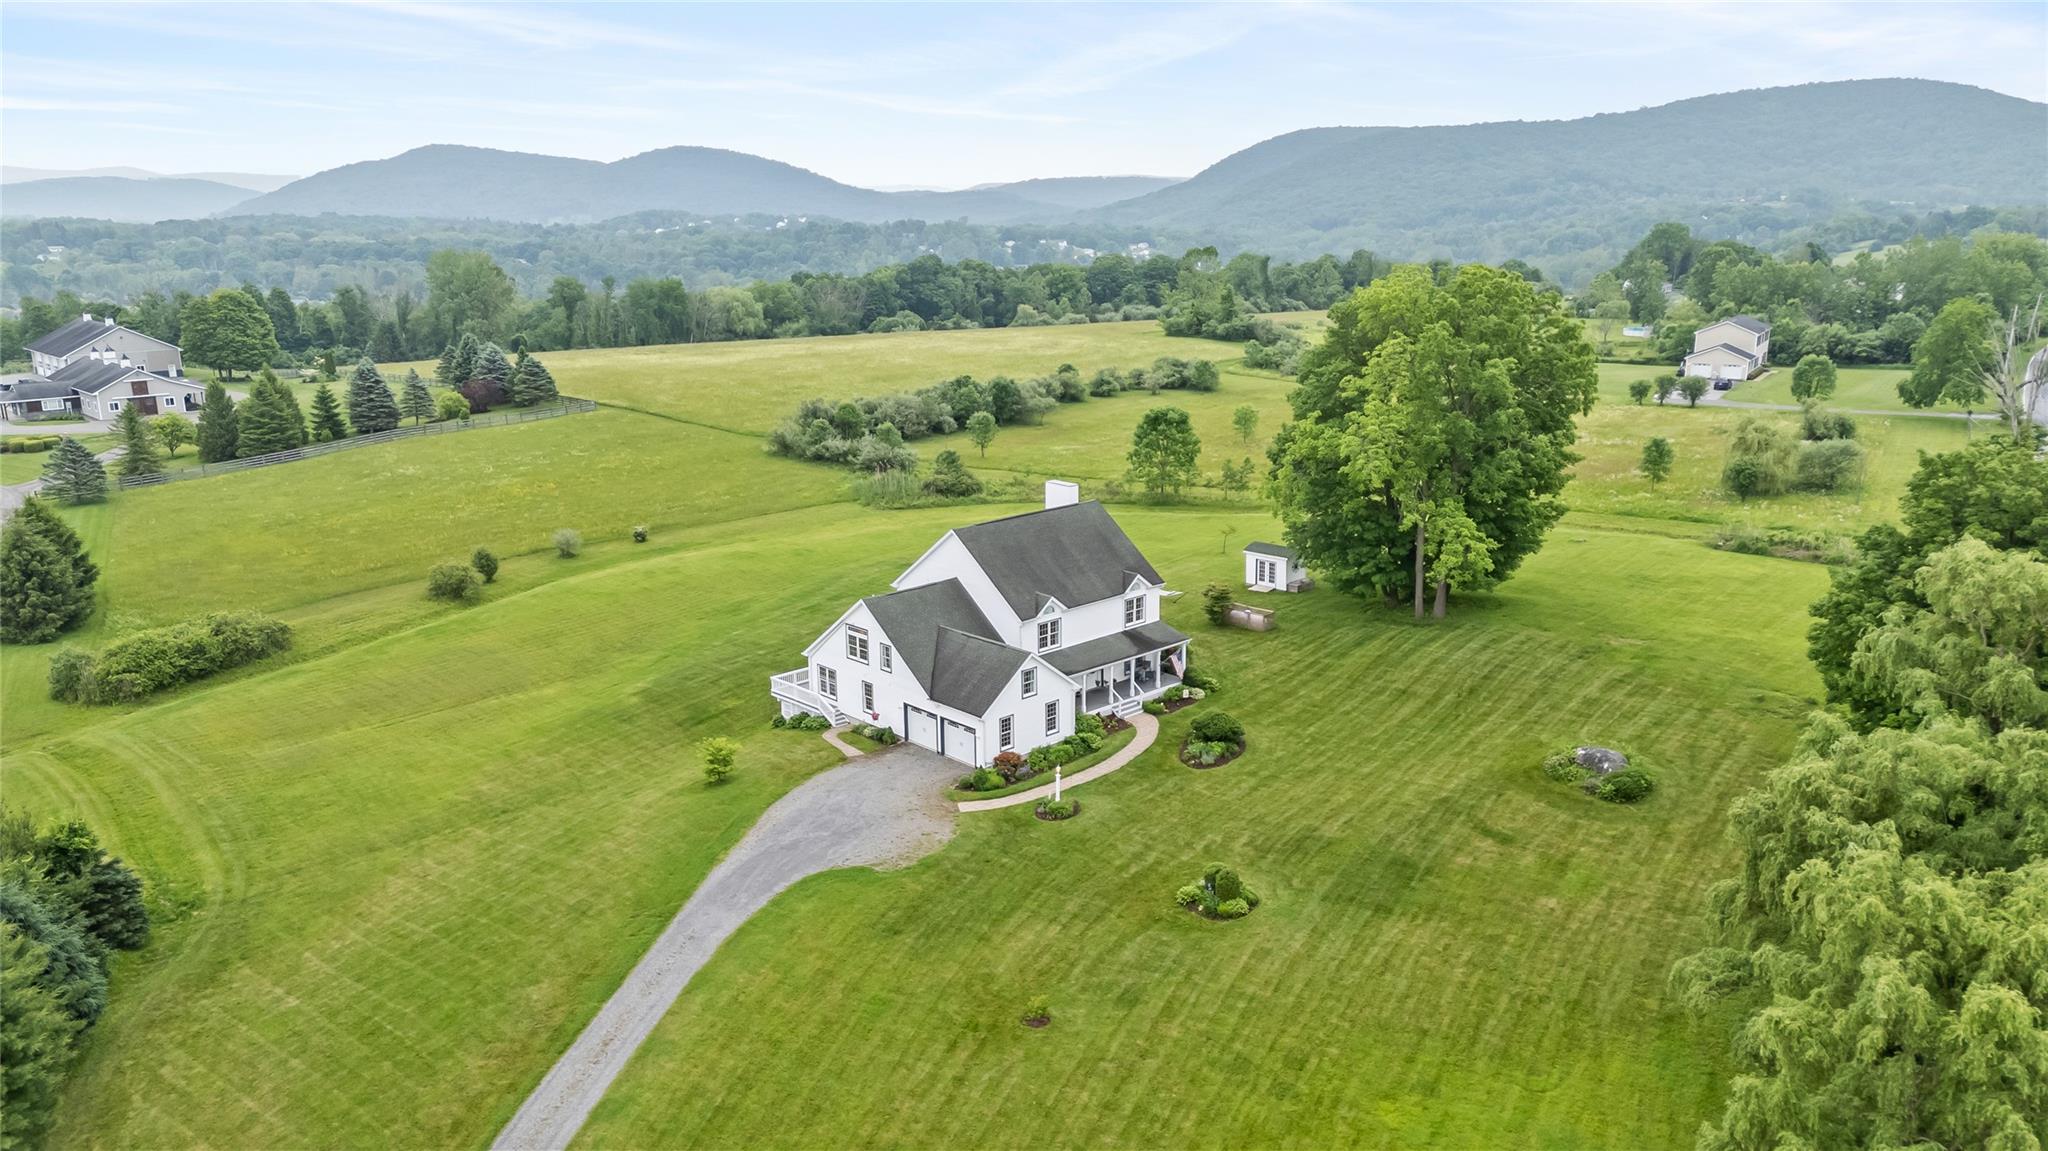
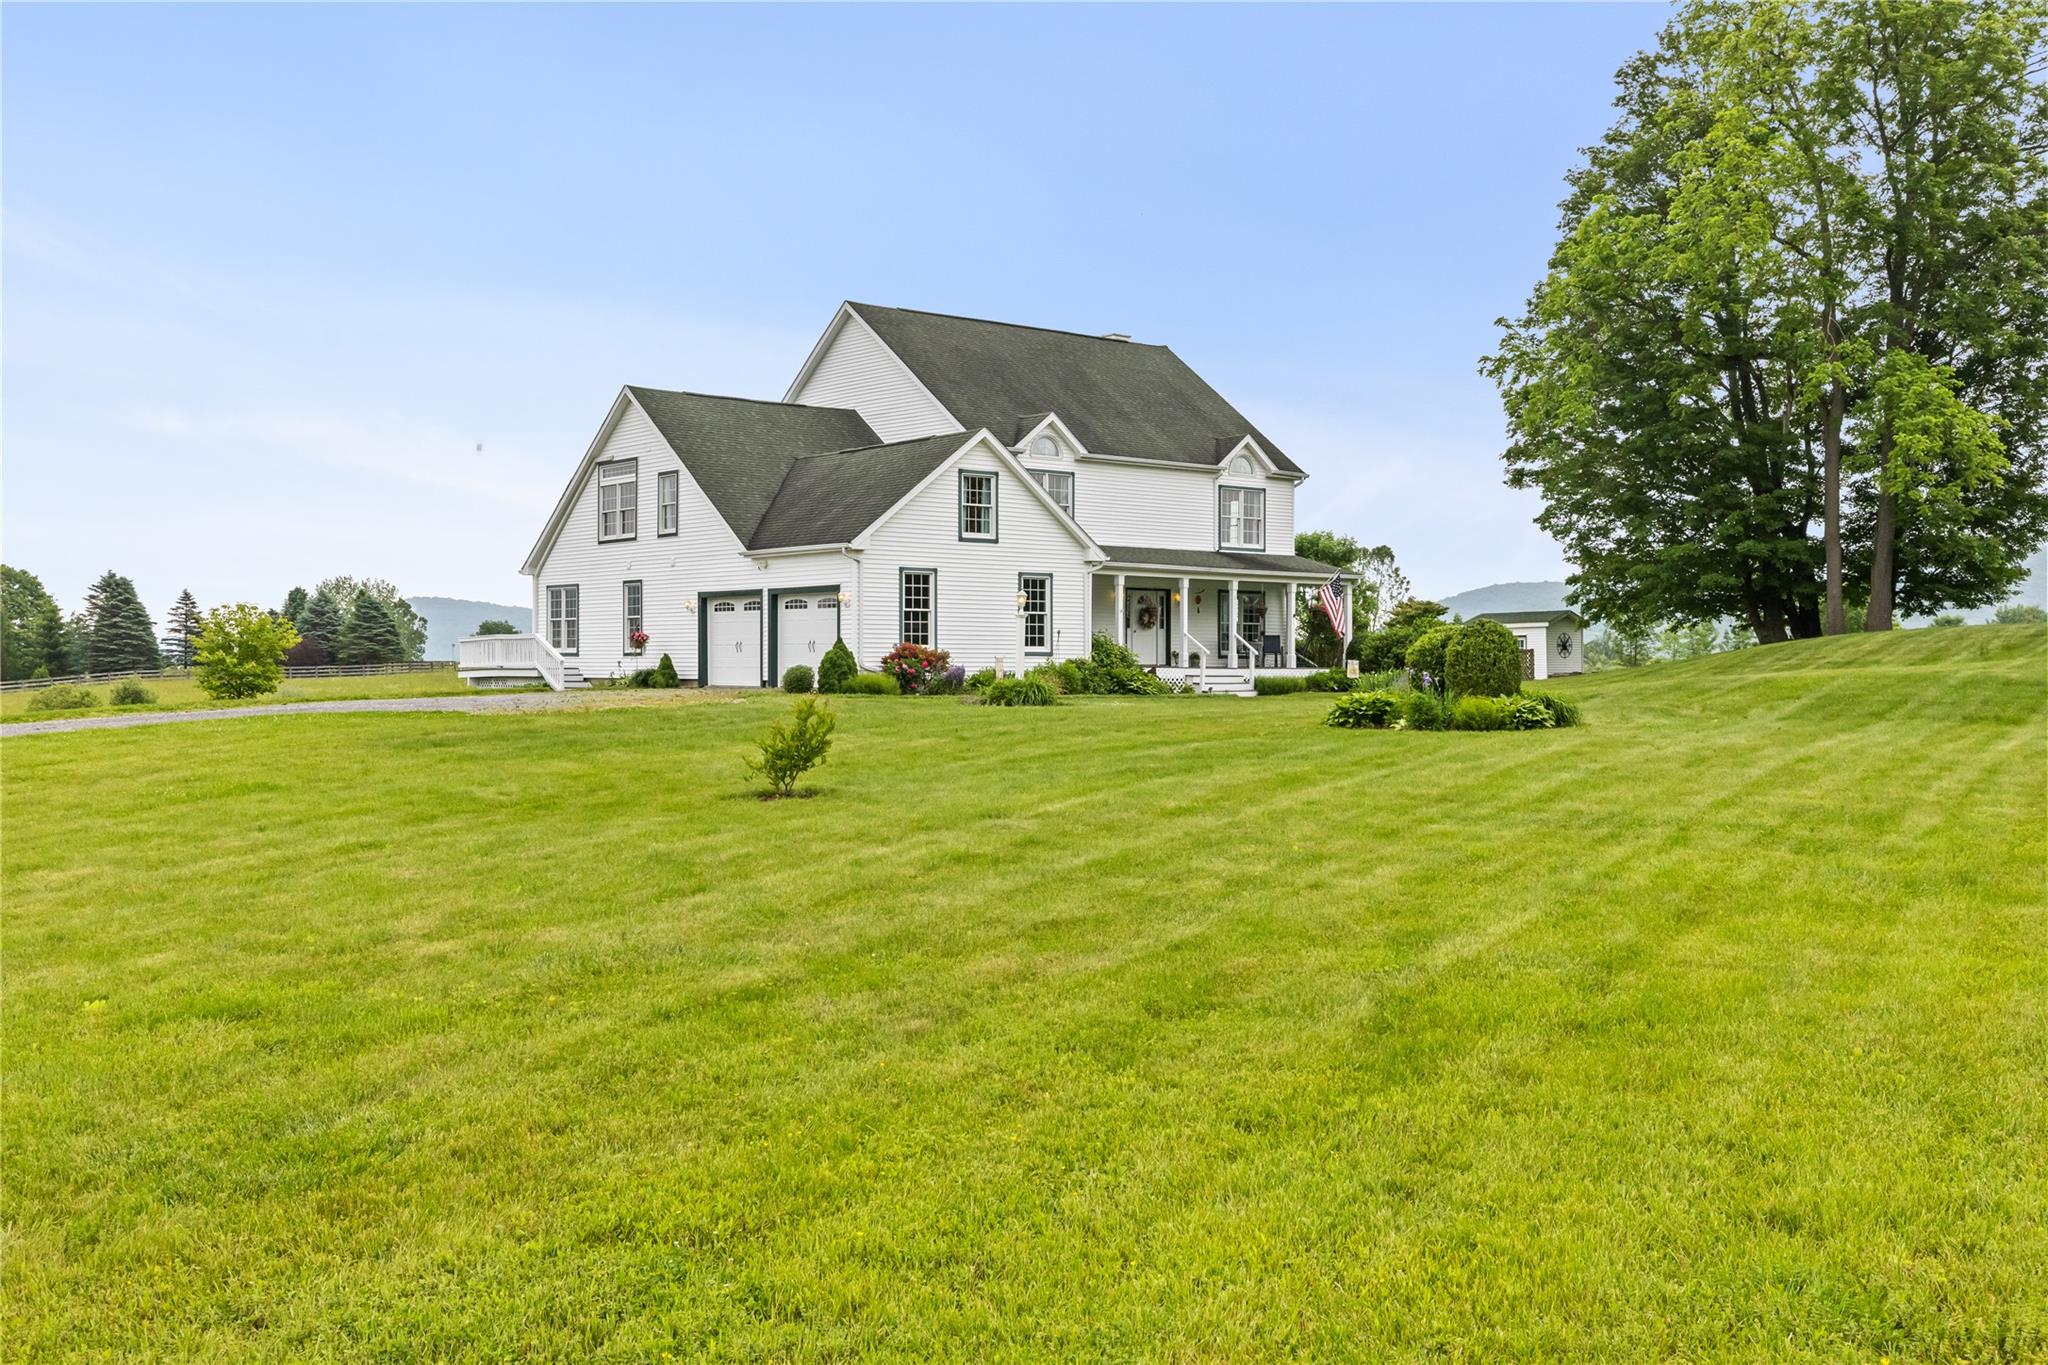
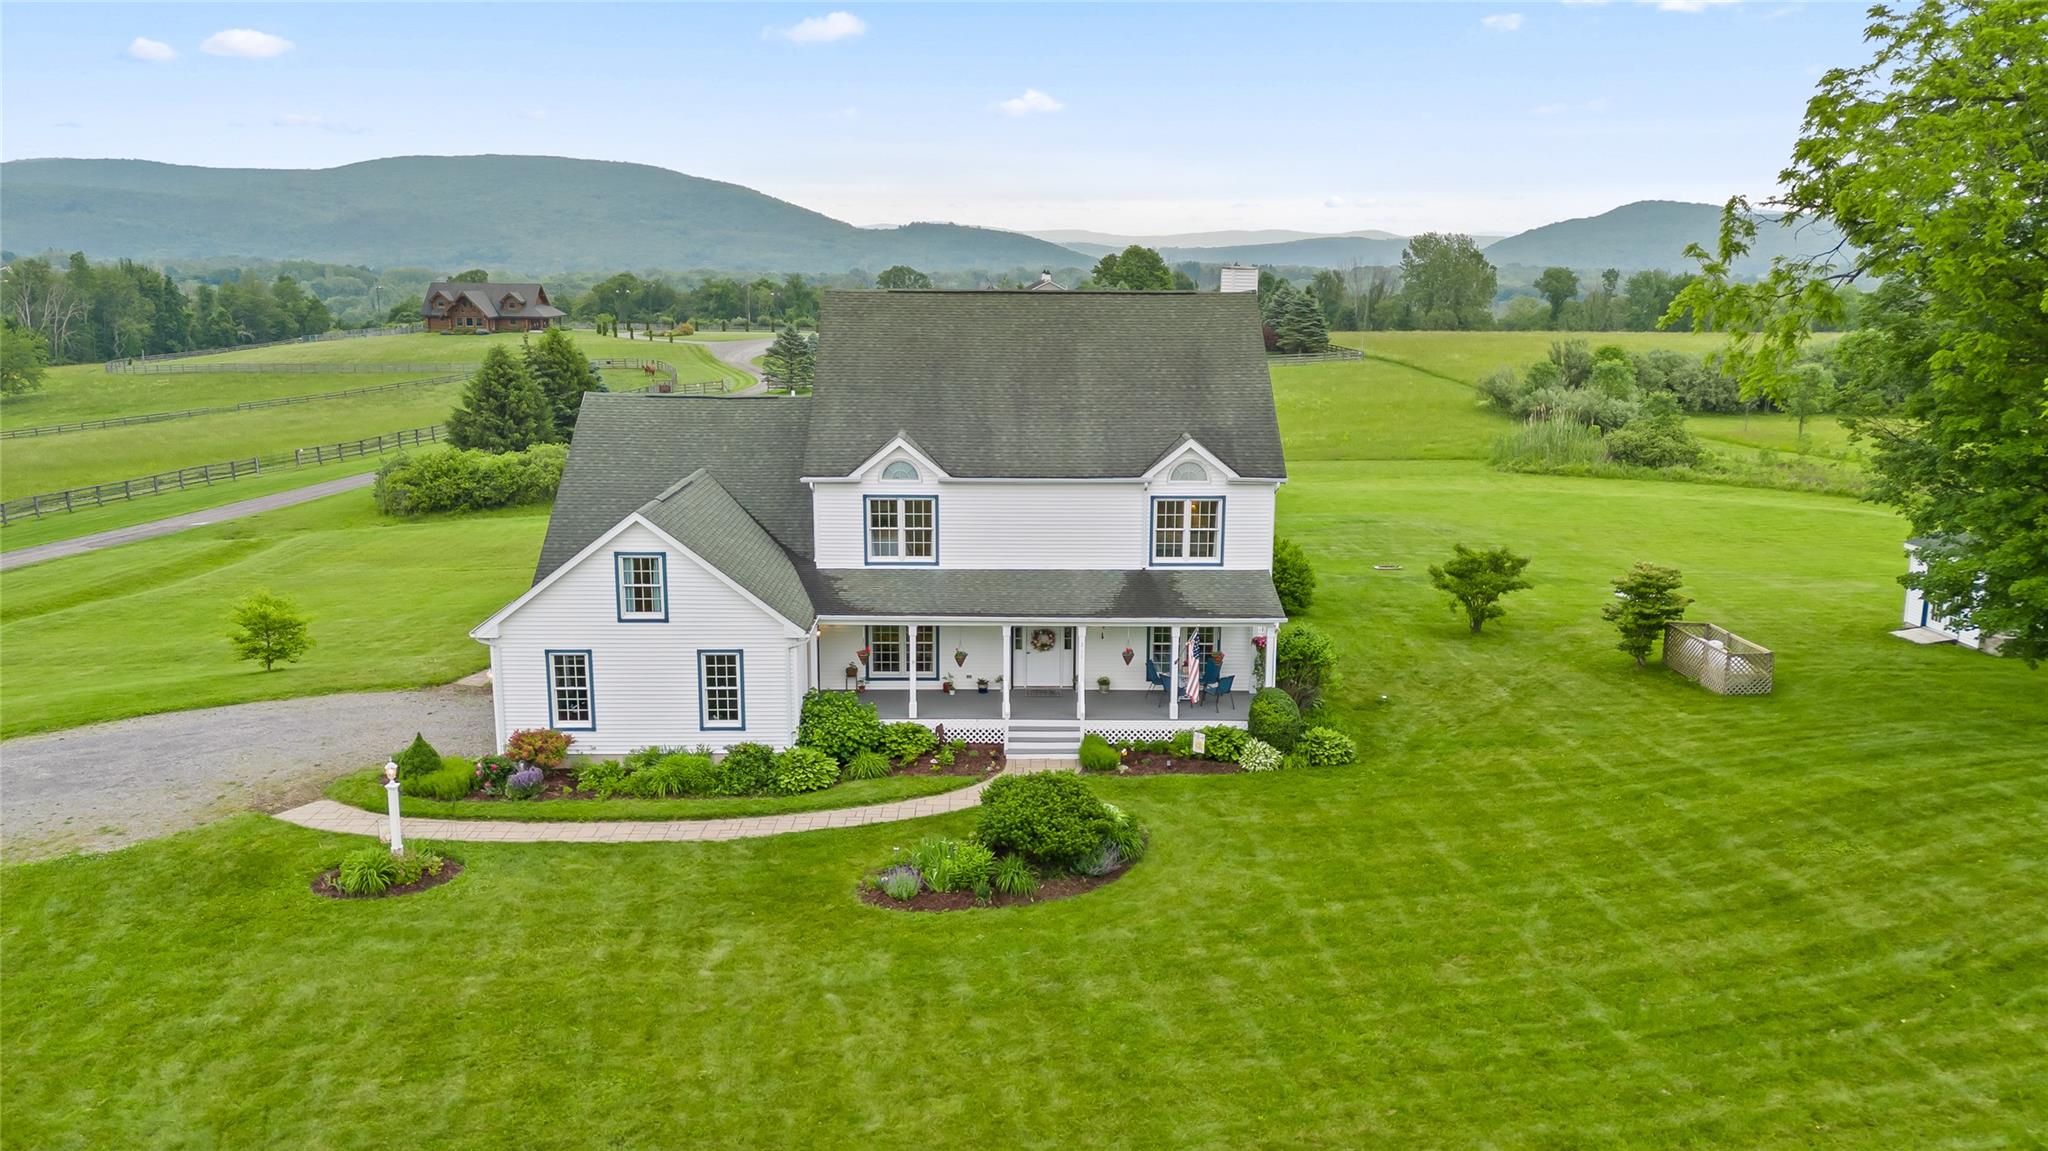
Property Description
This is the one—an exceptional and truly special property offering the perfect blend of refined living, natural beauty, and flexibility. Set against a breathtaking countryside backdrop, this Colonial Farmhouse-style home is nestled on just over 5 private, picturesque acres—perfectly suited for horses, weekend escapes, or year-round living. With nearly 4,800 square feet of thoughtfully crafted living space, this home is designed for both luxurious everyday living and effortless entertaining. Step onto the charming rocking chair front porch and into a home filled with warmth and character. Inside, you’ll find gleaming hardwood floors, central air conditioning, and an easy, flowing layout. A formal living room and a spacious great room—each with their own inviting ambiance—are divided by a stylish butler’s pantry featuring granite countertops, ample cabinetry, and pocket doors for optional separation. The formal dining room offers an elegant space for hosting, while the oversized eat-in kitchen is the heart of the home, complete with granite counters, rich hardwood cabinetry, a gas range, large walk-in pantry, and sliding glass doors that lead to a generous deck and bubbling hot tub—all overlooking stunning pastoral views. One of the home's standout features is the private, dedicated in-law suite, with its own full kitchen, separate entrance, and spacious layout—ideal for multi-generational living, guests, or even a home office retreat. Upstairs, a striking wrap-around indoor balcony offers panoramic views and leads to three exceptionally large bedrooms, each with an ensuite bathroom, as well as a quiet, sunlit office space. The primary suite is a peaceful haven—featuring a luxurious bathroom with elegant quartz accents, a freestanding soaking tub, a beautifully porcelain-tiled walk-in shower with a frameless glass enclosure and rainfall-style shower head, and two-zone heated floors for ultimate comfort. Beyond the bath lies a boutique-style walk-in closet, an entire room devoted to organization, storage, and style. The finished lower level offers over 700 square feet of additional living space, including a cozy sitting area with an electric fireplace, a refrigerator for added convenience, a separate flex room currently used as a fitness area, a powder room and an abundance of storage options. Surrounded by serene vistas, complete privacy, and natural beauty, this home is a true custom retreat. Whether you're seeking peace and solitude, the perfect place for entertaining, or proximity to outdoor adventure, you’ll find it all here. Convenient to the Metro-North Harlem Valley-Wingdale station and close to local treasures including Appalachian Trailheads, area wineries, organic farms, antique shops, hiking, entertainment, and more. This isn’t just a home—it’s an experience. Come discover your personal escape in the heart of the Hudson Valley.
Build Your Team
Quickly find investor-friendly professionals who can help you succeed in real estate investing at any stage of the investing journey.


Agents
Match with investor-friendly agents who can help you find, analyze, and close your next deal


Lenders
Get the best funding…find investor-friendly lenders who specialize in your deal strategy


Property Managers
Transition to passive investing. Find a trusted property management partnership that lasts.


Tax Pros & Accountants
Taxes and financial reporting made easy—find experts to create tax savings strategies, file taxes, and more
Location
Property Details
Parking
- Description: Attached Garage
- Details: Attached, Driveway, Garage, Garage Door Opener
- Garage Spaces: 2
- Spaces Total: 0
Bedroom Information
- # of Bedrooms: 4
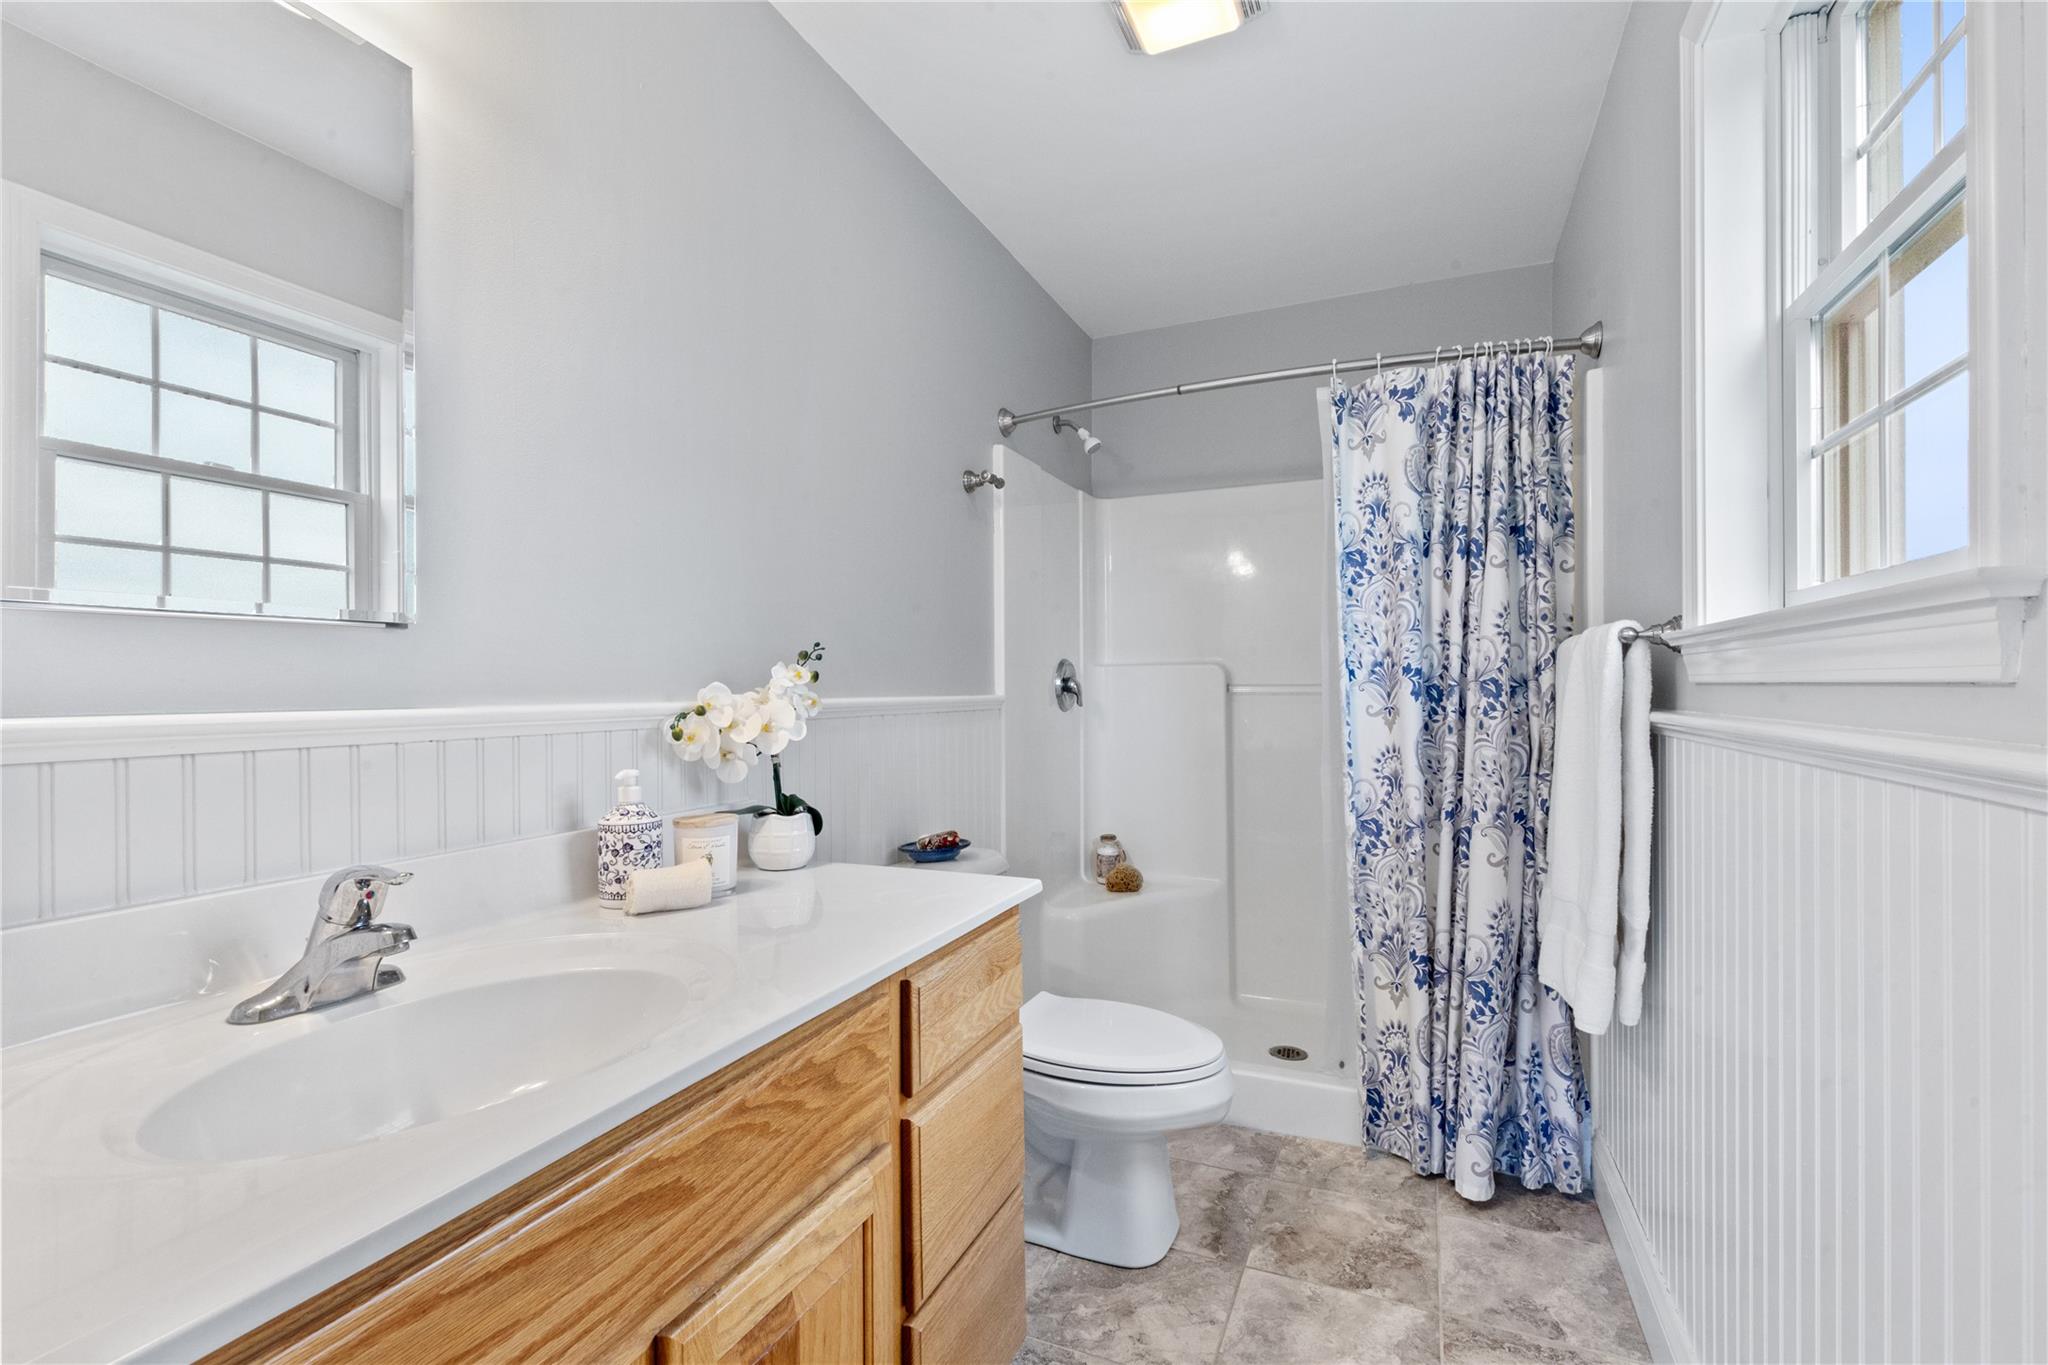
Bathroom Information
- # of Baths (Full): 4
- # of Baths (Partial): 3
- # of Baths (Total): 6.0
Interior Features
- # of Rooms: 12
- # of Stories: 2
- Basement: Yes
- Basement Description: Finished, Full, Storage Space, Walk-Out Access
- Fireplace: Yes
Exterior Features
- Exterior Walls Materials: Siding (Alum/Vinyl)
Land Information
- Land Use: Residential
- Land Use Subtype: Single Family Residential
Lot Information
- Parcel ID: 1326007060009477820000
- Lot Size: 219542 sqft
Property Information
- Property Type: Single Family Residence
- Style: Colonial, Farmhouse
- Year Built: 2006
Tax Information
- Annual Tax: $14,114
Utilities
- Water & Sewer: Private, Well
- Heating: Forced Air, Propane, Radiant
- Cooling: Central Air, Ductless
Location
- County: Dutchess
Listing Details
Investment Summary
- Monthly Cash Flow
- -$1,272
- Cap Rate
- 4.3%
- Cash-on-Cash Return
- -7.7%
- Debt Coverage Ratio
- 0.71
- Internal Rate of Return (5 years)
- -3.4%
Cash Flow
Net Operating Income (NOI) minus mortgage payments.
Calculation:
NOI - Mortgage Payments
Cap Rate (Market Value)
Capitalization Rate is a rate of return that compares the yearly Net Operating Income (NOI) to the market value.
Calculation:
NOI / Market Value
Cash-on-Cash Return (CoC)
Annual Cash Flow / Cash Invested
Calculation:
Annual cash flow divided by initial cash invested.
Debt Coverage Ratio (DCR)
Net Operating Income (NOI) divided by total debt payments.
Calculation:
NOI / Total Debt Payments
Internal Rate of Return (IRR)
A metric for assessing profitability over time. IRR is the discount rate at which the net present value (NPV) of all future cash flows (positive and negative) from an investment equals zero — including both periodic cash flow (such as rent) and a projected sale at the end of the holding period. It represents the expected annualized return, accounting for income, expenses, and the recovery of capital through a future sale.
Purchase Details
Purchase PriceThe price paid for the property. Purchase price:
| $865,000 |
|---|---|
Amount FinancedThe amount of the purchase financed through a loan. Amount financed:
| -$692,000 |
Down paymentThe initial payment made towards the purchase. Down payment:
| $173,000 |
Closing CostsFees and expenses associated with purchasing a property, typically ranging from 2% to 5% of the home’s purchase price, paid at the end of a home purchase to cover services like lending, title transfer, and taxes. Closing costs:
| $25,950 |
Rehab CostsCosts incurred to repair or improve the property, including: roof, flooring, exterior siding, kitchen, exterior paint, bathrooms, etc. Rehab costs:
| $0 |
Initial Cash InvestedThe total initial cash invested in the property. Calculation:Down payment + Buying costs + Rehab costs Initial cash invested:
| $198,950 |
Square Feet (SQFT)The total square footage of the property. Square feet:
| 4,788 |
Cost Per Square FootCost per square foot of the property. Calculation:Purchase Price / Square Feet Cost per square foot:
| $181 |
Monthly Rent Per Square FootMonthly rent divided by the number of square feet. This ratio helps investors compare rental income efficiency across properties, markets, and unit sizes Calculation:Monthly Rent / Square Feet Monthly rent per square foot:
| $1.29 |
Financing Details
Loan AmountThe total sum of money borrowed from a lender to finance a property purchase. Calculation:Purchase Price - Down Payment
Loan amount:
| $692,000 |
|---|---|
Loan to Value Ratio (LTV)Loan amount divided by the market value of the property. Calculation:Loan Amount / Market Value
Loan to value ratio:
| 80.0% |
Loan TypeThe type of loan (e.g., fixed, adjustable).
Loan type:
| Amortizing |
TermThe loan repayment period in years.
Term:
| 30 years |
Interest RateThe percentage a lender charges on the borrowed amount of a loan, determining the cost of borrowing money.
Interest rate:
| 6.500% |
Principal & Interest (PI)The principal is the portion of the loan payment that reduces the loan balance. The interest is the lender's charge for borrowing money. Calculation:(P * r * (1 + r) ** n) / ((1 + r) ** n - 1) Where:
P = Loan amount (principal)
Principal & interest:
| $4,374 |
Property TaxesAnnual taxes levied by local governments on real estate properties. These taxes fund public services like schools, roads, and emergency services.
Property tax:
| $1,176 |
InsuranceThe costs for insurance coverage to protect against financial losses due to risks like fire, natural disasters, theft, liability, or tenant-related damages. Calculation:Assumes 7% of gross rental income, unless insurance rates are specified.
Insurance:
| $434 |
Private Mortgage Insurance (PMI)A fee that borrowers pay when they take out a conventional loan with a loan-to-value (LTV) ratio above 80%.
Private mortgage insurance (PMI):
| $0 |
Monthly PaymentThe fixed amount a borrower pays each month to repay a loan. It typically includes principal and interest (P&I) and may also cover property taxes, insurance, HOA fees, and PMI if escrowed. Monthly payment:
| $5,984 |
Operating Income
| % Rent | Monthly | Yearly | |
|---|---|---|---|
Gross RentThe total rental income received from tenants before deducting any expenses. Includes base rent, late fees, pet fees, parking fees, and other recurring charges.
Gross rent:
| $6,200 | $74,400 | |
Vacancy LossExpected loss of rent due to vacancies.
Vacancy loss:
(6%)
| 6% | -$372 | -$4,464 |
Operating IncomeGross rental income minus vacancy loss. Calculation:Gross rent - Vacancy loss
Operating income:
| $5,828 | $69,936 |
Operating Expenses
| % Rent | Monthly | Yearly | |
|---|---|---|---|
Property TaxesAnnual taxes levied by local governments on real estate properties. These taxes fund public services like schools, roads, and emergency services. | 19% | -$1,176 | -$14,115 |
InsuranceThe costs for insurance coverage to protect against financial losses due to risks like fire, natural disasters, theft, liability, or tenant-related damages. Calculation:Assumes 7% of gross rental income, unless insurance rates are specified. | 7% | -$434 | -$5,208 |
Property ManagementThe costs associated with hiring a property manager to handle the day-to-day operations of a rental property. Includes management fees, leasing fes, eviction fees, etc. Calculation:Assumes 8% of gross rental income. | 8% | -$496 | -$5,952 |
Repairs & MaintenanceOngoing costs for routine upkeep and minor fixes needed to keep a property in good working condition. Calculation:Assumes 5% of gross rental income. Varies by property age and condition. | 5% | -$310 | -$3,720 |
Capital ExpensesLarge, infrequent costs for major improvements or replacements, like a new roof, HVAC system, or appliances. Calculation:Assumes 5% of gross rental income. Varies by property age. | 5% | -$310 | -$3,720 |
HOA FeesRegular dues paid to a Homeowners Association for community maintenance, amenities, and management. Similar fees include: Condo Association Fees, Co-op Maintenance Fees, etc. | n/a | n/a | n/a |
Operating ExpensesRecurring costs required to maintain and manage a rental property, including property taxes, insurance, maintenance, repairs, utilities (if paid by the owner), property management fees, and other day-to-day expenses. Calculation:Insurance + Property Taxes + Property Management + Repairs & Maintenance + Capital Expenditures + HOA Fees | 44% | -$2,726 | -$32,715 |
Cash Flow
| Monthly | Yearly | |
|---|---|---|
Net Operating Income (NOI)The income generated from a property after deducting all operating expenses but before deducting mortgage payments, taxes, and capital expenditures. Calculation:Gross Operating Income - Operating Expenses
Net operating income:
| $3,102 | $37,224 |
Mortgage PaymentThe fixed amount a borrower pays each month to repay a loan. It typically includes principal and interest (P&I) and may also cover property taxes, insurance, HOA fees, and PMI if escrowed. | -$4,374 | -$52,488 |
Cash FlowNet Operating Income (NOI) minus mortgage payments. Calculation:NOI - Mortgage Payments | $1,272 | $15,264 |