$628,000
Investment Summary
- Monthly Cash Flow
- -$1,651
- Cap Rate
- 2.7%
- Cash-on-Cash Return
- -13.7%
- Debt Coverage Ratio
- 0.47
- Internal Rate of Return (5 years)
- -9.3%
Cash Flow
Net Operating Income (NOI) minus mortgage payments.
Calculation:
NOI - Mortgage Payments
Cap Rate (Market Value)
Capitalization Rate is a rate of return that compares the yearly Net Operating Income (NOI) to the market value.
Calculation:
NOI / Market Value
Cash-on-Cash Return (CoC)
Annual Cash Flow / Cash Invested
Calculation:
Annual cash flow divided by initial cash invested.
Debt Coverage Ratio (DCR)
Net Operating Income (NOI) divided by total debt payments.
Calculation:
NOI / Total Debt Payments
Internal Rate of Return (IRR)
A metric for assessing profitability over time. IRR is the discount rate at which the net present value (NPV) of all future cash flows (positive and negative) from an investment equals zero — including both periodic cash flow (such as rent) and a projected sale at the end of the holding period. It represents the expected annualized return, accounting for income, expenses, and the recovery of capital through a future sale.
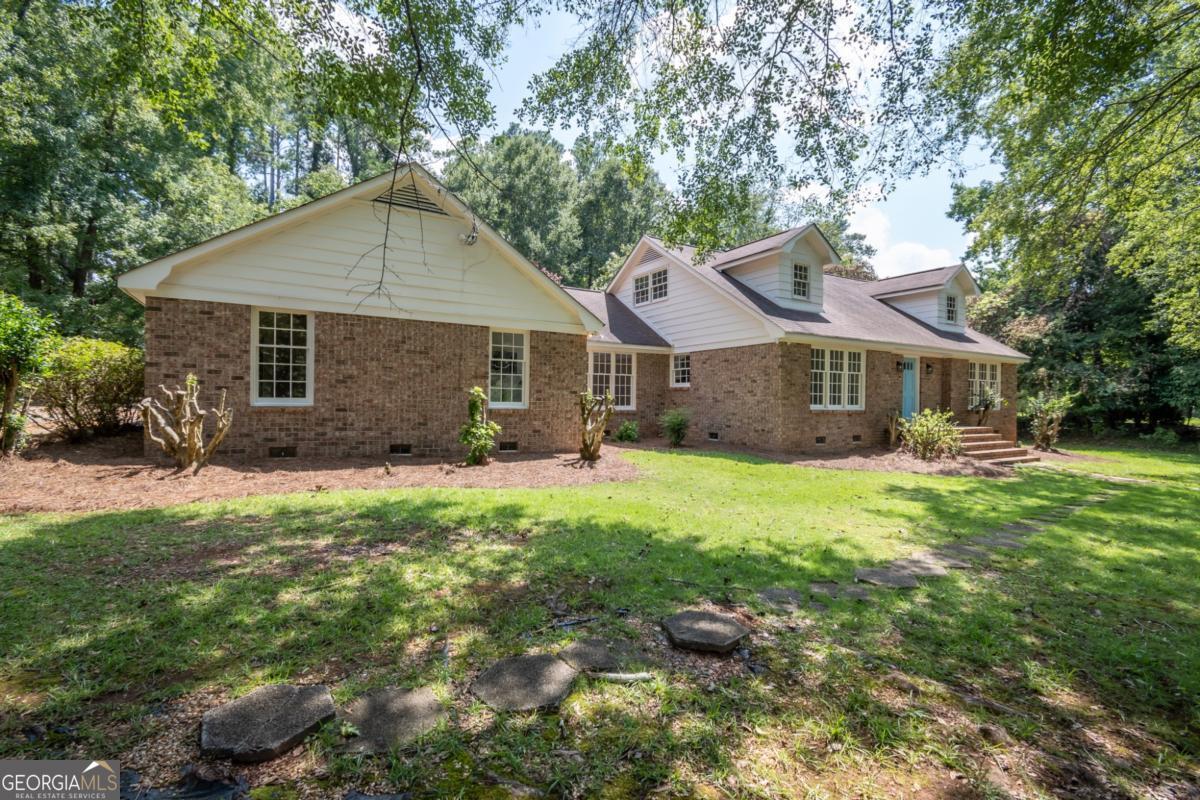
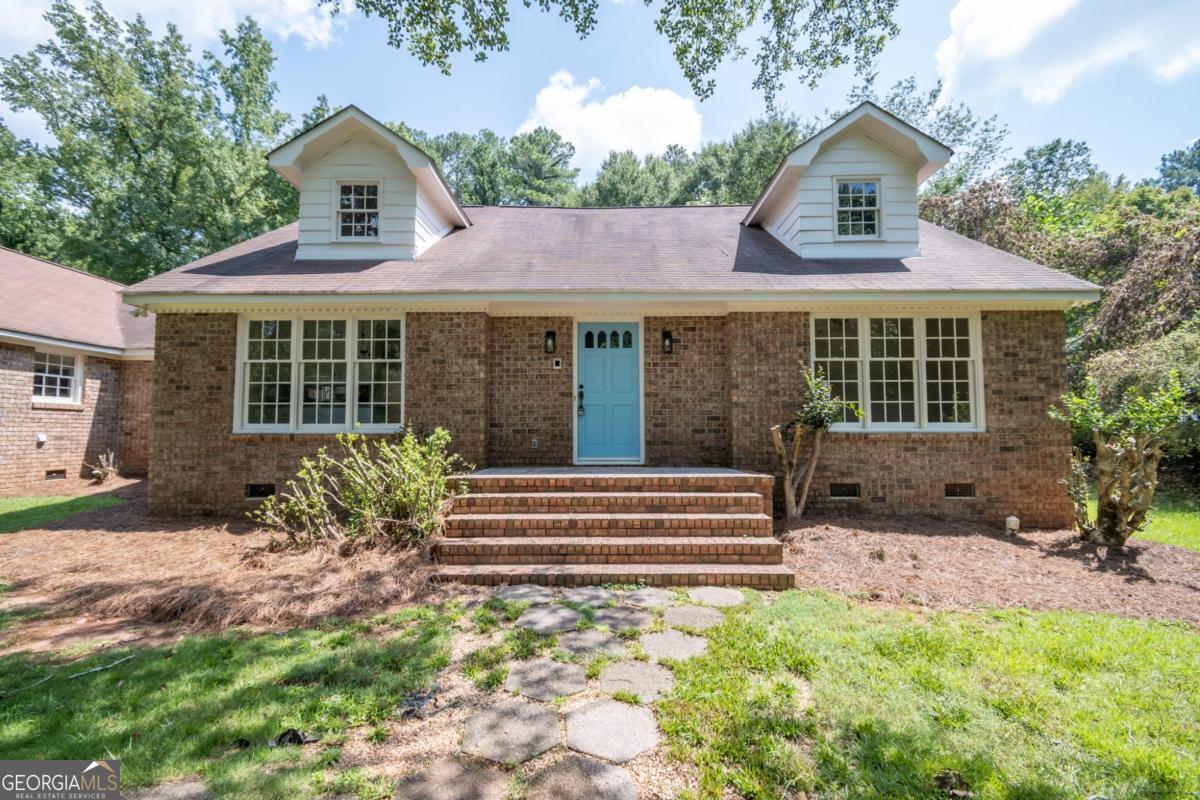
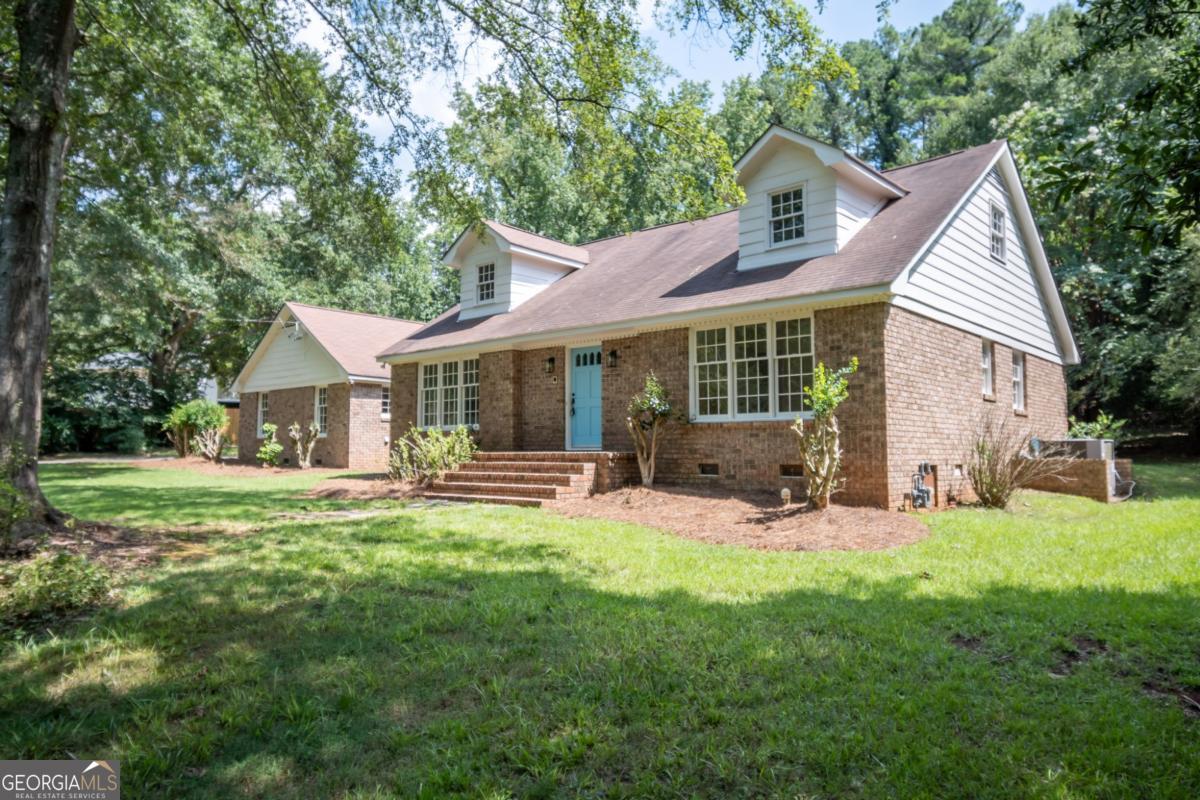
Property Description
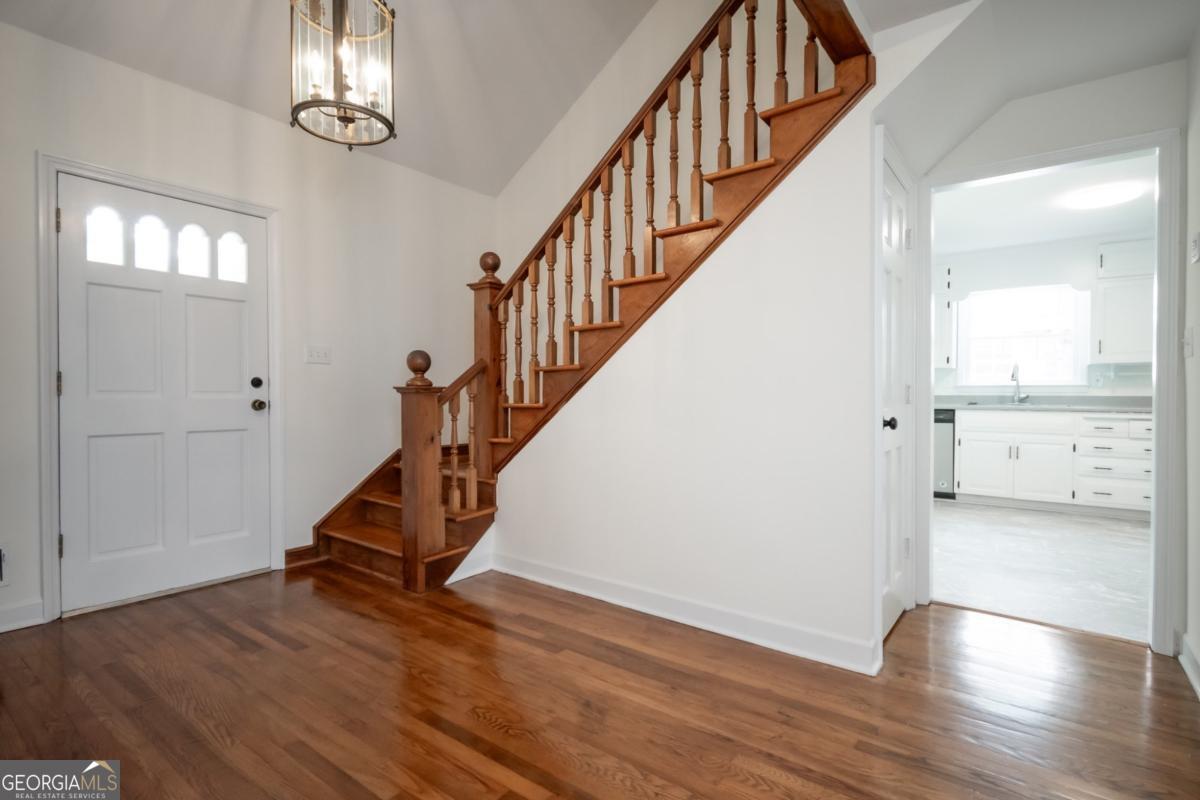
Presenting an updated, move-in ready, all- brick home in the ever-desirable Kingswood community. Traditional elegance and understated appeal radiate throughout this stately home. Graciously welcomed by the 2-story foyer, the details begin to unfold with the gleaming hardwood floors and fresh interior paint throughout providing a clean slate. Boasting a wonderfully efficient design, this formal concept hosts multiple designated spaces that encourage entertaining and everyday comfortable living. The foyer ushers you into the living room, flanked by the formal dining room, allowing the ideal layout to enjoy guests and lavish dinners. Added convenience is provided with the centrally located kitchen providing quick access. If formal dinners is not your thing, with the sunlit breakfast room offering additional dining options, the dining room could easily be utilized as a home office or extended living space. The home chef will be pleased to find an abundance of white cabinets offering max storage options, ample counter space for meal prep, updated floors and basic appliance package, all ready to serve. Complimented by a masonry fireplace, the spacious great room invites you to sit fireside and relax as you unwind from a long day. Illuminated by windows and a French door leading to the rear yard, the cozy great room is the heart of the home. With plenty of room to accommodate many, this home offers 6 spacious bedrooms and 3 full baths. The primary bedroom, along with 2 spacious accessory bedrooms and updated full bath, is conveniently found on the main. Perfectly appointed, the owner's suite provides ample closet space and ensuite access to the completely renovated primary full bath. Featuring a large tiled shower, and a dual-sink furniture-styled vanity, this primary bathroom is sure to impress. Additionally, ascend the stairs to find 3 more secondary bedrooms, and the 3rd updated bathroom. Each cozy domicile offers new plush carpet, spacious closets, and quick access to the full bath. These expansive spaces can also be utilized as hobby space, bonus room, or whatever fits your needs. Amenities extend to the exterior where an oversized carport provides ample parking options, and a stone patio is tucked away for added privacy overlooking the completely fenced rear yard. This tranquil setting establishes a designated space for outdoor entertaining and offers an excellent area for your fur babies to safely enjoy. This total package features in-town convenience, boasts close proximity to UGA and Downtown Athens, ultimately provides everything West Athens has to offer at your fingertips. Superb convenience, pristine condition, in a highly desirable neighborhood...dont delay, this traditional home will be gone before you know it!
Build Your Team
Quickly find investor-friendly professionals who can help you succeed in real estate investing at any stage of the investing journey.


Agents
Match with investor-friendly agents who can help you find, analyze, and close your next deal


Lenders
Get the best funding…find investor-friendly lenders who specialize in your deal strategy


Property Managers
Transition to passive investing. Find a trusted property management partnership that lasts.


Tax Pros & Accountants
Taxes and financial reporting made easy—find experts to create tax savings strategies, file taxes, and more
Location
Property Details
Parking
- Description: Carport
- Details: Attached, Carport, Guest, Kitchen Level, Off Street, Parking Pad, Storage
- Garage Spaces: 0
- Spaces Total: 2
Bedroom Information
- # of Bedrooms: 6
Bathroom Information
- # of Baths (Full): 3
- # of Baths (Partial): 1
- # of Baths (Total): 3.0
Interior Features
- # of Rooms: 9
- # of Stories: 1
- Basement Description: Crawl Space
- Fireplace: Yes
Exterior Features
- Exterior Walls Materials: Brick
- Roof Type: Gable
- Roof Material: Composition
Land Information
- Land Use: Residential
- Land Use Subtype: Single Family Residential
Lot Information
- Parcel ID: 082AB002
- Lot Size: 0 sqft
Property Information
- Property Type: Single Family Residence
- Style: Traditional
- Year Built: 1974
Tax Information
- Annual Tax: $5,916
Utilities
- Water & Sewer: Public
- Heating: Heat Pump, Central, Electric, Forced Air
- Cooling: Ceiling Fan(s), Central Air, Electric, Heat Pump
Location
- County: Clarke
Listing Details
Investment Summary
- Monthly Cash Flow
- -$1,651
- Cap Rate
- 2.7%
- Cash-on-Cash Return
- -13.7%
- Debt Coverage Ratio
- 0.47
- Internal Rate of Return (5 years)
- -9.3%
Cash Flow
Net Operating Income (NOI) minus mortgage payments.
Calculation:
NOI - Mortgage Payments
Cap Rate (Market Value)
Capitalization Rate is a rate of return that compares the yearly Net Operating Income (NOI) to the market value.
Calculation:
NOI / Market Value
Cash-on-Cash Return (CoC)
Annual Cash Flow / Cash Invested
Calculation:
Annual cash flow divided by initial cash invested.
Debt Coverage Ratio (DCR)
Net Operating Income (NOI) divided by total debt payments.
Calculation:
NOI / Total Debt Payments
Internal Rate of Return (IRR)
A metric for assessing profitability over time. IRR is the discount rate at which the net present value (NPV) of all future cash flows (positive and negative) from an investment equals zero — including both periodic cash flow (such as rent) and a projected sale at the end of the holding period. It represents the expected annualized return, accounting for income, expenses, and the recovery of capital through a future sale.
Purchase Details
Purchase PriceThe price paid for the property. Purchase price:
| $628,000 |
|---|---|
Amount FinancedThe amount of the purchase financed through a loan. Amount financed:
| -$502,400 |
Down paymentThe initial payment made towards the purchase. Down payment:
| $125,600 |
Closing CostsFees and expenses associated with purchasing a property, typically ranging from 2% to 5% of the home’s purchase price, paid at the end of a home purchase to cover services like lending, title transfer, and taxes. Closing costs:
| $18,840 |
Rehab CostsCosts incurred to repair or improve the property, including: roof, flooring, exterior siding, kitchen, exterior paint, bathrooms, etc. Rehab costs:
| $0 |
Initial Cash InvestedThe total initial cash invested in the property. Calculation:Down payment + Buying costs + Rehab costs Initial cash invested:
| $144,440 |
Square Feet (SQFT)The total square footage of the property. Square feet:
| 3,273 |
Cost Per Square FootCost per square foot of the property. Calculation:Purchase Price / Square Feet Cost per square foot:
| $192 |
Monthly Rent Per Square FootMonthly rent divided by the number of square feet. This ratio helps investors compare rental income efficiency across properties, markets, and unit sizes Calculation:Monthly Rent / Square Feet Monthly rent per square foot:
| $0.86 |
Financing Details
Loan AmountThe total sum of money borrowed from a lender to finance a property purchase. Calculation:Purchase Price - Down Payment
Loan amount:
| $502,400 |
|---|---|
Loan to Value Ratio (LTV)Loan amount divided by the market value of the property. Calculation:Loan Amount / Market Value
Loan to value ratio:
| 80.0% |
Loan TypeThe type of loan (e.g., fixed, adjustable).
Loan type:
| Amortizing |
TermThe loan repayment period in years.
Term:
| 30 years |
Interest RateThe percentage a lender charges on the borrowed amount of a loan, determining the cost of borrowing money.
Interest rate:
| 6.240% |
Principal & Interest (PI)The principal is the portion of the loan payment that reduces the loan balance. The interest is the lender's charge for borrowing money. Calculation:(P * r * (1 + r) ** n) / ((1 + r) ** n - 1) Where:
P = Loan amount (principal)
Principal & interest:
| $3,090 |
Property TaxesAnnual taxes levied by local governments on real estate properties. These taxes fund public services like schools, roads, and emergency services.
Property tax:
| $493 |
InsuranceThe costs for insurance coverage to protect against financial losses due to risks like fire, natural disasters, theft, liability, or tenant-related damages. Calculation:Assumes 7% of gross rental income, unless insurance rates are specified.
Insurance:
| $196 |
Private Mortgage Insurance (PMI)A fee that borrowers pay when they take out a conventional loan with a loan-to-value (LTV) ratio above 80%.
Private mortgage insurance (PMI):
| $0 |
Monthly PaymentThe fixed amount a borrower pays each month to repay a loan. It typically includes principal and interest (P&I) and may also cover property taxes, insurance, HOA fees, and PMI if escrowed. Monthly payment:
| $3,779 |
Operating Income
| % Rent | Monthly | Yearly | |
|---|---|---|---|
Gross RentThe total rental income received from tenants before deducting any expenses. Includes base rent, late fees, pet fees, parking fees, and other recurring charges.
Gross rent:
| $2,800 | $33,600 | |
Vacancy LossExpected loss of rent due to vacancies.
Vacancy loss:
(6%)
| 6% | -$168 | -$2,016 |
Operating IncomeGross rental income minus vacancy loss. Calculation:Gross rent - Vacancy loss
Operating income:
| $2,632 | $31,584 |
Operating Expenses
| % Rent | Monthly | Yearly | |
|---|---|---|---|
Property TaxesAnnual taxes levied by local governments on real estate properties. These taxes fund public services like schools, roads, and emergency services. | 18% | -$493 | -$5,917 |
InsuranceThe costs for insurance coverage to protect against financial losses due to risks like fire, natural disasters, theft, liability, or tenant-related damages. Calculation:Assumes 7% of gross rental income, unless insurance rates are specified. | 7% | -$196 | -$2,352 |
Property ManagementThe costs associated with hiring a property manager to handle the day-to-day operations of a rental property. Includes management fees, leasing fes, eviction fees, etc. Calculation:Assumes 8% of gross rental income. | 8% | -$224 | -$2,688 |
Repairs & MaintenanceOngoing costs for routine upkeep and minor fixes needed to keep a property in good working condition. Calculation:Assumes 5% of gross rental income. Varies by property age and condition. | 5% | -$140 | -$1,680 |
Capital ExpensesLarge, infrequent costs for major improvements or replacements, like a new roof, HVAC system, or appliances. Calculation:Assumes 5% of gross rental income. Varies by property age. | 5% | -$140 | -$1,680 |
HOA FeesRegular dues paid to a Homeowners Association for community maintenance, amenities, and management. Similar fees include: Condo Association Fees, Co-op Maintenance Fees, etc. | n/a | n/a | n/a |
Operating ExpensesRecurring costs required to maintain and manage a rental property, including property taxes, insurance, maintenance, repairs, utilities (if paid by the owner), property management fees, and other day-to-day expenses. Calculation:Insurance + Property Taxes + Property Management + Repairs & Maintenance + Capital Expenditures + HOA Fees | 43% | -$1,193 | -$14,317 |
Cash Flow
| Monthly | Yearly | |
|---|---|---|
Net Operating Income (NOI)The income generated from a property after deducting all operating expenses but before deducting mortgage payments, taxes, and capital expenditures. Calculation:Gross Operating Income - Operating Expenses
Net operating income:
| $1,439 | $17,268 |
Mortgage PaymentThe fixed amount a borrower pays each month to repay a loan. It typically includes principal and interest (P&I) and may also cover property taxes, insurance, HOA fees, and PMI if escrowed. | -$3,090 | -$37,080 |
Cash FlowNet Operating Income (NOI) minus mortgage payments. Calculation:NOI - Mortgage Payments | -$1,651 | -$19,812 |