

$2,285,000
Investment Summary
- Monthly Cash Flow
- -$9,236
- Cap Rate
- 1.3%
- Cash-on-Cash Return
- -21.1%
- Debt Coverage Ratio
- 0.21
- Internal Rate of Return (5 years)
- -16.4%
Cash Flow
Net Operating Income (NOI) minus mortgage payments.
Calculation:
NOI - Mortgage Payments
Cap Rate (Market Value)
Capitalization Rate is a rate of return that compares the yearly Net Operating Income (NOI) to the market value.
Calculation:
NOI / Market Value
Cash-on-Cash Return (CoC)
Annual Cash Flow / Cash Invested
Calculation:
Annual cash flow divided by initial cash invested.
Debt Coverage Ratio (DCR)
Net Operating Income (NOI) divided by total debt payments.
Calculation:
NOI / Total Debt Payments
Internal Rate of Return (IRR)
A metric for assessing profitability over time. IRR is the discount rate at which the net present value (NPV) of all future cash flows (positive and negative) from an investment equals zero — including both periodic cash flow (such as rent) and a projected sale at the end of the holding period. It represents the expected annualized return, accounting for income, expenses, and the recovery of capital through a future sale.
Property Description
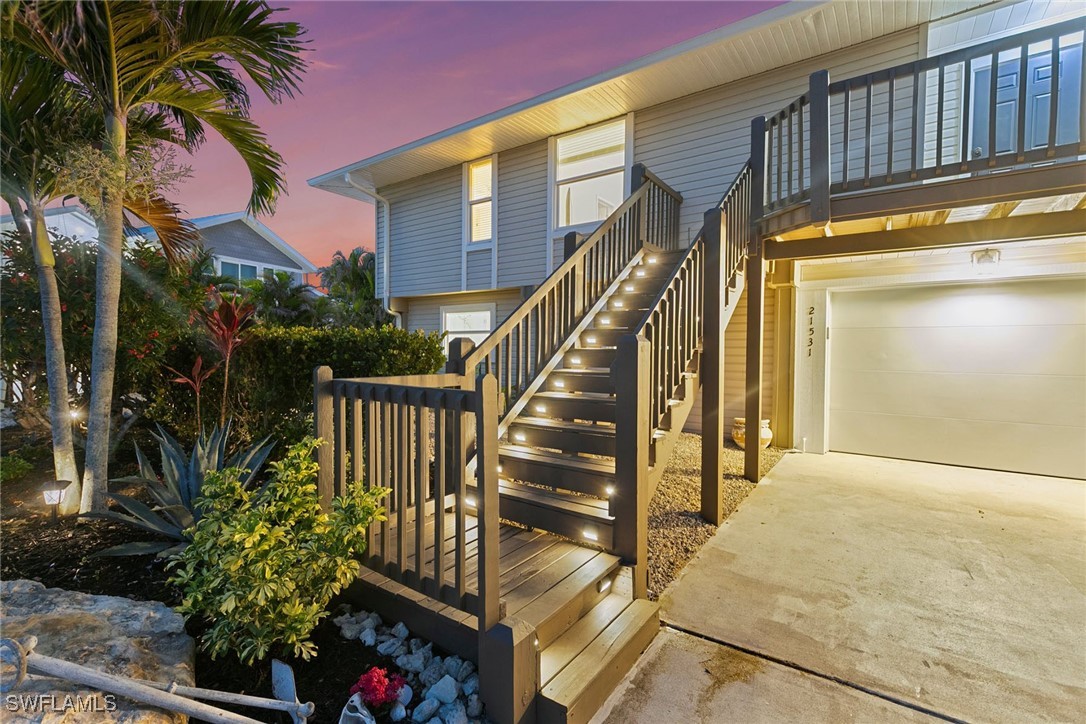
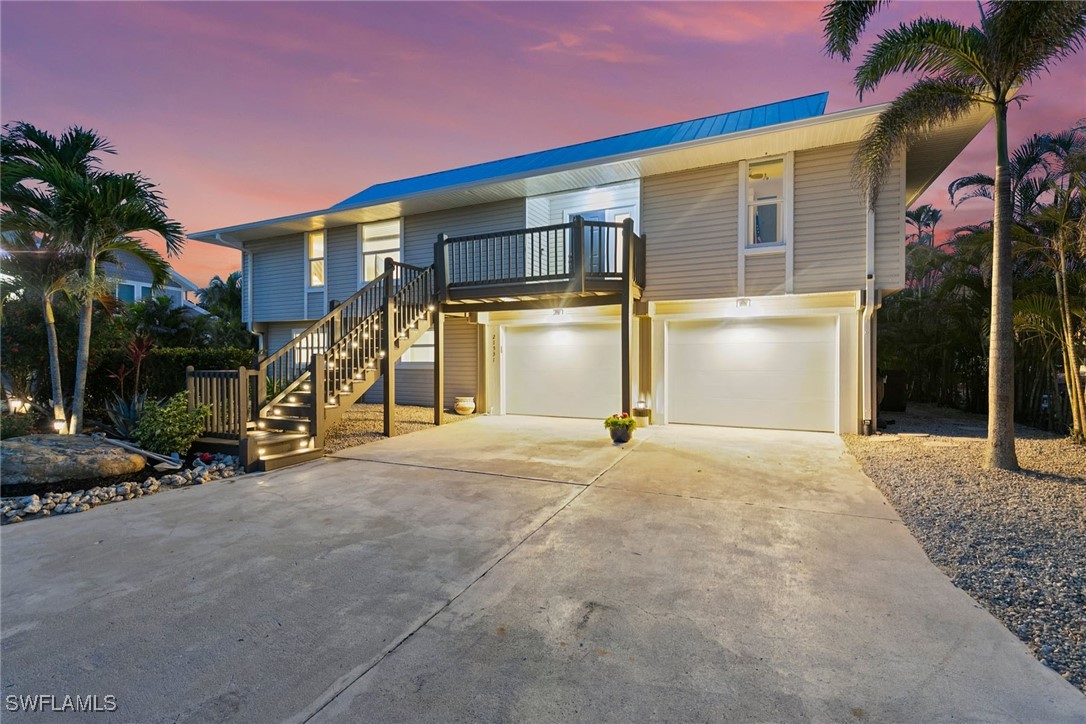
Positioned on a desirable canal-front homesite in Fort Myers Beach’s exclusive Yachtsman’s Cove, this elevated coastal home offers exceptional privacy and lifestyle amenities. With direct water access, a 30-foot boat slip and deeded beach access at end of the street, this residence is the ideal beach and boater escape. The property’s structural and systems upgrades, completed between 2023 and 2025, reflect an unwavering commitment to quality and durability. A 12-inch elevated seawall with new tiebacks and riprap, four French drains for advanced water diversion. Hurricane-impact windows, sliders, garage doors and entry doors are paired with a 2023 standing seam metal roof, and whole-house generator, ensuring storm resilience throughout. All warranties and service contracts, covering mechanicals and impact-rated features, are fully transferable. The home is serviced by dual-zone HVAC systems, a full electrical rewire, and new plumbing and pipes. The security system includes a video-enabled doorbell, motion spotlight cameras and full periphery surveillance. Outside, a saltwater pool and raised waterfall spa are surrounded by a paver deck and updated landscape design, including six planter beds in the lanai and full-property irrigation added in 2024. The 135-foot boardwalk and fishing station are constructed from WEARDECK™ heat-resistant composite, with rope railing, dock bumpers and solar light caps. The Hurricane Storm Series 10,000-pound boat lift includes a GEM remote and electric service. A two-tier entertainment deck (10-by-20 and 10-by-8 feet) also constructed with WEARDECK™ provides ample room for outdoor dining and sunset viewing. The lower level features epoxy flooring, walls lined with 3-foot-high Durock, and a custom outdoor kitchen island finished in stucco over cement block with granite countertops and drink rail. Elevated appliances include a KitchenAid® refrigerator and 35-pound ice maker. Additional highlights include a full bath, three ceiling fans, a set-in closet and a storage room with soft-close cabinetry. Upstairs, the vaulted main living area is centered by a gourmet kitchen with granite surfaces, subway tile, soft-close cabinets and pantry, a Ruvati® workstation sink, KitchenAid® glass top stove, microwave drawer, refrigerator, dishwasher and a Whirlpool dual-zone wine refrigerator. The expansive primary suite includes a walk-in closet, full bath with granite countertops and powder vanity. Two additional bedrooms include new carpet and ceiling fans. A full guest bath features granite counters and a tub-shower combination. A full-length deck spans the width of the home and connects to a cathedral-style lanai. The attached two-car garage includes custom cabinetry, workbenches and organizer systems. Additional features include epoxy flooring and 3' Durock around base at the ground level spaces. This extraordinary property offers a rare combination of upgraded infrastructure, serene water views and a premium beachside lifestyle!
Build Your Team
Quickly find investor-friendly professionals who can help you succeed in real estate investing at any stage of the investing journey.


Agents
Match with investor-friendly agents who can help you find, analyze, and close your next deal


Lenders
Get the best funding…find investor-friendly lenders who specialize in your deal strategy


Property Managers
Transition to passive investing. Find a trusted property management partnership that lasts.


Tax Pros & Accountants
Taxes and financial reporting made easy—find experts to create tax savings strategies, file taxes, and more
Location
Property Details
Parking
- Description: Mixed
- Details: Attached, Driveway, Garage, Paved, Garage Door Opener
- Garage Spaces: 2
- Spaces Total: 0
Bedroom Information
- # of Bedrooms: 4
Bathroom Information
- # of Baths (Full): 2
- # of Baths (Total): 2.0
Interior Features
- # of Stories: 2
Exterior Features
- Exterior Walls Materials: Siding (Alum/Vinyl)
- Foundation: Raised
- Roof Type: IRR/Cathedral
- Roof Material: Metal
- Pool: Yes
HOA
- Has HOA: Yes
- Additional HOA Fee: $1,500/annually
Land Information
- Land Use: Residential
- Land Use Subtype: Single Family Residential
Lot Information
- Parcel ID: 284624W400500.0030
- Lot Size: 0 sqft
Property Information
- Property Type: Single Family Residence
- Style: Two Story
- Year Built: 1990
Tax Information
- Annual Tax: $5,300
Utilities
- Water & Sewer: Public
- Heating: Central, Electric
- Cooling: Central Air, Electric
Location
- County: Lee
Listing Details
Investment Summary
- Monthly Cash Flow
- -$9,236
- Cap Rate
- 1.3%
- Cash-on-Cash Return
- -21.1%
- Debt Coverage Ratio
- 0.21
- Internal Rate of Return (5 years)
- -16.4%
Cash Flow
Net Operating Income (NOI) minus mortgage payments.
Calculation:
NOI - Mortgage Payments
Cap Rate (Market Value)
Capitalization Rate is a rate of return that compares the yearly Net Operating Income (NOI) to the market value.
Calculation:
NOI / Market Value
Cash-on-Cash Return (CoC)
Annual Cash Flow / Cash Invested
Calculation:
Annual cash flow divided by initial cash invested.
Debt Coverage Ratio (DCR)
Net Operating Income (NOI) divided by total debt payments.
Calculation:
NOI / Total Debt Payments
Internal Rate of Return (IRR)
A metric for assessing profitability over time. IRR is the discount rate at which the net present value (NPV) of all future cash flows (positive and negative) from an investment equals zero — including both periodic cash flow (such as rent) and a projected sale at the end of the holding period. It represents the expected annualized return, accounting for income, expenses, and the recovery of capital through a future sale.
Purchase Details
Purchase PriceThe price paid for the property. Purchase price:
| $2,285,000 |
|---|---|
Amount FinancedThe amount of the purchase financed through a loan. Amount financed:
| -$1,828,000 |
Down paymentThe initial payment made towards the purchase. Down payment:
| $457,000 |
Closing CostsFees and expenses associated with purchasing a property, typically ranging from 2% to 5% of the home’s purchase price, paid at the end of a home purchase to cover services like lending, title transfer, and taxes. Closing costs:
| $68,550 |
Rehab CostsCosts incurred to repair or improve the property, including: roof, flooring, exterior siding, kitchen, exterior paint, bathrooms, etc. Rehab costs:
| $0 |
Initial Cash InvestedThe total initial cash invested in the property. Calculation:Down payment + Buying costs + Rehab costs Initial cash invested:
| $525,550 |
Square Feet (SQFT)The total square footage of the property. Square feet:
| 2,503 |
Cost Per Square FootCost per square foot of the property. Calculation:Purchase Price / Square Feet Cost per square foot:
| $913 |
Monthly Rent Per Square FootMonthly rent divided by the number of square feet. This ratio helps investors compare rental income efficiency across properties, markets, and unit sizes Calculation:Monthly Rent / Square Feet Monthly rent per square foot:
| $1.76 |
Financing Details
Loan AmountThe total sum of money borrowed from a lender to finance a property purchase. Calculation:Purchase Price - Down Payment
Loan amount:
| $1,828,000 |
|---|---|
Loan to Value Ratio (LTV)Loan amount divided by the market value of the property. Calculation:Loan Amount / Market Value
Loan to value ratio:
| 80.0% |
Loan TypeThe type of loan (e.g., fixed, adjustable).
Loan type:
| Amortizing |
TermThe loan repayment period in years.
Term:
| 30 years |
Interest RateThe percentage a lender charges on the borrowed amount of a loan, determining the cost of borrowing money.
Interest rate:
| 6.625% |
Principal & Interest (PI)The principal is the portion of the loan payment that reduces the loan balance. The interest is the lender's charge for borrowing money. Calculation:(P * r * (1 + r) ** n) / ((1 + r) ** n - 1) Where:
P = Loan amount (principal)
Principal & interest:
| $11,705 |
Property TaxesAnnual taxes levied by local governments on real estate properties. These taxes fund public services like schools, roads, and emergency services.
Property tax:
| $442 |
InsuranceThe costs for insurance coverage to protect against financial losses due to risks like fire, natural disasters, theft, liability, or tenant-related damages. Calculation:Assumes 7% of gross rental income, unless insurance rates are specified.
Insurance:
| $308 |
Private Mortgage Insurance (PMI)A fee that borrowers pay when they take out a conventional loan with a loan-to-value (LTV) ratio above 80%.
Private mortgage insurance (PMI):
| $0 |
Monthly PaymentThe fixed amount a borrower pays each month to repay a loan. It typically includes principal and interest (P&I) and may also cover property taxes, insurance, HOA fees, and PMI if escrowed. Monthly payment:
| $12,455 |
Operating Income
| % Rent | Monthly | Yearly | |
|---|---|---|---|
Gross RentThe total rental income received from tenants before deducting any expenses. Includes base rent, late fees, pet fees, parking fees, and other recurring charges.
Gross rent:
| $4,400 | $52,800 | |
Vacancy LossExpected loss of rent due to vacancies.
Vacancy loss:
(6%)
| 6% | -$264 | -$3,168 |
Operating IncomeGross rental income minus vacancy loss. Calculation:Gross rent - Vacancy loss
Operating income:
| $4,136 | $49,632 |
Operating Expenses
| % Rent | Monthly | Yearly | |
|---|---|---|---|
Property TaxesAnnual taxes levied by local governments on real estate properties. These taxes fund public services like schools, roads, and emergency services. | 10% | -$442 | -$5,301 |
InsuranceThe costs for insurance coverage to protect against financial losses due to risks like fire, natural disasters, theft, liability, or tenant-related damages. Calculation:Assumes 7% of gross rental income, unless insurance rates are specified. | 7% | -$308 | -$3,696 |
Property ManagementThe costs associated with hiring a property manager to handle the day-to-day operations of a rental property. Includes management fees, leasing fes, eviction fees, etc. Calculation:Assumes 8% of gross rental income. | 8% | -$352 | -$4,224 |
Repairs & MaintenanceOngoing costs for routine upkeep and minor fixes needed to keep a property in good working condition. Calculation:Assumes 5% of gross rental income. Varies by property age and condition. | 5% | -$220 | -$2,640 |
Capital ExpensesLarge, infrequent costs for major improvements or replacements, like a new roof, HVAC system, or appliances. Calculation:Assumes 5% of gross rental income. Varies by property age. | 5% | -$220 | -$2,640 |
HOA FeesRegular dues paid to a Homeowners Association for community maintenance, amenities, and management. Similar fees include: Condo Association Fees, Co-op Maintenance Fees, etc. | 3% | -$125 | -$1,500 |
Operating ExpensesRecurring costs required to maintain and manage a rental property, including property taxes, insurance, maintenance, repairs, utilities (if paid by the owner), property management fees, and other day-to-day expenses. Calculation:Insurance + Property Taxes + Property Management + Repairs & Maintenance + Capital Expenditures + HOA Fees | 38% | -$1,667 | -$20,001 |
Cash Flow
| Monthly | Yearly | |
|---|---|---|
Net Operating Income (NOI)The income generated from a property after deducting all operating expenses but before deducting mortgage payments, taxes, and capital expenditures. Calculation:Gross Operating Income - Operating Expenses
Net operating income:
| $2,469 | $29,628 |
Mortgage PaymentThe fixed amount a borrower pays each month to repay a loan. It typically includes principal and interest (P&I) and may also cover property taxes, insurance, HOA fees, and PMI if escrowed. | -$11,705 | -$140,460 |
Cash FlowNet Operating Income (NOI) minus mortgage payments. Calculation:NOI - Mortgage Payments | $9,236 | $110,832 |