
$35,000,000
Investment Summary
- Monthly Cash Flow
- -$191,726
- Cap Rate
- -0.5%
- Cash-on-Cash Return
- -28.6%
- Debt Coverage Ratio
- -0.08
- Internal Rate of Return (5 years)
- -23.5%
Cash Flow
Net Operating Income (NOI) minus mortgage payments.
Calculation:
NOI - Mortgage Payments
Cap Rate (Market Value)
Capitalization Rate is a rate of return that compares the yearly Net Operating Income (NOI) to the market value.
Calculation:
NOI / Market Value
Cash-on-Cash Return (CoC)
Annual Cash Flow / Cash Invested
Calculation:
Annual cash flow divided by initial cash invested.
Debt Coverage Ratio (DCR)
Net Operating Income (NOI) divided by total debt payments.
Calculation:
NOI / Total Debt Payments
Internal Rate of Return (IRR)
A metric for assessing profitability over time. IRR is the discount rate at which the net present value (NPV) of all future cash flows (positive and negative) from an investment equals zero — including both periodic cash flow (such as rent) and a projected sale at the end of the holding period. It represents the expected annualized return, accounting for income, expenses, and the recovery of capital through a future sale.
Property Description
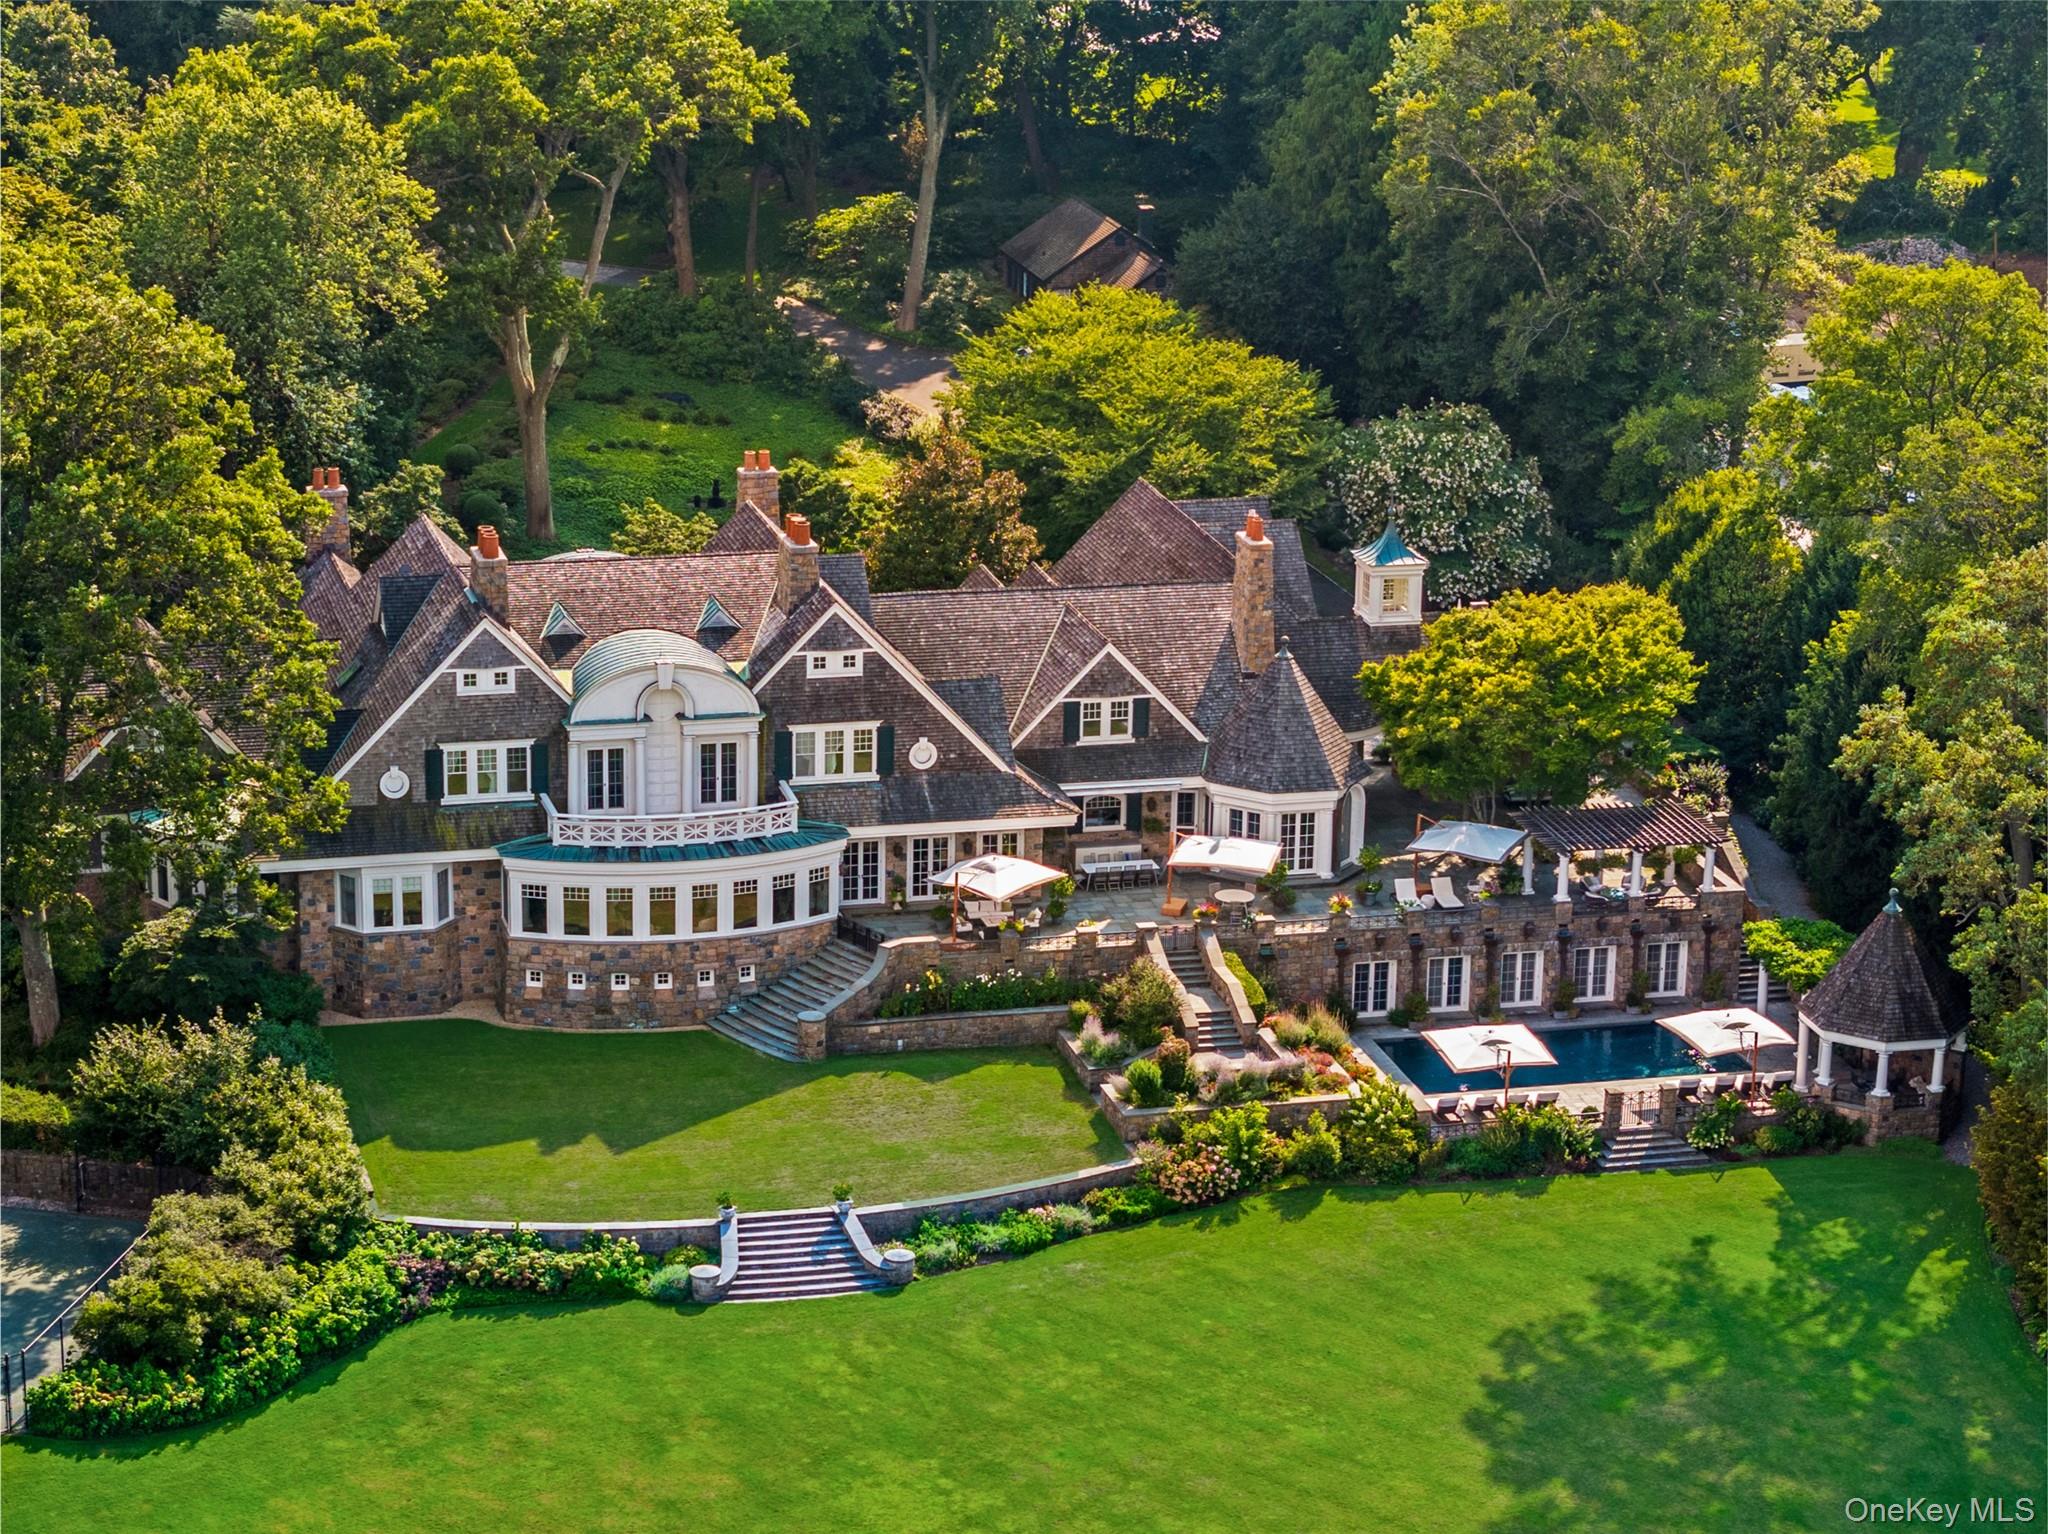
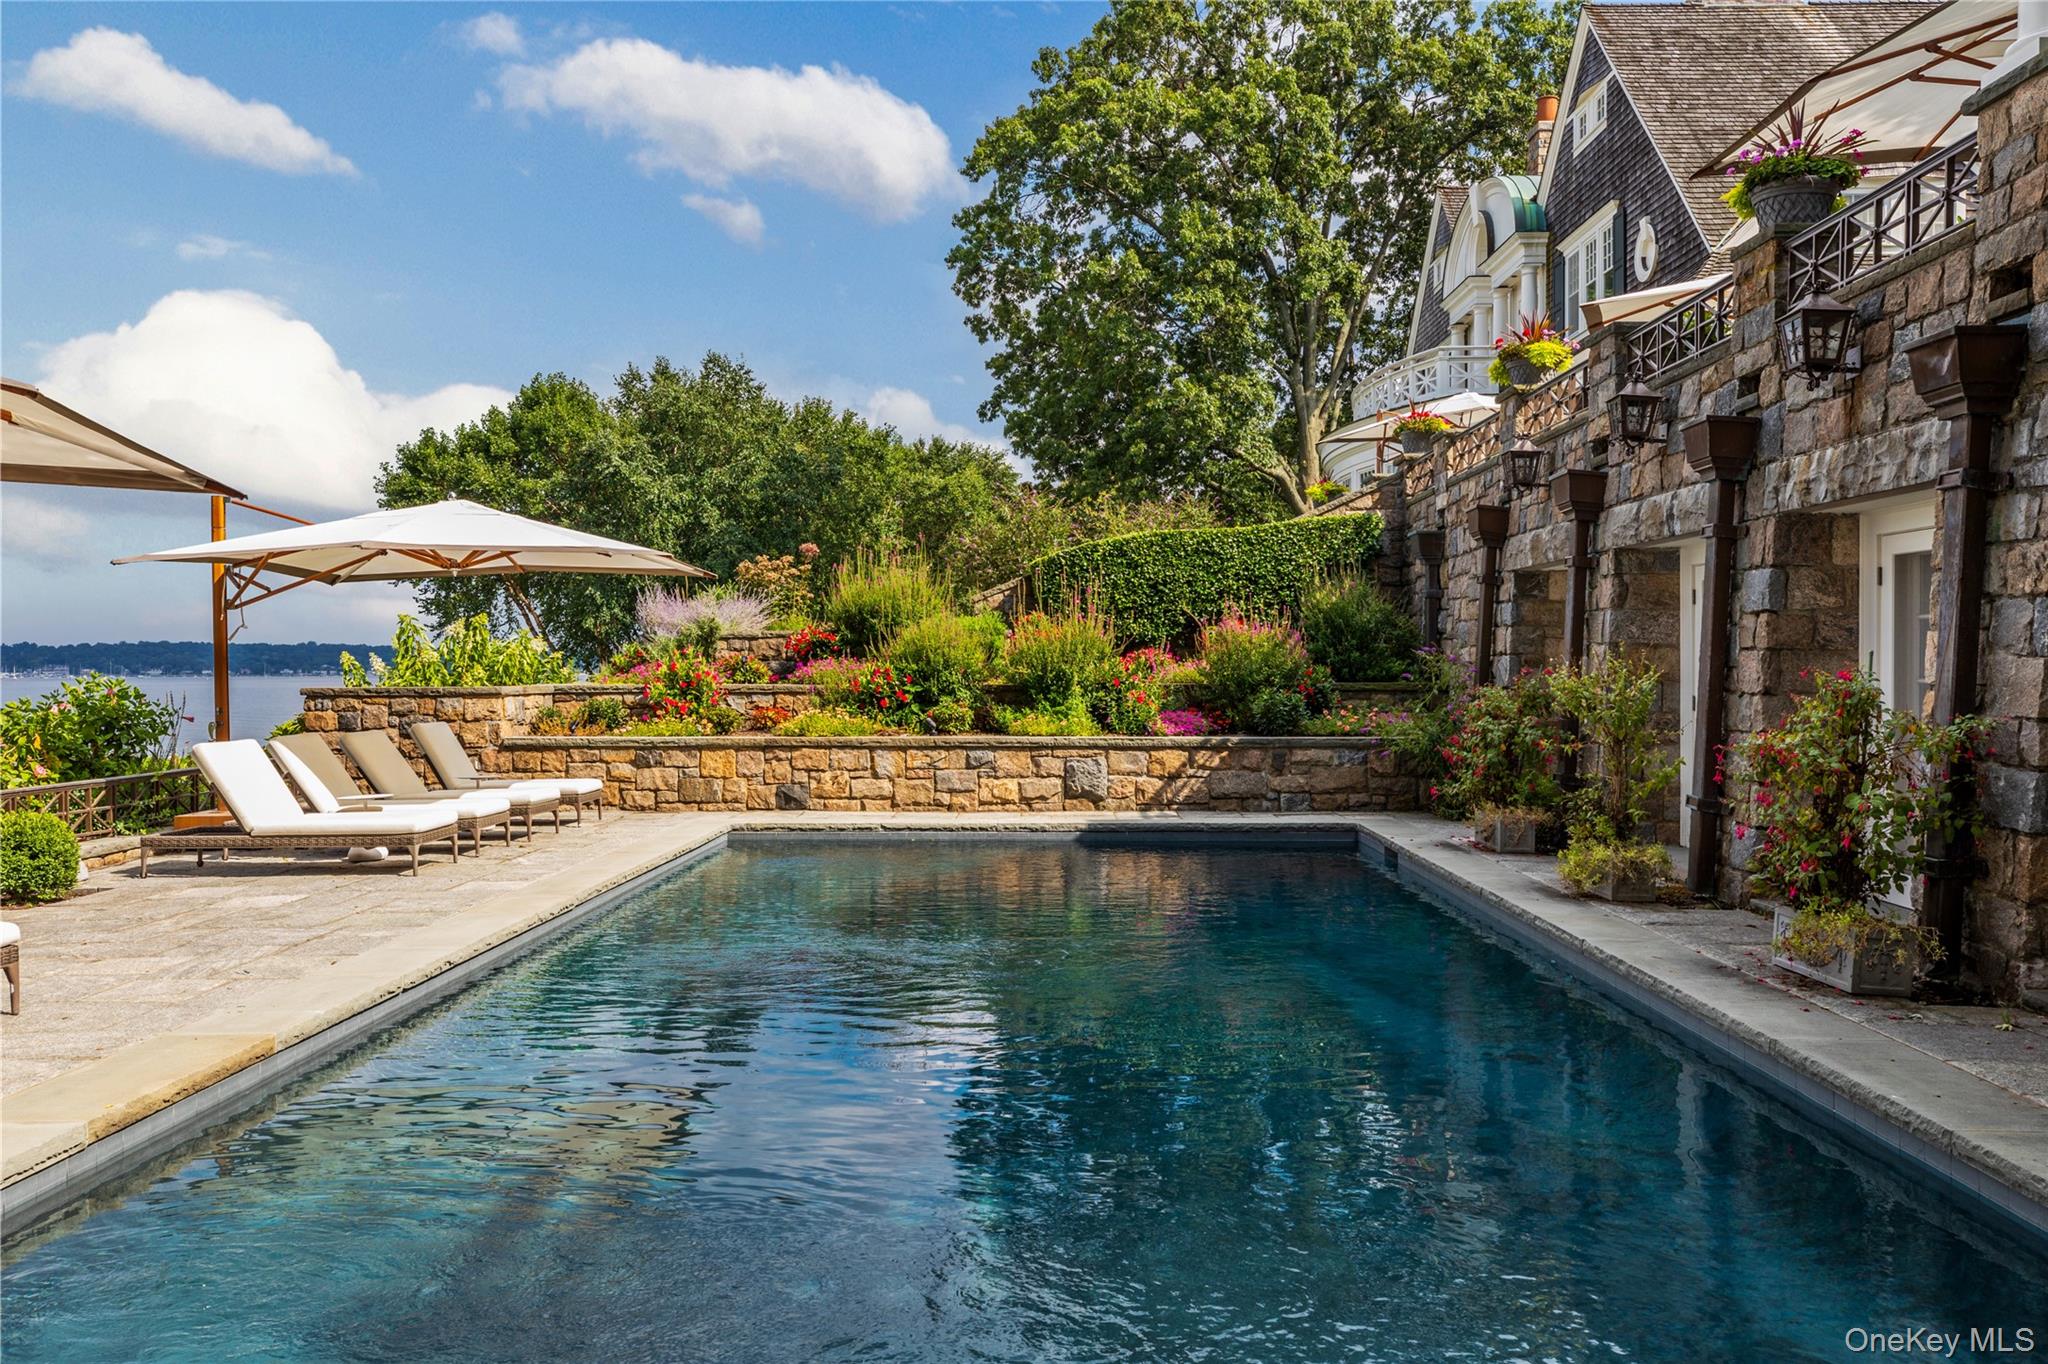
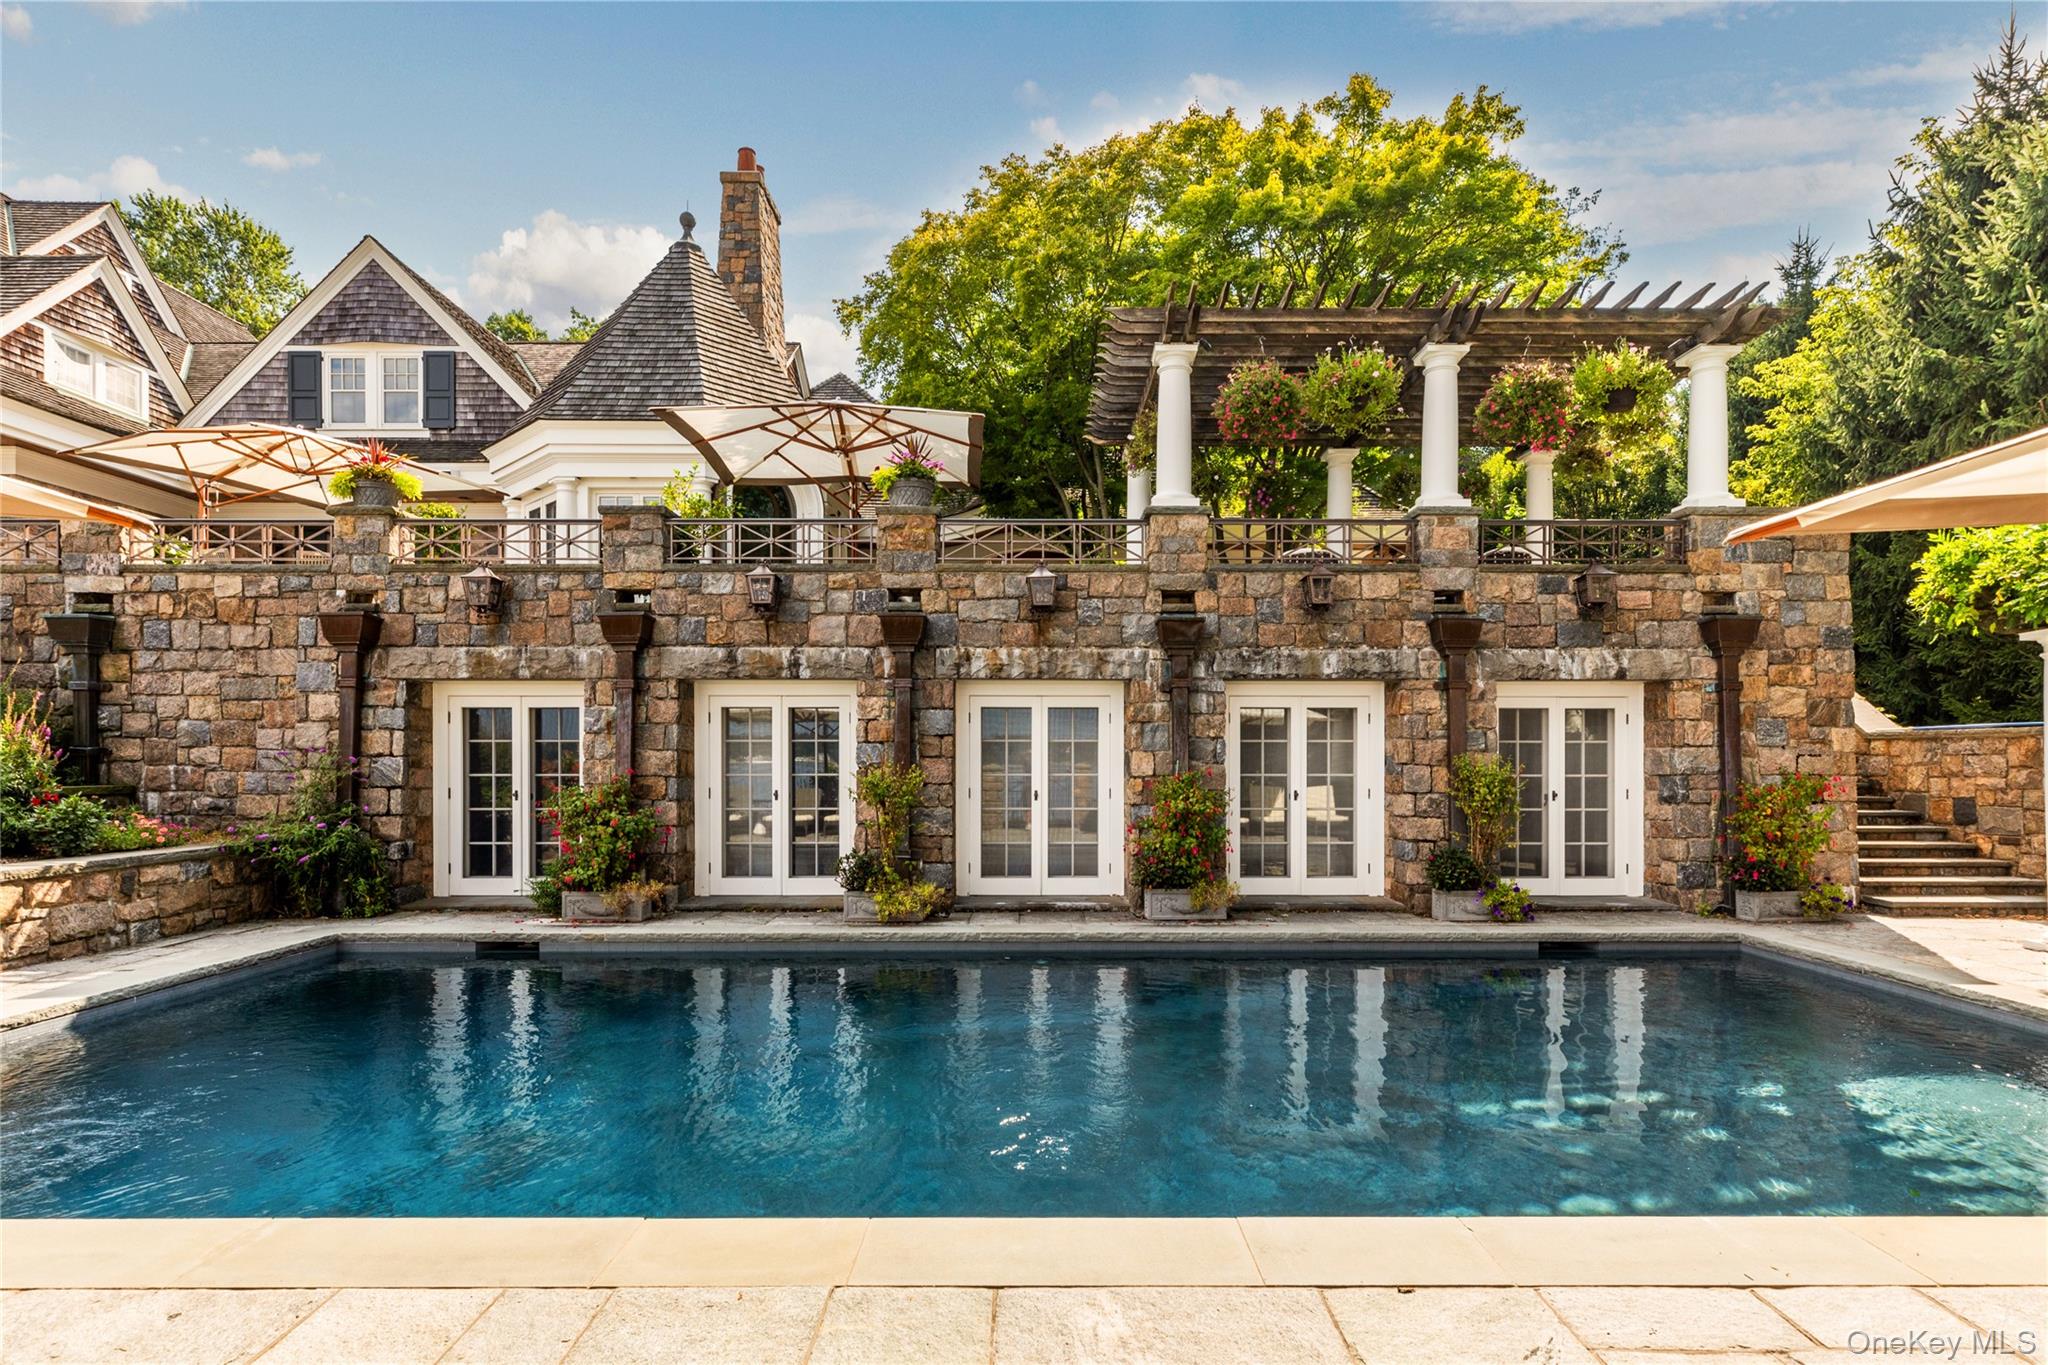
Swan Landing is a magnificent waterfront estate custom-designed by Shope Reno Wharton Associates to exemplify luxury at its highest level. Spanning approximately 23,000 square feet and nestled on 5.4 pristine acres on Long Island’s North Shore, this stone and shingle masterpiece offers 13 bedrooms and 14 bathrooms in a setting of unparalleled beauty and privacy. A long, tree-lined drive leads past sculpted boxwoods and Tuscan-style columns to the home’s striking facade. Inside, grand barrel ceilings and cove lighting guide you into two formal libraries - one clad in English oak, the other in mahogany - each centered around twin 18th-century fireplaces. The heart of the home, a great stair hall with arched windows and custom inlay flooring, leads into a formal living room with panoramic views of Manhasset Bay, curved window walls, circular columns, and refined finishes. The formal dining room features an antique fireplace, crystal chandelier, French doors, and exquisite custom millwork, flowing seamlessly to a stone patio overlooking the waterfront. The chef’s kitchen is outfitted with state-of-the-art appliances, a butler’s pantry, a two-level island, and custom cabinetry, while the adjacent octagonal breakfast room - with stained glass accents and five sets of French doors - blurs the line between indoor and outdoor living. Throughout the home, bespoke details abound, from padded and cloth walls to Tischler und Sohn windows, blending old-world elegance with modern comfort. The primary suite offers breathtaking water views, 12-foot ceilings, a sitting room, and two lavish ensuite baths, one a hand-tiled mosaic showpiece, the other rich in mahogany and emerald green marble. Two walk-in closets with dressing areas and a custom island add to the suite’s refined luxury. Additional amenities on the main level include a refrigerated wine room, antique powder room, a staff suite, and a gated elevator. Upstairs, two distinct guest wings offer seven bedrooms, five bathrooms, office space, a secondary laundry room, and a heated stone terrace. The lower level features an indoor saltwater lap pool with French doors to the outdoors, a gaming area, temperature-controlled wine cellar, and changing rooms. The estate grounds, designed by renowned landscape architect Peter Cummin, are a year-round sanctuary with Japanese maples, beech trees, and hydrangea-draped seawalls. Outdoor highlights include a romantic lily pond, English garden, greenhouse, custom pony house, waterfront Har-Tru tennis court, and a private dock and beach with East End-imported sand. An outdoor saltwater pool with slate patio and entertaining pavilion completes the main residence, while a separate two-bedroom, two-bath guest cottage offers additional accommodations. Grand in scale yet warm in feel, Swan Landing is a one-of-a-kind property where timeless architecture meets modern sophistication - an enduring estate that simply cannot be replicated.
Build Your Team
Quickly find investor-friendly professionals who can help you succeed in real estate investing at any stage of the investing journey.


Agents
Match with investor-friendly agents who can help you find, analyze, and close your next deal


Lenders
Get the best funding…find investor-friendly lenders who specialize in your deal strategy


Property Managers
Transition to passive investing. Find a trusted property management partnership that lasts.


Tax Pros & Accountants
Taxes and financial reporting made easy—find experts to create tax savings strategies, file taxes, and more
Location
Property Details
Parking
- Description: Garage
- Details: Attached, Garage Door Opener, Private
- Garage Spaces: 3
- Spaces Total: 0
Bedroom Information
- # of Bedrooms: 13
Bathroom Information
- # of Baths (Full): 10
- # of Baths (Partial): 0
- # of Baths (Total): 14.0
Interior Features
- # of Rooms: 19
- # of Stories: 2
- Basement: Yes
- Basement Description: Walk-Out Access, Finished, Full
- Fireplace: Yes
Exterior Features
- Exterior Walls Materials: Masonry
- Pool: Yes
Land Information
- Land Use: Residential
- Land Use Subtype: Single Family Residential
Lot Information
- Parcel ID: 01196000031
- Lot Size: 235224 sqft
Property Information
- Property Type: Single Family Residence
- Style: Colonial
- Year Built: 1995
Tax Information
- Annual Tax: $242,378
Utilities
- Water & Sewer: Public
- Heating: Forced Air, Natural Gas
- Cooling: Central Air
Location
- County: Nassau
Listing Details
Investment Summary
- Monthly Cash Flow
- -$191,726
- Cap Rate
- -0.5%
- Cash-on-Cash Return
- -28.6%
- Debt Coverage Ratio
- -0.08
- Internal Rate of Return (5 years)
- -23.5%
Cash Flow
Net Operating Income (NOI) minus mortgage payments.
Calculation:
NOI - Mortgage Payments
Cap Rate (Market Value)
Capitalization Rate is a rate of return that compares the yearly Net Operating Income (NOI) to the market value.
Calculation:
NOI / Market Value
Cash-on-Cash Return (CoC)
Annual Cash Flow / Cash Invested
Calculation:
Annual cash flow divided by initial cash invested.
Debt Coverage Ratio (DCR)
Net Operating Income (NOI) divided by total debt payments.
Calculation:
NOI / Total Debt Payments
Internal Rate of Return (IRR)
A metric for assessing profitability over time. IRR is the discount rate at which the net present value (NPV) of all future cash flows (positive and negative) from an investment equals zero — including both periodic cash flow (such as rent) and a projected sale at the end of the holding period. It represents the expected annualized return, accounting for income, expenses, and the recovery of capital through a future sale.
Purchase Details
Purchase PriceThe price paid for the property. Purchase price:
| $35,000,000 |
|---|---|
Amount FinancedThe amount of the purchase financed through a loan. Amount financed:
| -$28,000,000 |
Down paymentThe initial payment made towards the purchase. Down payment:
| $7,000,000 |
Closing CostsFees and expenses associated with purchasing a property, typically ranging from 2% to 5% of the home’s purchase price, paid at the end of a home purchase to cover services like lending, title transfer, and taxes. Closing costs:
| $1,050,000 |
Rehab CostsCosts incurred to repair or improve the property, including: roof, flooring, exterior siding, kitchen, exterior paint, bathrooms, etc. Rehab costs:
| $0 |
Initial Cash InvestedThe total initial cash invested in the property. Calculation:Down payment + Buying costs + Rehab costs Initial cash invested:
| $8,050,000 |
Square Feet (SQFT)The total square footage of the property. Square feet:
| 23,000 |
Cost Per Square FootCost per square foot of the property. Calculation:Purchase Price / Square Feet Cost per square foot:
| $1,522 |
Monthly Rent Per Square FootMonthly rent divided by the number of square feet. This ratio helps investors compare rental income efficiency across properties, markets, and unit sizes Calculation:Monthly Rent / Square Feet Monthly rent per square foot:
| $0.34 |
Financing Details
Loan AmountThe total sum of money borrowed from a lender to finance a property purchase. Calculation:Purchase Price - Down Payment
Loan amount:
| $28,000,000 |
|---|---|
Loan to Value Ratio (LTV)Loan amount divided by the market value of the property. Calculation:Loan Amount / Market Value
Loan to value ratio:
| 80.0% |
Loan TypeThe type of loan (e.g., fixed, adjustable).
Loan type:
| Amortizing |
TermThe loan repayment period in years.
Term:
| 30 years |
Interest RateThe percentage a lender charges on the borrowed amount of a loan, determining the cost of borrowing money.
Interest rate:
| 6.500% |
Principal & Interest (PI)The principal is the portion of the loan payment that reduces the loan balance. The interest is the lender's charge for borrowing money. Calculation:(P * r * (1 + r) ** n) / ((1 + r) ** n - 1) Where:
P = Loan amount (principal)
Principal & interest:
| $176,979 |
Property TaxesAnnual taxes levied by local governments on real estate properties. These taxes fund public services like schools, roads, and emergency services.
Property tax:
| $20,198 |
InsuranceThe costs for insurance coverage to protect against financial losses due to risks like fire, natural disasters, theft, liability, or tenant-related damages. Calculation:Assumes 7% of gross rental income, unless insurance rates are specified.
Insurance:
| $553 |
Private Mortgage Insurance (PMI)A fee that borrowers pay when they take out a conventional loan with a loan-to-value (LTV) ratio above 80%.
Private mortgage insurance (PMI):
| $0 |
Monthly PaymentThe fixed amount a borrower pays each month to repay a loan. It typically includes principal and interest (P&I) and may also cover property taxes, insurance, HOA fees, and PMI if escrowed. Monthly payment:
| $197,730 |
Operating Income
| % Rent | Monthly | Yearly | |
|---|---|---|---|
Gross RentThe total rental income received from tenants before deducting any expenses. Includes base rent, late fees, pet fees, parking fees, and other recurring charges.
Gross rent:
| $7,900 | $94,800 | |
Vacancy LossExpected loss of rent due to vacancies.
Vacancy loss:
(6%)
| 6% | -$474 | -$5,688 |
Operating IncomeGross rental income minus vacancy loss. Calculation:Gross rent - Vacancy loss
Operating income:
| $7,426 | $89,112 |
Operating Expenses
| % Rent | Monthly | Yearly | |
|---|---|---|---|
Property TaxesAnnual taxes levied by local governments on real estate properties. These taxes fund public services like schools, roads, and emergency services. | 256% | -$20,198 | -$242,379 |
InsuranceThe costs for insurance coverage to protect against financial losses due to risks like fire, natural disasters, theft, liability, or tenant-related damages. Calculation:Assumes 7% of gross rental income, unless insurance rates are specified. | 7% | -$553 | -$6,636 |
Property ManagementThe costs associated with hiring a property manager to handle the day-to-day operations of a rental property. Includes management fees, leasing fes, eviction fees, etc. Calculation:Assumes 8% of gross rental income. | 8% | -$632 | -$7,584 |
Repairs & MaintenanceOngoing costs for routine upkeep and minor fixes needed to keep a property in good working condition. Calculation:Assumes 5% of gross rental income. Varies by property age and condition. | 5% | -$395 | -$4,740 |
Capital ExpensesLarge, infrequent costs for major improvements or replacements, like a new roof, HVAC system, or appliances. Calculation:Assumes 5% of gross rental income. Varies by property age. | 5% | -$395 | -$4,740 |
HOA FeesRegular dues paid to a Homeowners Association for community maintenance, amenities, and management. Similar fees include: Condo Association Fees, Co-op Maintenance Fees, etc. | n/a | n/a | n/a |
Operating ExpensesRecurring costs required to maintain and manage a rental property, including property taxes, insurance, maintenance, repairs, utilities (if paid by the owner), property management fees, and other day-to-day expenses. Calculation:Insurance + Property Taxes + Property Management + Repairs & Maintenance + Capital Expenditures + HOA Fees | 281% | -$22,173 | -$266,079 |
Cash Flow
| Monthly | Yearly | |
|---|---|---|
Net Operating Income (NOI)The income generated from a property after deducting all operating expenses but before deducting mortgage payments, taxes, and capital expenditures. Calculation:Gross Operating Income - Operating Expenses
Net operating income:
| -$14,747 | -$176,964 |
Mortgage PaymentThe fixed amount a borrower pays each month to repay a loan. It typically includes principal and interest (P&I) and may also cover property taxes, insurance, HOA fees, and PMI if escrowed. | -$176,979 | -$2,123,748 |
Cash FlowNet Operating Income (NOI) minus mortgage payments. Calculation:NOI - Mortgage Payments | -$191,726 | -$2,300,712 |