
$469,900
Investment Summary
- Monthly Cash Flow
- -$680
- Cap Rate
- 4.5%
- Cash-on-Cash Return
- -7.6%
- Debt Coverage Ratio
- 0.72
- Internal Rate of Return (5 years)
- -3.3%
Cash Flow
Net Operating Income (NOI) minus mortgage payments.
Calculation:
NOI - Mortgage Payments
Cap Rate (Market Value)
Capitalization Rate is a rate of return that compares the yearly Net Operating Income (NOI) to the market value.
Calculation:
NOI / Market Value
Cash-on-Cash Return (CoC)
Annual Cash Flow / Cash Invested
Calculation:
Annual cash flow divided by initial cash invested.
Debt Coverage Ratio (DCR)
Net Operating Income (NOI) divided by total debt payments.
Calculation:
NOI / Total Debt Payments
Internal Rate of Return (IRR)
A metric for assessing profitability over time. IRR is the discount rate at which the net present value (NPV) of all future cash flows (positive and negative) from an investment equals zero — including both periodic cash flow (such as rent) and a projected sale at the end of the holding period. It represents the expected annualized return, accounting for income, expenses, and the recovery of capital through a future sale.
Property Description
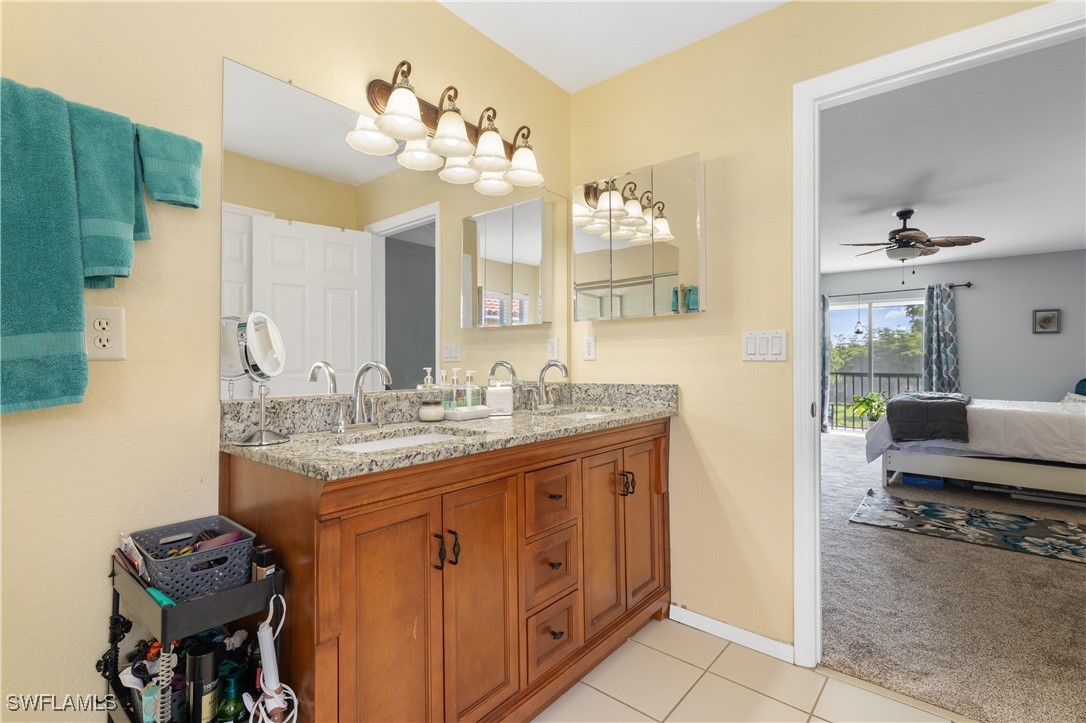
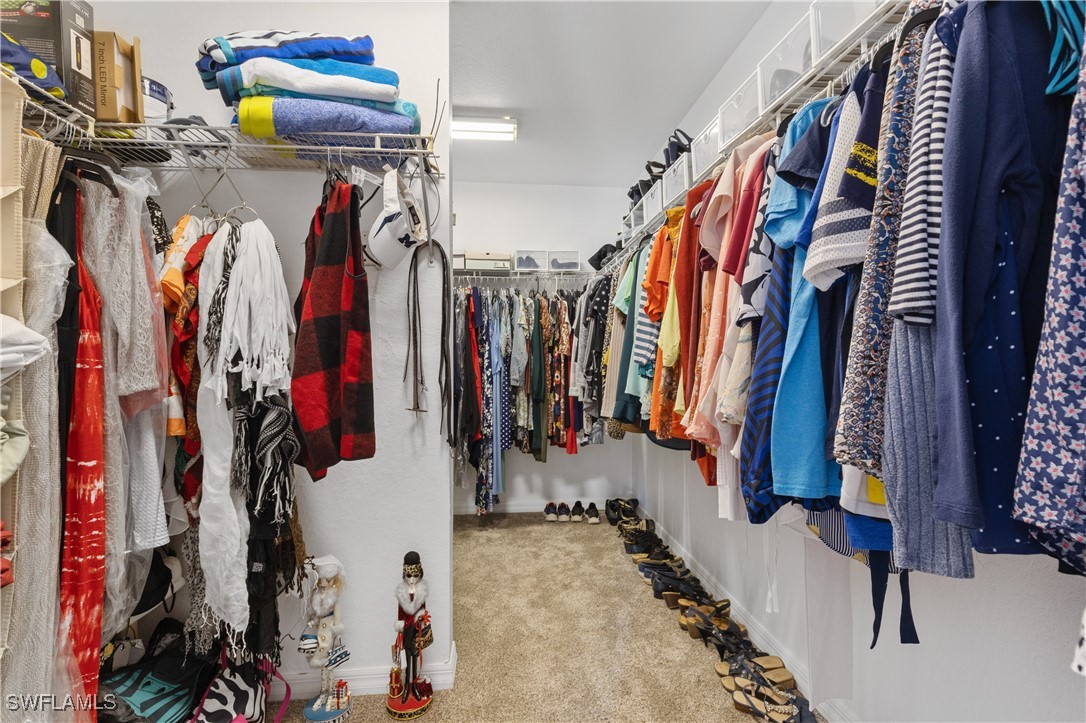
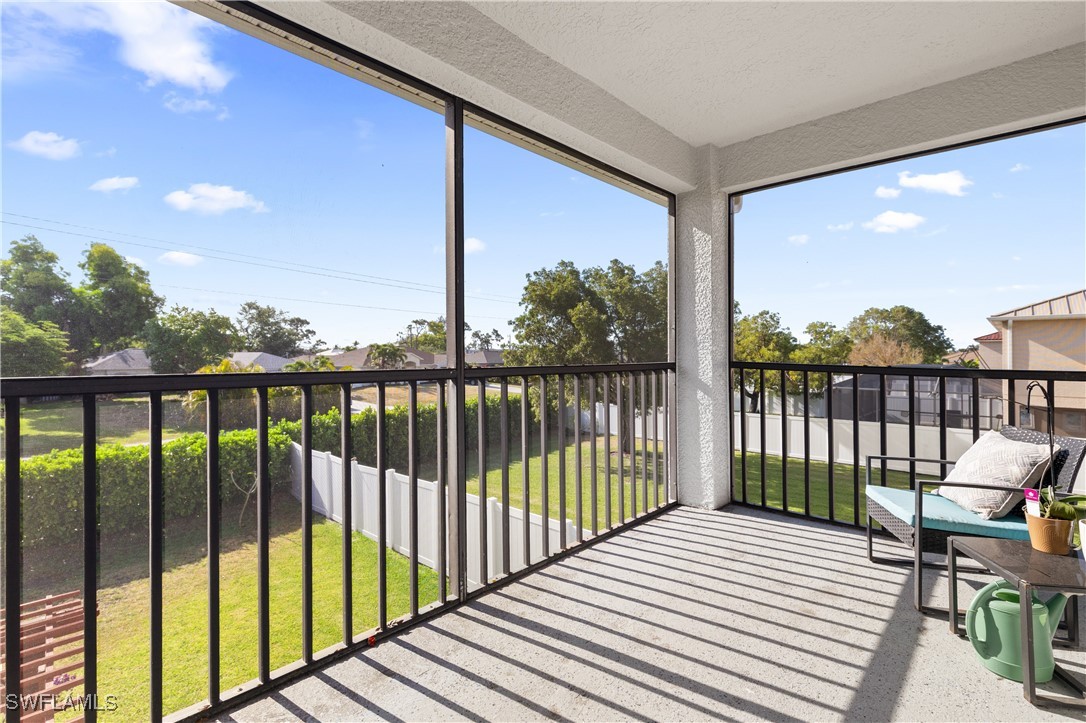
This beautifully maintained home offers the ideal layout for large families or anyone in need of a separate living space for guests or extended family. A huge home with 3,256 SQUARE FEET, FIVE BEDROOMS, 3 FULL BATHS & a HALF BATH downstairs for guests. Come through the double-door entry to a grand living room & a beautiful wood staircase leading to the upper level. It is an open-concept layout excellent for entertaining. The expansive kitchen boasts white raised-panel cabinetry, granite countertops with a 14-foot breakfast bar, a pantry & stainless steel appliances including a self-cleaning oven, refrigerator with ice maker, dishwasher & a brand-new microwave. Adjacent to the kitchen is a large dining & sitting area, offering plenty of space for gathering. The first floor includes two generously sized bedrooms with a full bath in between, ideal as a private in-law or guest suite, plus a powder room for visitors & an interior laundry room with a full-size washer & dryer included. Brand-new tile floors have been installed throughout the entire lower level for a fresh, modern feel. Upstairs, you’ll find an additional living area, perfect for a den, game room, or media space. Also, two more guest bedrooms & a spacious primary suite. The luxurious owner's retreat features a massive closet, a spa-like bathroom with 2 sinks, a soaking tub & a large shower. Enjoy the weather on the screened-in balcony, accessible from both the primary suite & upstairs living area. The 2 large guest bedrooms on the second level share a full bathroom with a granite countertop vanity & 2 sinks. All three bedrooms in the second level are carpeted, the bonus area has hardwood flooring & tile in the bathrooms. There is a spacious backyard with a privacy fence, perfect for relaxing, entertaining, or letting pets & kids play freely. Unwind beneath a built in charming pergola. The screened lanai seamlessly blends indoor comfort with outdoor living. Other features include a new metal roof 2023, new windows, a keyless front entry, walk-in closets in 4 of 5 bedrooms, a 2-car garage with key and code entry, a new garage door opener & tracks, a new garbage disposal, a fenced backyard, 2 AC units 2019 (one for the lower level, one for the second level), 2017 water heater, recessed * upgraded lighting, fresh interior & exterior paint, new 5” baseboards on the lower level, surge protectors on both ACs & electric panel, gutters all of the way around the home. Heatherwood Lakes is a gated community with a swimming pool, clubhouse, playground, 5 lakes & community events throughout the year. This home is not in a flood zone. It is conveniently located with Trafalgar elementary & middle schools just around the corner. Shops at Surfside with multiple restaurants, Starbucks, Belk, professional services & a weekly farmer’s market is just 1 mile away. The 5 mile trail from Veterans Memorial Bridge to Burnt Store Rd is just a quarter mile away for biking or walking.
Build Your Team
Quickly find investor-friendly professionals who can help you succeed in real estate investing at any stage of the investing journey.


Agents
Match with investor-friendly agents who can help you find, analyze, and close your next deal


Lenders
Get the best funding…find investor-friendly lenders who specialize in your deal strategy


Property Managers
Transition to passive investing. Find a trusted property management partnership that lasts.


Tax Pros & Accountants
Taxes and financial reporting made easy—find experts to create tax savings strategies, file taxes, and more
Location
Property Details
Parking
- Description: Garage
- Details: Attached, Garage, Garage Door Opener
- Garage Spaces: 2
- Spaces Total: 0
Bedroom Information
- # of Bedrooms: 5
Bathroom Information
- # of Baths (Full): 3
- # of Baths (Total): 4.0
Interior Features
- # of Stories: 2
Exterior Features
- Exterior Walls Materials: Stucco
- Roof Type: IRR/Cathedral
- Roof Material: Metal
HOA
- Has HOA: Yes
- Additional HOA Fee: $163/monthly
Land Information
- Land Use: Residential
- Land Use Subtype: Single Family Residential
Lot Information
- Parcel ID: 284423C100215.0180
- Lot Size: 0 sqft
Property Information
- Property Type: Single Family Residence
- Style: Two Story
- Year Built: 2005
Tax Information
- Annual Tax: $5,750
Utilities
- Water & Sewer: Public
- Heating: Central, Electric
- Cooling: Central Air, Ceiling Fan(s), Electric
Location
- County: Lee
Listing Details
Investment Summary
- Monthly Cash Flow
- -$680
- Cap Rate
- 4.5%
- Cash-on-Cash Return
- -7.6%
- Debt Coverage Ratio
- 0.72
- Internal Rate of Return (5 years)
- -3.3%
Cash Flow
Net Operating Income (NOI) minus mortgage payments.
Calculation:
NOI - Mortgage Payments
Cap Rate (Market Value)
Capitalization Rate is a rate of return that compares the yearly Net Operating Income (NOI) to the market value.
Calculation:
NOI / Market Value
Cash-on-Cash Return (CoC)
Annual Cash Flow / Cash Invested
Calculation:
Annual cash flow divided by initial cash invested.
Debt Coverage Ratio (DCR)
Net Operating Income (NOI) divided by total debt payments.
Calculation:
NOI / Total Debt Payments
Internal Rate of Return (IRR)
A metric for assessing profitability over time. IRR is the discount rate at which the net present value (NPV) of all future cash flows (positive and negative) from an investment equals zero — including both periodic cash flow (such as rent) and a projected sale at the end of the holding period. It represents the expected annualized return, accounting for income, expenses, and the recovery of capital through a future sale.
Purchase Details
Purchase PriceThe price paid for the property. Purchase price:
| $469,900 |
|---|---|
Amount FinancedThe amount of the purchase financed through a loan. Amount financed:
| -$375,920 |
Down paymentThe initial payment made towards the purchase. Down payment:
| $93,980 |
Closing CostsFees and expenses associated with purchasing a property, typically ranging from 2% to 5% of the home’s purchase price, paid at the end of a home purchase to cover services like lending, title transfer, and taxes. Closing costs:
| $14,097 |
Rehab CostsCosts incurred to repair or improve the property, including: roof, flooring, exterior siding, kitchen, exterior paint, bathrooms, etc. Rehab costs:
| $0 |
Initial Cash InvestedThe total initial cash invested in the property. Calculation:Down payment + Buying costs + Rehab costs Initial cash invested:
| $108,077 |
Square Feet (SQFT)The total square footage of the property. Square feet:
| 3,256 |
Cost Per Square FootCost per square foot of the property. Calculation:Purchase Price / Square Feet Cost per square foot:
| $144 |
Monthly Rent Per Square FootMonthly rent divided by the number of square feet. This ratio helps investors compare rental income efficiency across properties, markets, and unit sizes Calculation:Monthly Rent / Square Feet Monthly rent per square foot:
| $1.07 |
Financing Details
Loan AmountThe total sum of money borrowed from a lender to finance a property purchase. Calculation:Purchase Price - Down Payment
Loan amount:
| $375,920 |
|---|---|
Loan to Value Ratio (LTV)Loan amount divided by the market value of the property. Calculation:Loan Amount / Market Value
Loan to value ratio:
| 80.0% |
Loan TypeThe type of loan (e.g., fixed, adjustable).
Loan type:
| Amortizing |
TermThe loan repayment period in years.
Term:
| 30 years |
Interest RateThe percentage a lender charges on the borrowed amount of a loan, determining the cost of borrowing money.
Interest rate:
| 6.810% |
Principal & Interest (PI)The principal is the portion of the loan payment that reduces the loan balance. The interest is the lender's charge for borrowing money. Calculation:(P * r * (1 + r) ** n) / ((1 + r) ** n - 1) Where:
P = Loan amount (principal)
Principal & interest:
| $2,453 |
Property TaxesAnnual taxes levied by local governments on real estate properties. These taxes fund public services like schools, roads, and emergency services.
Property tax:
| $479 |
InsuranceThe costs for insurance coverage to protect against financial losses due to risks like fire, natural disasters, theft, liability, or tenant-related damages. Calculation:Assumes 7% of gross rental income, unless insurance rates are specified.
Insurance:
| $245 |
Private Mortgage Insurance (PMI)A fee that borrowers pay when they take out a conventional loan with a loan-to-value (LTV) ratio above 80%.
Private mortgage insurance (PMI):
| $0 |
Monthly PaymentThe fixed amount a borrower pays each month to repay a loan. It typically includes principal and interest (P&I) and may also cover property taxes, insurance, HOA fees, and PMI if escrowed. Monthly payment:
| $3,177 |
Operating Income
| % Rent | Monthly | Yearly | |
|---|---|---|---|
Gross RentThe total rental income received from tenants before deducting any expenses. Includes base rent, late fees, pet fees, parking fees, and other recurring charges.
Gross rent:
| $3,500 | $42,000 | |
Vacancy LossExpected loss of rent due to vacancies.
Vacancy loss:
(6%)
| 6% | -$210 | -$2,520 |
Operating IncomeGross rental income minus vacancy loss. Calculation:Gross rent - Vacancy loss
Operating income:
| $3,290 | $39,480 |
Operating Expenses
| % Rent | Monthly | Yearly | |
|---|---|---|---|
Property TaxesAnnual taxes levied by local governments on real estate properties. These taxes fund public services like schools, roads, and emergency services. | 14% | -$479 | -$5,751 |
InsuranceThe costs for insurance coverage to protect against financial losses due to risks like fire, natural disasters, theft, liability, or tenant-related damages. Calculation:Assumes 7% of gross rental income, unless insurance rates are specified. | 7% | -$245 | -$2,940 |
Property ManagementThe costs associated with hiring a property manager to handle the day-to-day operations of a rental property. Includes management fees, leasing fes, eviction fees, etc. Calculation:Assumes 8% of gross rental income. | 8% | -$280 | -$3,360 |
Repairs & MaintenanceOngoing costs for routine upkeep and minor fixes needed to keep a property in good working condition. Calculation:Assumes 5% of gross rental income. Varies by property age and condition. | 5% | -$175 | -$2,100 |
Capital ExpensesLarge, infrequent costs for major improvements or replacements, like a new roof, HVAC system, or appliances. Calculation:Assumes 5% of gross rental income. Varies by property age. | 5% | -$175 | -$2,100 |
HOA FeesRegular dues paid to a Homeowners Association for community maintenance, amenities, and management. Similar fees include: Condo Association Fees, Co-op Maintenance Fees, etc. | 5% | -$163 | -$1,956 |
Operating ExpensesRecurring costs required to maintain and manage a rental property, including property taxes, insurance, maintenance, repairs, utilities (if paid by the owner), property management fees, and other day-to-day expenses. Calculation:Insurance + Property Taxes + Property Management + Repairs & Maintenance + Capital Expenditures + HOA Fees | 43% | -$1,517 | -$18,207 |
Cash Flow
| Monthly | Yearly | |
|---|---|---|
Net Operating Income (NOI)The income generated from a property after deducting all operating expenses but before deducting mortgage payments, taxes, and capital expenditures. Calculation:Gross Operating Income - Operating Expenses
Net operating income:
| $1,773 | $21,276 |
Mortgage PaymentThe fixed amount a borrower pays each month to repay a loan. It typically includes principal and interest (P&I) and may also cover property taxes, insurance, HOA fees, and PMI if escrowed. | -$2,453 | -$29,436 |
Cash FlowNet Operating Income (NOI) minus mortgage payments. Calculation:NOI - Mortgage Payments | $680 | $8,160 |