$559,900
Investment Summary
- Monthly Cash Flow
- -$1,107
- Cap Rate
- 3.8%
- Cash-on-Cash Return
- -10.3%
- Debt Coverage Ratio
- 0.61
- Internal Rate of Return (5 years)
- -6.0%
Cash Flow
Net Operating Income (NOI) minus mortgage payments.
Calculation:
NOI - Mortgage Payments
Cap Rate (Market Value)
Capitalization Rate is a rate of return that compares the yearly Net Operating Income (NOI) to the market value.
Calculation:
NOI / Market Value
Cash-on-Cash Return (CoC)
Annual Cash Flow / Cash Invested
Calculation:
Annual cash flow divided by initial cash invested.
Debt Coverage Ratio (DCR)
Net Operating Income (NOI) divided by total debt payments.
Calculation:
NOI / Total Debt Payments
Internal Rate of Return (IRR)
A metric for assessing profitability over time. IRR is the discount rate at which the net present value (NPV) of all future cash flows (positive and negative) from an investment equals zero — including both periodic cash flow (such as rent) and a projected sale at the end of the holding period. It represents the expected annualized return, accounting for income, expenses, and the recovery of capital through a future sale.
Property Description
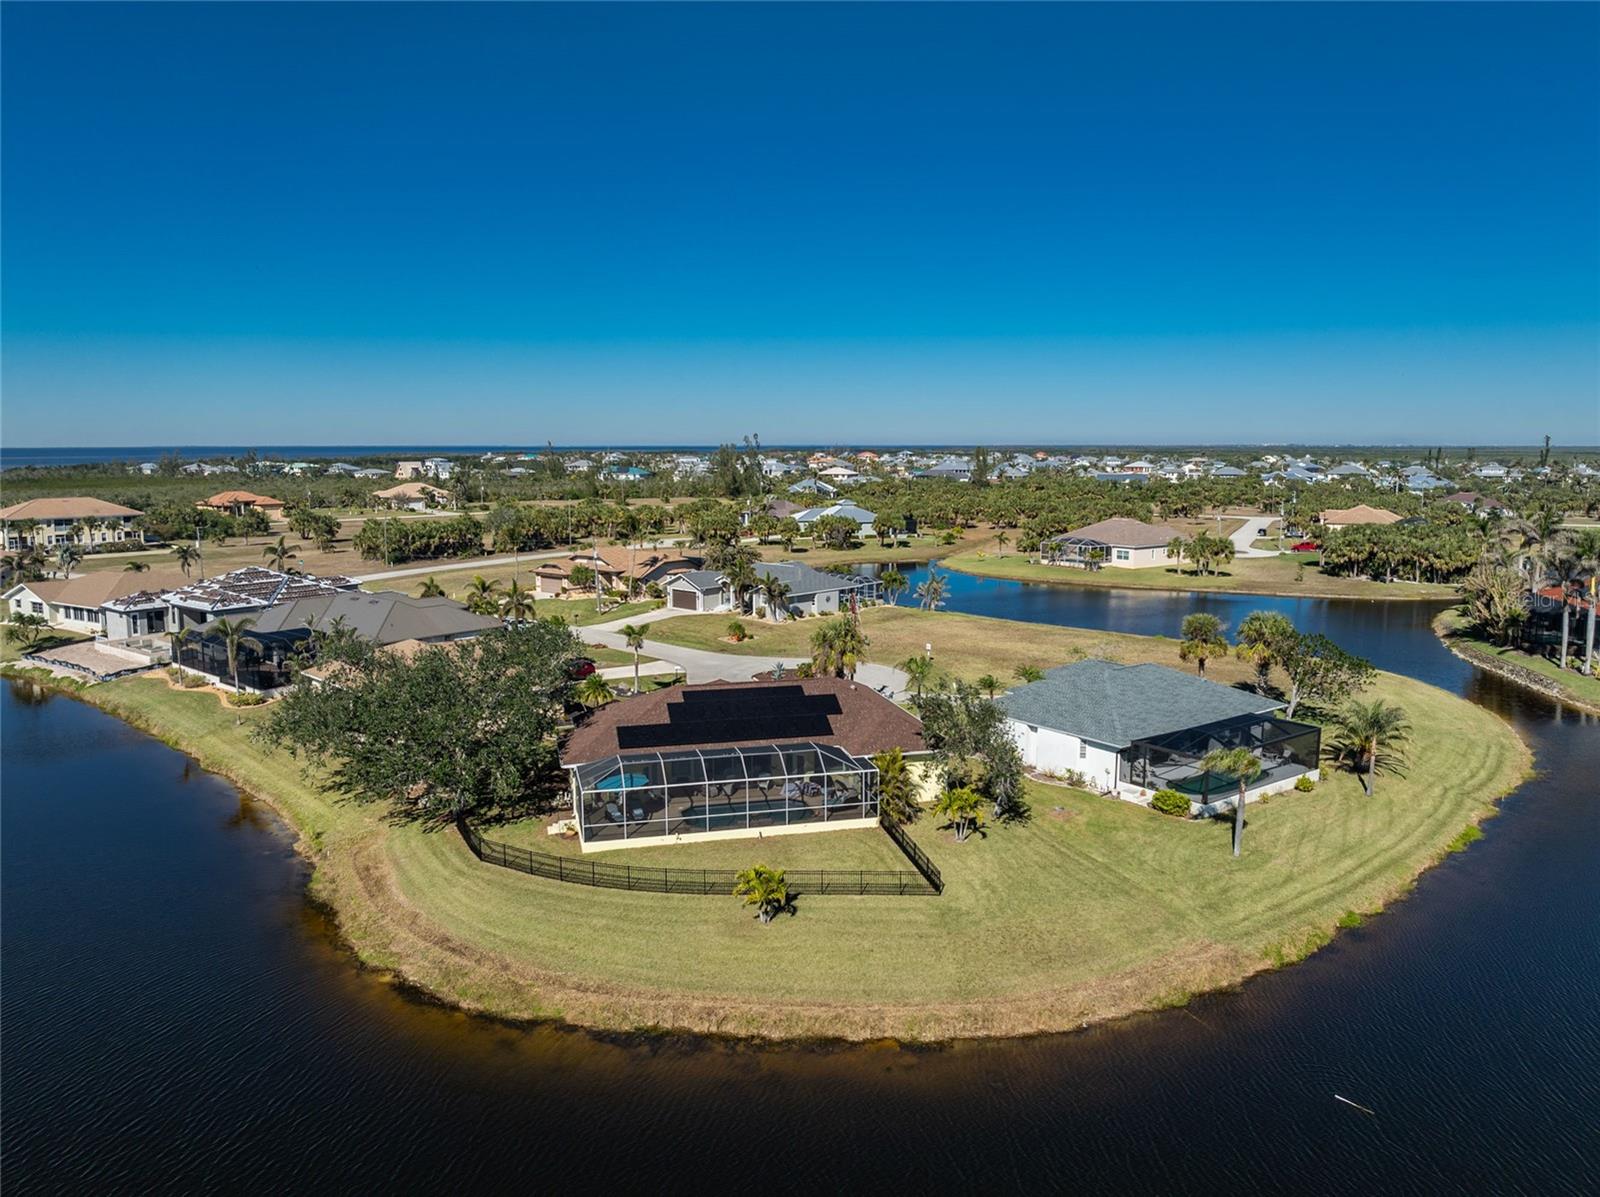
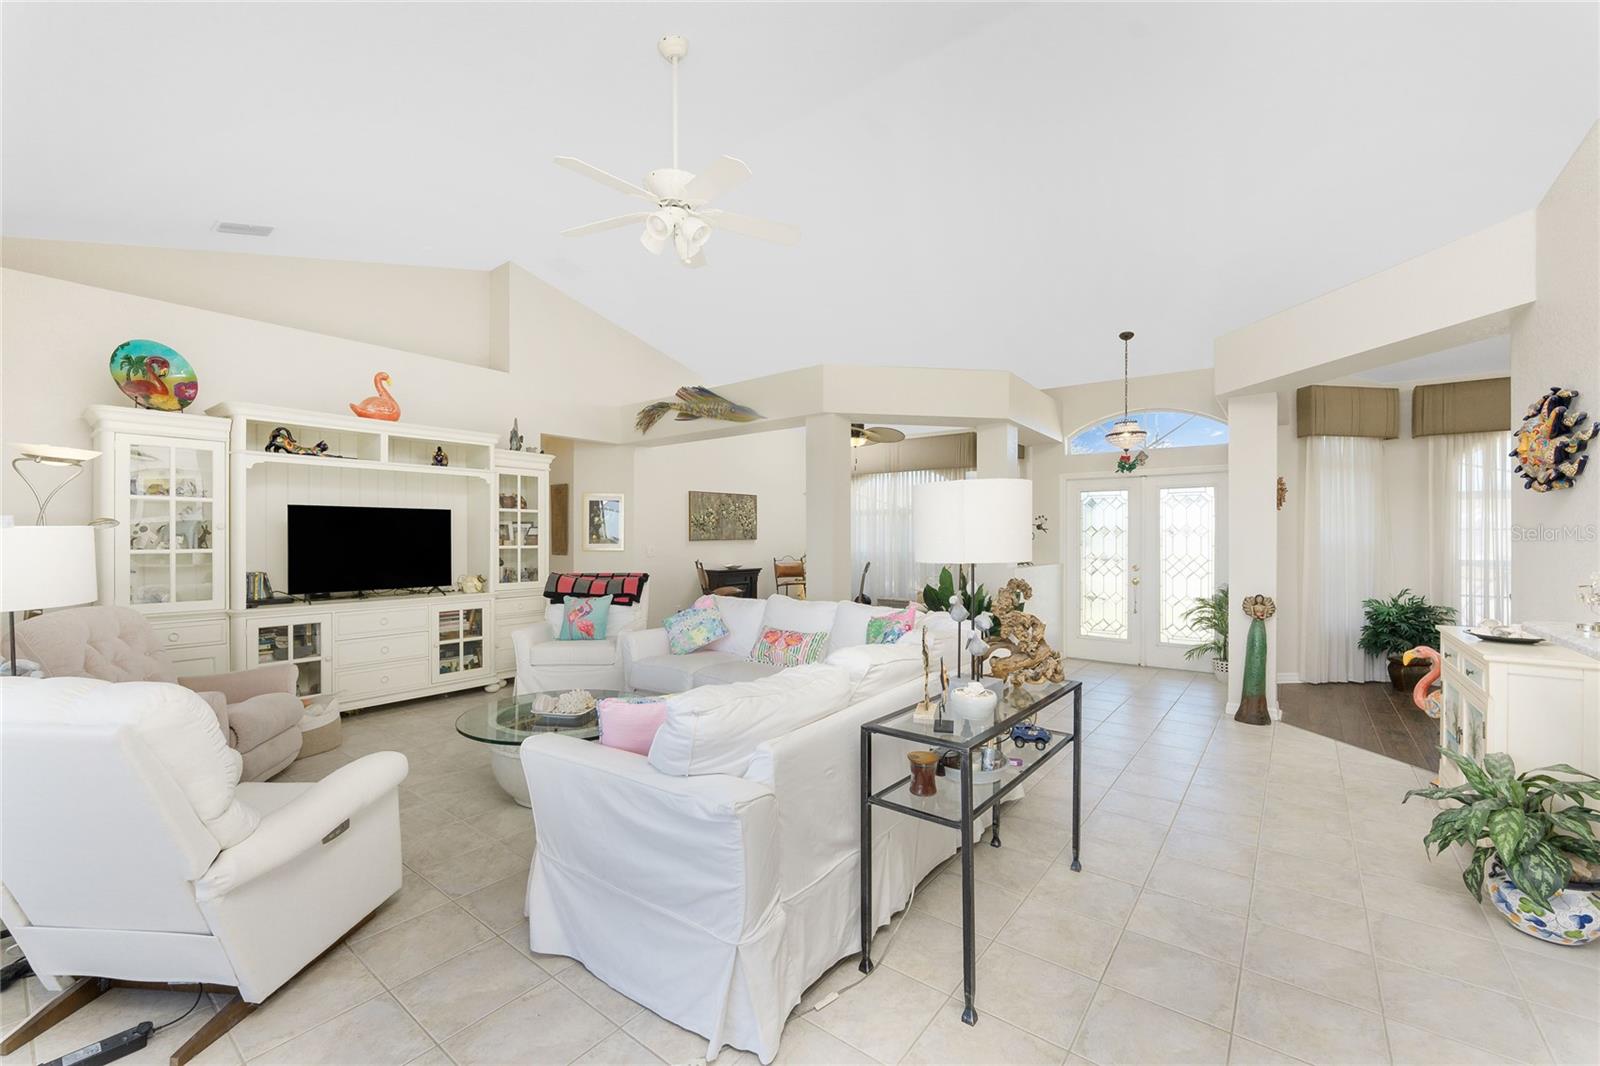
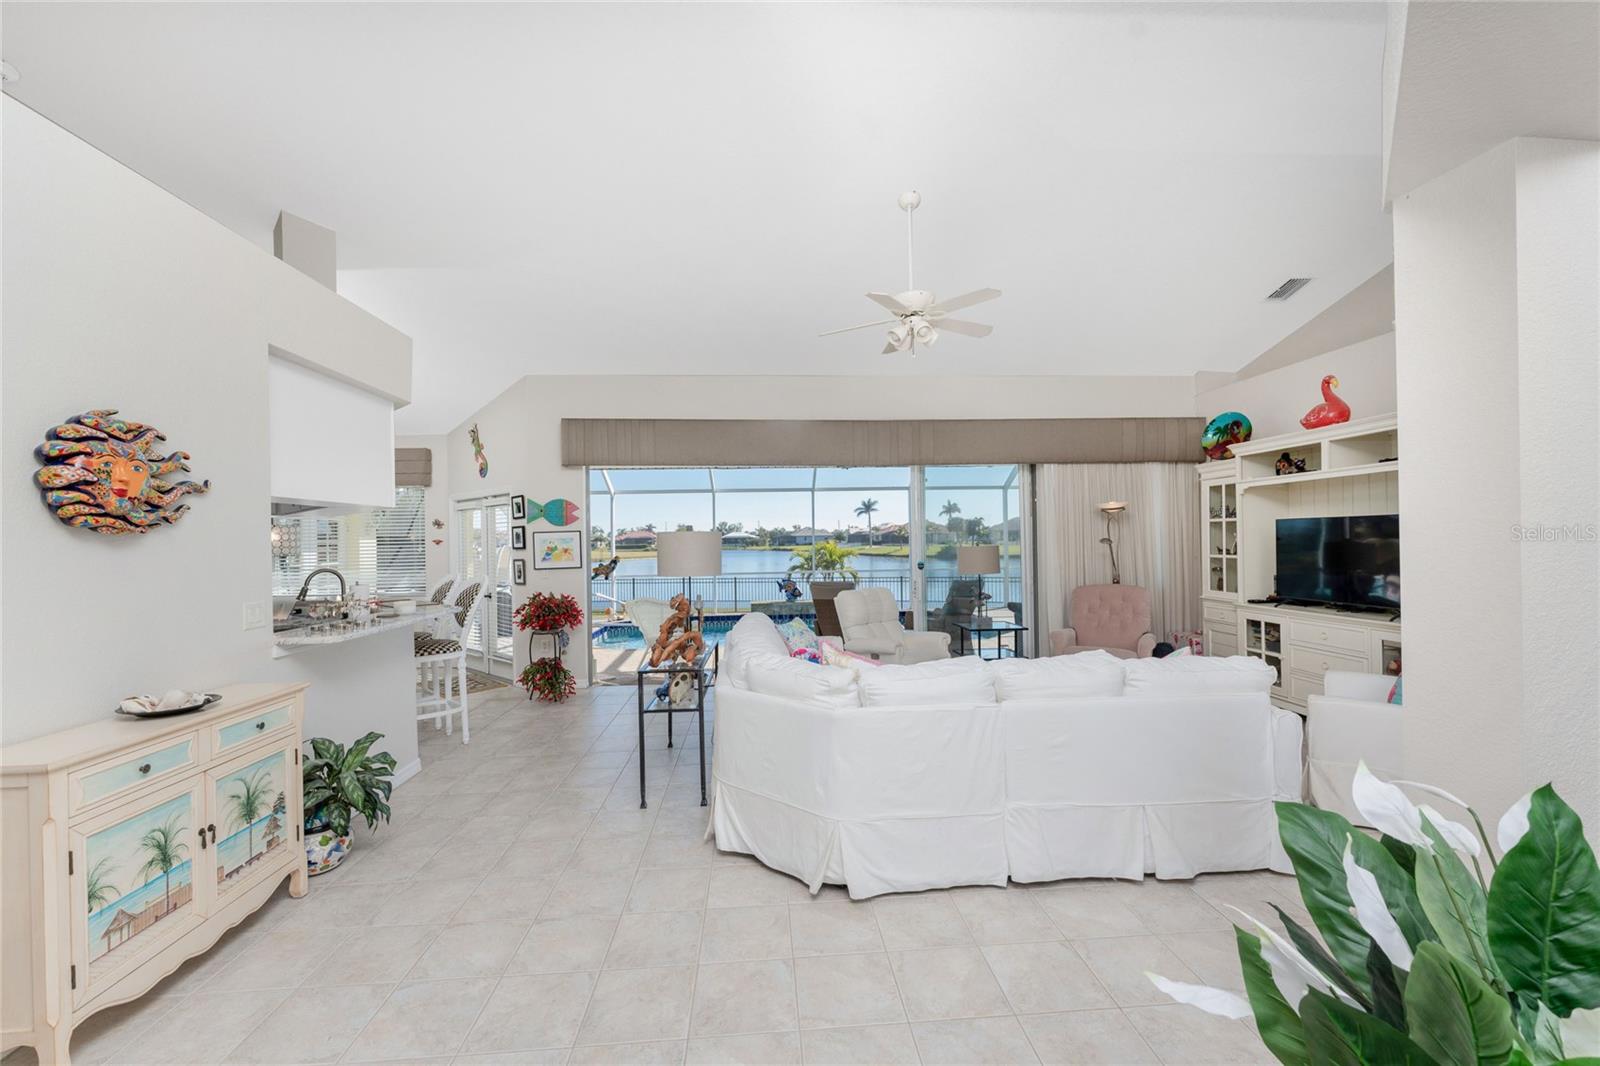
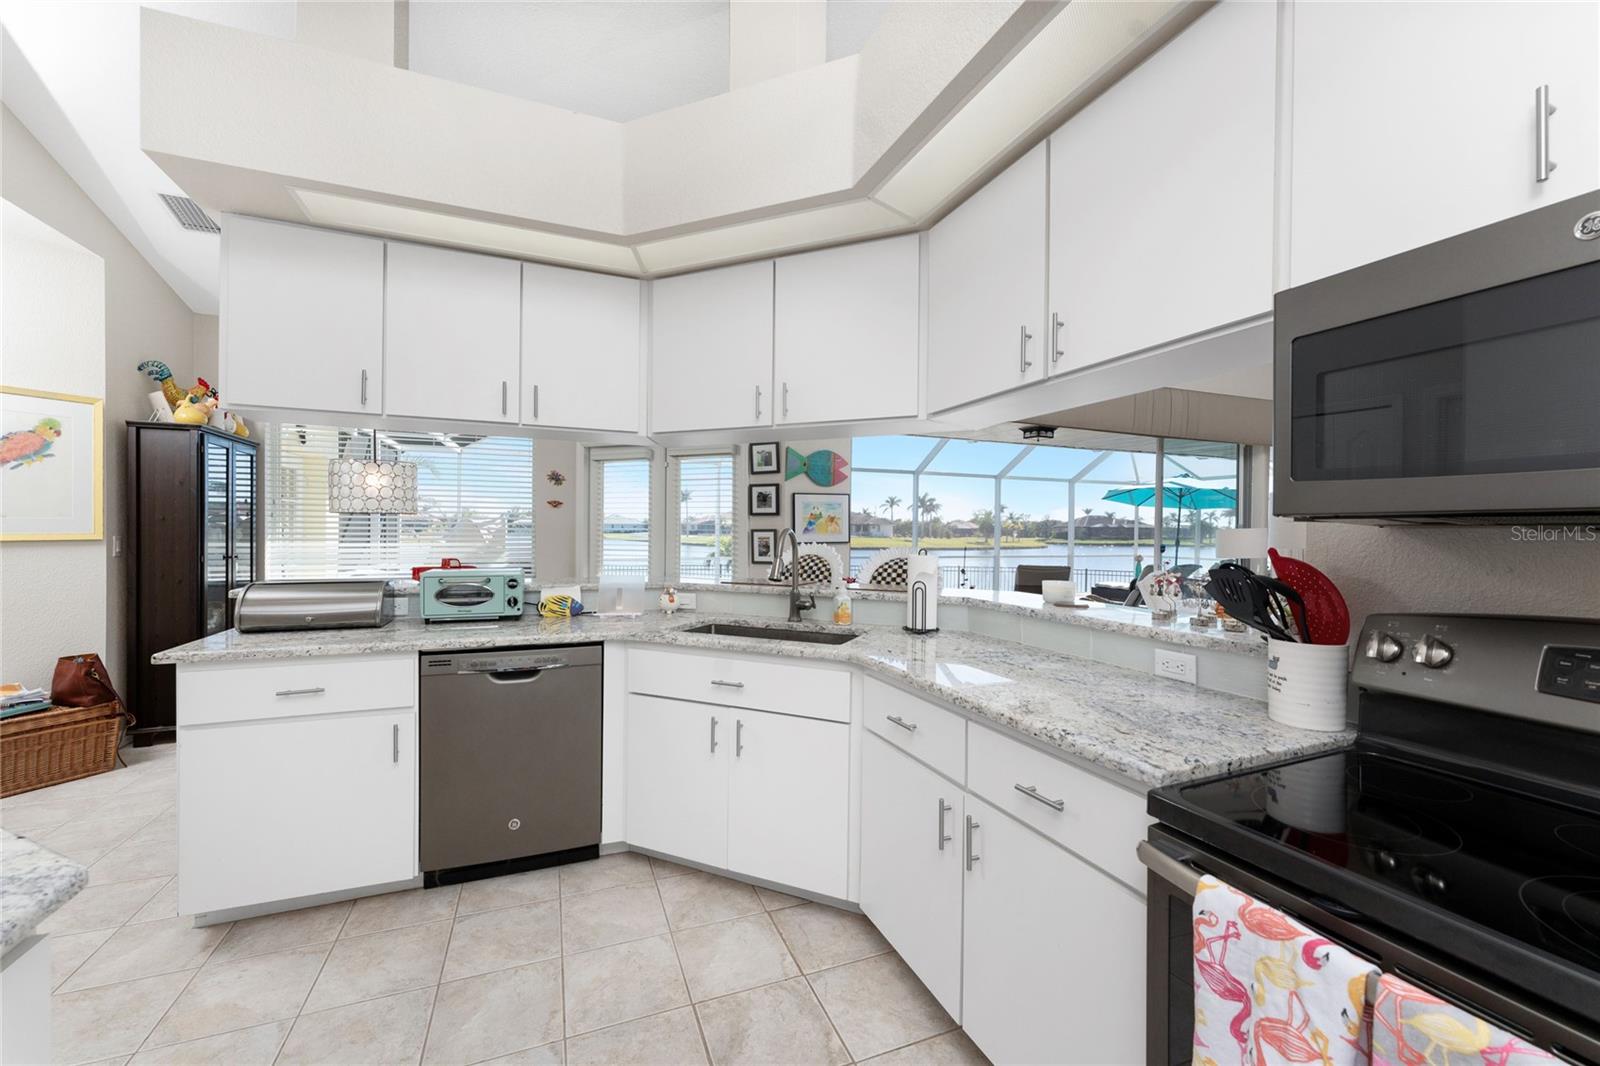
Embrace serene lakefront living with this stunning 3-bedroom, 2-bathroom heated pool home, perfectly positioned at the end of a peaceful cul-de-sac in the desirable, deed-restricted community of Burnt Store Lakes. With breathtaking panoramic lake views, this exceptional tip lot property offers the ultimate in tranquility and privacy. Start your day with a brilliant sunrise over the lake, and wind down with picturesque sunsets, all from the expansive southeastern-facing pool deck. The perfect way to relax or entertain while taking in the sights of the local wildlife. With sliding doors that open from the generous great room to the outdoor space, you’ll enjoy seamless indoor-outdoor living in this true tropical oasis. Inside, the open floor plan combines a spacious great room, dining area, and den with high ceilings and tile floors throughout, making it an ideal space for gatherings or quiet moments of relaxation. The kitchen features elegant stone countertops, stainless steel appliances, a deep pantry, breakfast bar and deep sink. French doors from the dinette area lead to the lanai, where you can enjoy meals and lounge by the pool. The home also features a dedicated laundry room with 3 month old Maytag washer and dryer, as well as ample storage space. The Primary suite is a true retreat, with two walk-in closets, a beautiful bath featuring separate tub and shower, dual pedestal sinks, and plantation shutters. You'll enjoy relaxing in this peaceful space, surrounded by lush views. The guest bedrooms are generously sized with large closets, offering comfort and convenience for family or guests. The guest bath features a combination tub and shower with a high top vanity. Recent updates include a 3 year old roof, pool resurfacing with attractive pebble rock finish and waterfall, a fenced rear yard, recently replaced pool pump, electrical wiring for a generator, and freshly painted exterior paint make the home both functional and stylish. This home also features an assumable whole house solar power system. Burnt Store Lakes is a beautiful Deed Restricted Community with 11 freshwater lakes and many new custom homes being built throughout the neighborhood. Public water and sewer are in place. Burnt Store Lakes Residents enjoy the Community Park which has covered picnic benches, a playground and restrooms. There is a kayak ramp for Residents only that accesses Charlotte Harbor and the incredible wildlife in the Charlotte Harbor Aquatic Preserve such as Manatees, porpoises, sea turtles and an abundance of game fish. Next door at Burnt Store Marina, SW Florida’s full-service deep-water marina, restaurants are open to the public and amenities such as golf and boat dockage may be available. It’s just a short drive to Downtown Punta Gorda, one of Florida’s best small towns, with plenty of restaurants and town activities to enjoy. Or to Cape Coral, one of the fastest growing cities in Florida. It doesn’t get any better than this to live your dream Florida Lifestyle.
Build Your Team
Quickly find investor-friendly professionals who can help you succeed in real estate investing at any stage of the investing journey.


Agents
Match with investor-friendly agents who can help you find, analyze, and close your next deal


Lenders
Get the best funding…find investor-friendly lenders who specialize in your deal strategy


Property Managers
Transition to passive investing. Find a trusted property management partnership that lasts.


Tax Pros & Accountants
Taxes and financial reporting made easy—find experts to create tax savings strategies, file taxes, and more
Location
Property Details
Parking
- Description: Garage Door Opener
- Details: Garage Door Opener, Attached
- Garage Spaces: 2
- Spaces Total: 0
Bedroom Information
- # of Bedrooms: 3
Bathroom Information
- # of Baths (Full): 2
- # of Baths (Total): 2.0
Interior Features
- # of Rooms: 10
- # of Stories: 1
Exterior Features
- Exterior Walls Materials: Concrete Block
- Foundation: Slab
- Roof Material: Shingle
- Pool: Yes
HOA
- Has HOA: Yes
- Association: Burnt Store Lakes Property Owners' Association
- HOA Fee: $494/annually
Land Information
- Land Use: Residential
- Land Use Subtype: Single Family Residential
Lot Information
- Parcel ID: 422330251008
- Lot Size: 12611 sqft
Property Information
- Property Type: Single Family Residence
- Style: Florida
- Year Built: 2002
Tax Information
- Annual Tax: $7,351
Utilities
- Water & Sewer: Public
- Heating: Central, Electric
- Cooling: Central Air
Location
- County: Charlotte
Listing Details
Investment Summary
- Monthly Cash Flow
- -$1,107
- Cap Rate
- 3.8%
- Cash-on-Cash Return
- -10.3%
- Debt Coverage Ratio
- 0.61
- Internal Rate of Return (5 years)
- -6.0%
Cash Flow
Net Operating Income (NOI) minus mortgage payments.
Calculation:
NOI - Mortgage Payments
Cap Rate (Market Value)
Capitalization Rate is a rate of return that compares the yearly Net Operating Income (NOI) to the market value.
Calculation:
NOI / Market Value
Cash-on-Cash Return (CoC)
Annual Cash Flow / Cash Invested
Calculation:
Annual cash flow divided by initial cash invested.
Debt Coverage Ratio (DCR)
Net Operating Income (NOI) divided by total debt payments.
Calculation:
NOI / Total Debt Payments
Internal Rate of Return (IRR)
A metric for assessing profitability over time. IRR is the discount rate at which the net present value (NPV) of all future cash flows (positive and negative) from an investment equals zero — including both periodic cash flow (such as rent) and a projected sale at the end of the holding period. It represents the expected annualized return, accounting for income, expenses, and the recovery of capital through a future sale.
Purchase Details
Purchase PriceThe price paid for the property. Purchase price:
| $559,900 |
|---|---|
Amount FinancedThe amount of the purchase financed through a loan. Amount financed:
| -$447,920 |
Down paymentThe initial payment made towards the purchase. Down payment:
| $111,980 |
Closing CostsFees and expenses associated with purchasing a property, typically ranging from 2% to 5% of the home’s purchase price, paid at the end of a home purchase to cover services like lending, title transfer, and taxes. Closing costs:
| $16,797 |
Rehab CostsCosts incurred to repair or improve the property, including: roof, flooring, exterior siding, kitchen, exterior paint, bathrooms, etc. Rehab costs:
| $0 |
Initial Cash InvestedThe total initial cash invested in the property. Calculation:Down payment + Buying costs + Rehab costs Initial cash invested:
| $128,777 |
Square Feet (SQFT)The total square footage of the property. Square feet:
| 2,092 |
Cost Per Square FootCost per square foot of the property. Calculation:Purchase Price / Square Feet Cost per square foot:
| $268 |
Monthly Rent Per Square FootMonthly rent divided by the number of square feet. This ratio helps investors compare rental income efficiency across properties, markets, and unit sizes Calculation:Monthly Rent / Square Feet Monthly rent per square foot:
| $1.67 |
Financing Details
Loan AmountThe total sum of money borrowed from a lender to finance a property purchase. Calculation:Purchase Price - Down Payment
Loan amount:
| $447,920 |
|---|---|
Loan to Value Ratio (LTV)Loan amount divided by the market value of the property. Calculation:Loan Amount / Market Value
Loan to value ratio:
| 80.0% |
Loan TypeThe type of loan (e.g., fixed, adjustable).
Loan type:
| Amortizing |
TermThe loan repayment period in years.
Term:
| 30 years |
Interest RateThe percentage a lender charges on the borrowed amount of a loan, determining the cost of borrowing money.
Interest rate:
| 6.625% |
Principal & Interest (PI)The principal is the portion of the loan payment that reduces the loan balance. The interest is the lender's charge for borrowing money. Calculation:(P * r * (1 + r) ** n) / ((1 + r) ** n - 1) Where:
P = Loan amount (principal)
Principal & interest:
| $2,868 |
Property TaxesAnnual taxes levied by local governments on real estate properties. These taxes fund public services like schools, roads, and emergency services.
Property tax:
| $613 |
InsuranceThe costs for insurance coverage to protect against financial losses due to risks like fire, natural disasters, theft, liability, or tenant-related damages. Calculation:Assumes 7% of gross rental income, unless insurance rates are specified.
Insurance:
| $245 |
Private Mortgage Insurance (PMI)A fee that borrowers pay when they take out a conventional loan with a loan-to-value (LTV) ratio above 80%.
Private mortgage insurance (PMI):
| $0 |
Monthly PaymentThe fixed amount a borrower pays each month to repay a loan. It typically includes principal and interest (P&I) and may also cover property taxes, insurance, HOA fees, and PMI if escrowed. Monthly payment:
| $3,726 |
Operating Income
| % Rent | Monthly | Yearly | |
|---|---|---|---|
Gross RentThe total rental income received from tenants before deducting any expenses. Includes base rent, late fees, pet fees, parking fees, and other recurring charges.
Gross rent:
| $3,500 | $42,000 | |
Vacancy LossExpected loss of rent due to vacancies.
Vacancy loss:
(6%)
| 6% | -$210 | -$2,520 |
Operating IncomeGross rental income minus vacancy loss. Calculation:Gross rent - Vacancy loss
Operating income:
| $3,290 | $39,480 |
Operating Expenses
| % Rent | Monthly | Yearly | |
|---|---|---|---|
Property TaxesAnnual taxes levied by local governments on real estate properties. These taxes fund public services like schools, roads, and emergency services. | 18% | -$613 | -$7,351 |
InsuranceThe costs for insurance coverage to protect against financial losses due to risks like fire, natural disasters, theft, liability, or tenant-related damages. Calculation:Assumes 7% of gross rental income, unless insurance rates are specified. | 7% | -$245 | -$2,940 |
Property ManagementThe costs associated with hiring a property manager to handle the day-to-day operations of a rental property. Includes management fees, leasing fes, eviction fees, etc. Calculation:Assumes 8% of gross rental income. | 8% | -$280 | -$3,360 |
Repairs & MaintenanceOngoing costs for routine upkeep and minor fixes needed to keep a property in good working condition. Calculation:Assumes 5% of gross rental income. Varies by property age and condition. | 5% | -$175 | -$2,100 |
Capital ExpensesLarge, infrequent costs for major improvements or replacements, like a new roof, HVAC system, or appliances. Calculation:Assumes 5% of gross rental income. Varies by property age. | 5% | -$175 | -$2,100 |
HOA FeesRegular dues paid to a Homeowners Association for community maintenance, amenities, and management. Similar fees include: Condo Association Fees, Co-op Maintenance Fees, etc. | 1% | -$41 | -$492 |
Operating ExpensesRecurring costs required to maintain and manage a rental property, including property taxes, insurance, maintenance, repairs, utilities (if paid by the owner), property management fees, and other day-to-day expenses. Calculation:Insurance + Property Taxes + Property Management + Repairs & Maintenance + Capital Expenditures + HOA Fees | 44% | -$1,529 | -$18,343 |
Cash Flow
| Monthly | Yearly | |
|---|---|---|
Net Operating Income (NOI)The income generated from a property after deducting all operating expenses but before deducting mortgage payments, taxes, and capital expenditures. Calculation:Gross Operating Income - Operating Expenses
Net operating income:
| $1,761 | $21,132 |
Mortgage PaymentThe fixed amount a borrower pays each month to repay a loan. It typically includes principal and interest (P&I) and may also cover property taxes, insurance, HOA fees, and PMI if escrowed. | -$2,868 | -$34,416 |
Cash FlowNet Operating Income (NOI) minus mortgage payments. Calculation:NOI - Mortgage Payments | $1,107 | $13,284 |