
$3,750,000
Investment Summary
- Monthly Cash Flow
- -$14,998
- Cap Rate
- 1.3%
- Cash-on-Cash Return
- -20.9%
- Debt Coverage Ratio
- 0.22
- Internal Rate of Return (5 years)
- -16.1%
Cash Flow
Net Operating Income (NOI) minus mortgage payments.
Calculation:
NOI - Mortgage Payments
Cap Rate (Market Value)
Capitalization Rate is a rate of return that compares the yearly Net Operating Income (NOI) to the market value.
Calculation:
NOI / Market Value
Cash-on-Cash Return (CoC)
Annual Cash Flow / Cash Invested
Calculation:
Annual cash flow divided by initial cash invested.
Debt Coverage Ratio (DCR)
Net Operating Income (NOI) divided by total debt payments.
Calculation:
NOI / Total Debt Payments
Internal Rate of Return (IRR)
A metric for assessing profitability over time. IRR is the discount rate at which the net present value (NPV) of all future cash flows (positive and negative) from an investment equals zero — including both periodic cash flow (such as rent) and a projected sale at the end of the holding period. It represents the expected annualized return, accounting for income, expenses, and the recovery of capital through a future sale.
Property Description
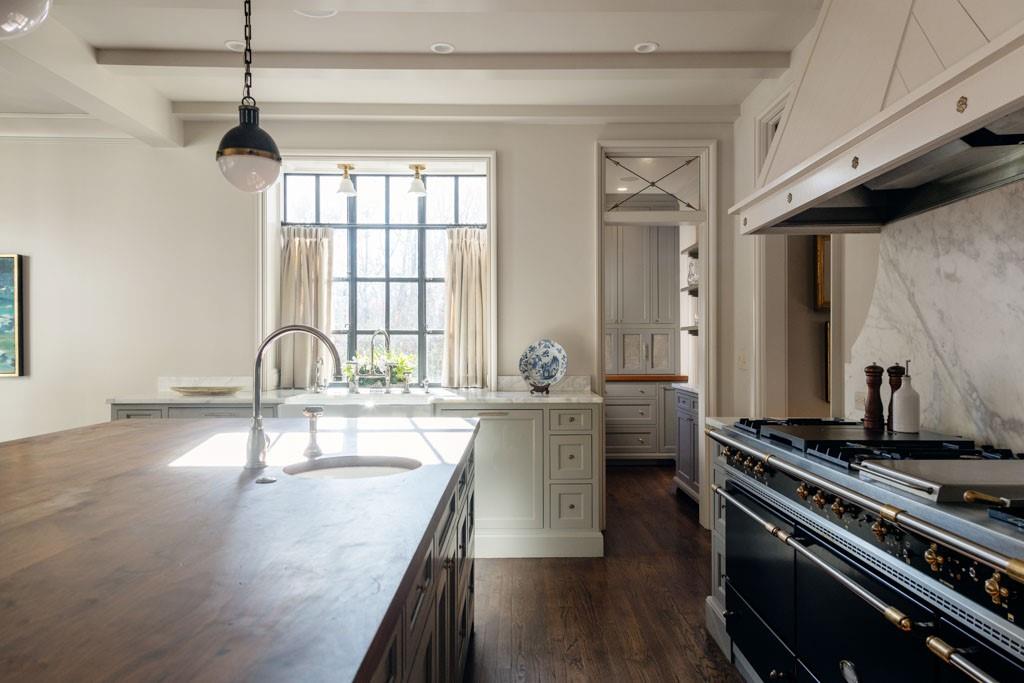
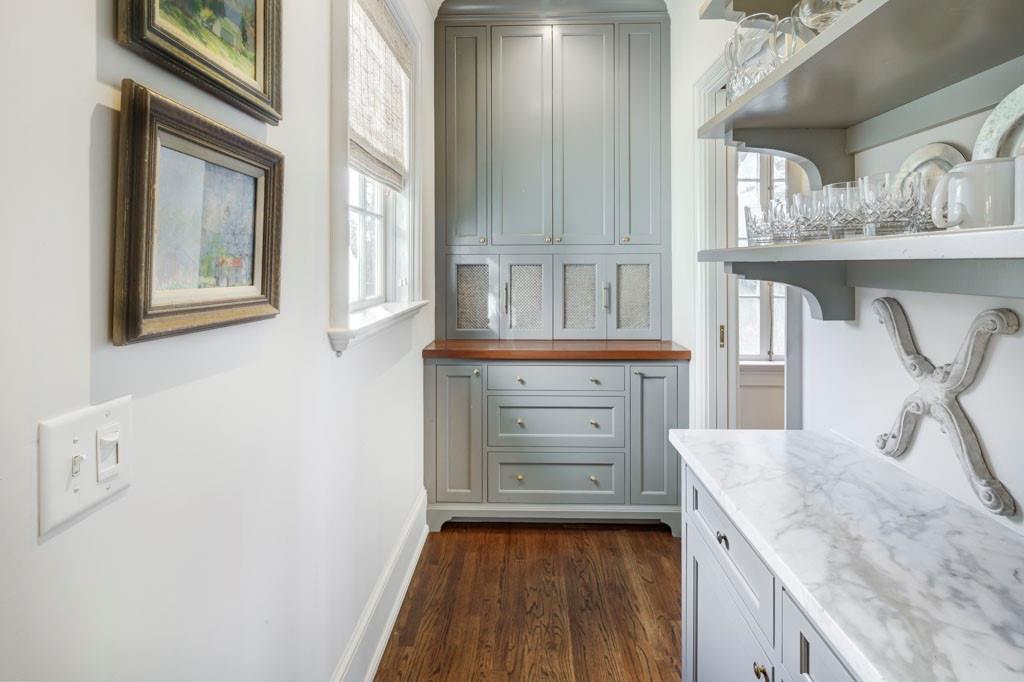
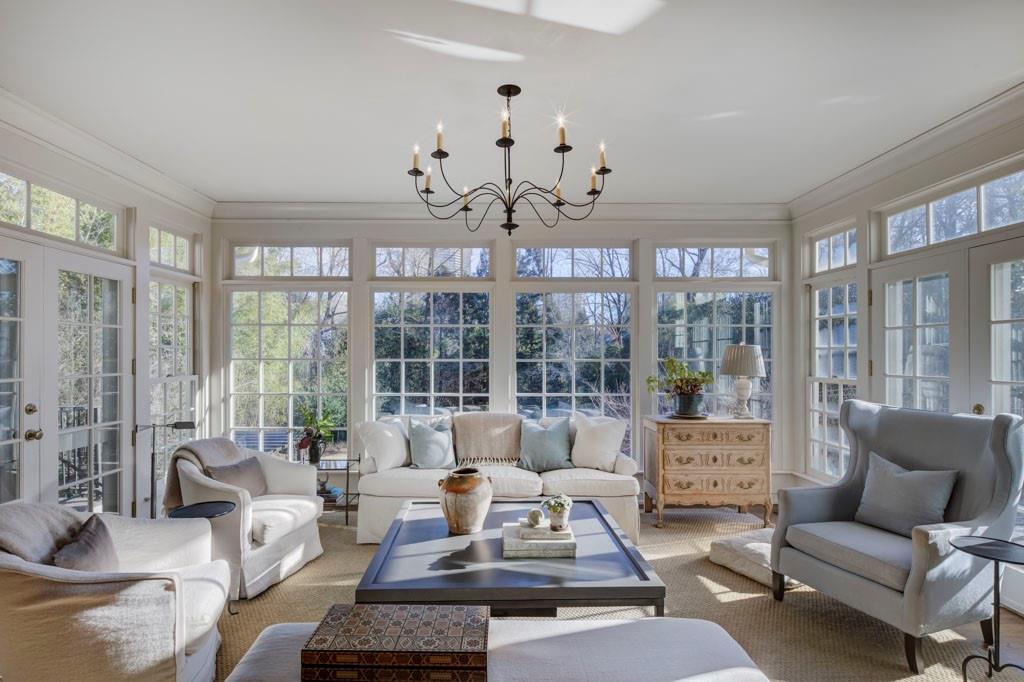
Welcome to 2583 Habersham, a complete historical renovation and restoration at the hands of two of the best in the business: Norman Askins and Patrick Davey. Absolutely every square inch of this property has been restored, including windows that were removed and rebuilt so as to keep the historical charm of the home. Located on the quiet stretch of Habersham between West Wesley and Peachtree Battle, this property is as beautiful and enjoyable on the outside as it is on the inside. You enter the home to high ceilings, countless windows, custom moldings, tasteful and elegant finishes, leaded windows and transoms, fully restored coal fireplaces, and custom aspects you will not see in any other home in Atlanta. On top of that, the layout is perfect for any buyer’s need. The main level of the home features a stunning kitchen open to the family room. The family room is surrounded by windows that overlook the pool area and flat play yard. The main level also has a large dining room, a sun room perfect for any piano enthusiasts, a cozy den, coffee bar, and a stately living room/library which opens to a sun lit office offering access to the truly stunning outdoor patio and garden. Upstairs you will find all the bedrooms, each with an en-suit bath. The primary suite features a sitting room and a stunning vaulted-ceiling venetian plaster bathroom. The primary closets are incredible, with separate his and hers and true retreats in which you can start and end your day. The cool laundry room is also located upstairs. The terrace level of this home is incredible. It features reclaimed wood from a barn in Indiana, a large living space perfect for relaxed television enjoyment, a billiards room, a kitchen, wine cellar and gym. It is one of the most unique and enjoyable terrace levels you will find anywhere. But just when you think you could not love the home anymore, you venture outside. The outside living spaces are truly what dreams are made off. Right off the den you will find a blue stone patio, fireplace, built in grill, and garden designed by Graham Pittman that will leave you speechless. Off the kitchen you will find a balcony accessible through steel French doors that is perfect for morning coffee. There is also a wrap-around deck that takes you down to the pool level. The pool pavilion is a true work of art. It offers a custom-design saltwater pool and outdoor cabana that is absolutely breathtaking. The gated pool opens to the perfect sized, flat yard. If you walk to the back of the private yard and look at the rear elevation of the home, you will be treated to a view that will stun and make you fall in love with both the home and its architecture. There is also a gardener’s room, outdoor shower and the home is serviced by a generator. This property is a true work of art and love. Fully restored by its current owners and ready for its next stewards. This home is perfect for those that appreciate true quality, craftmanship and ingenuity. It is truly a treat!
Build Your Team
Quickly find investor-friendly professionals who can help you succeed in real estate investing at any stage of the investing journey.


Agents
Match with investor-friendly agents who can help you find, analyze, and close your next deal


Lenders
Get the best funding…find investor-friendly lenders who specialize in your deal strategy


Property Managers
Transition to passive investing. Find a trusted property management partnership that lasts.


Tax Pros & Accountants
Taxes and financial reporting made easy—find experts to create tax savings strategies, file taxes, and more
Location
Property Details
Parking
- Description: Attached, Carport, Driveway, Parking Pad
- Details: Attached, Carport, Driveway, Parking Pad
- Garage Spaces: 0
- Spaces Total: 0
Bedroom Information
- # of Bedrooms: 4
Bathroom Information
- # of Baths (Full): 4
- # of Baths (Partial): 2
- # of Baths (Total): 6.0
Interior Features
- # of Rooms: 9
- # of Stories: 3
- Basement: Yes
- Basement Description: Bath/Stubbed, Daylight, Exterior Entry, Finished, Interior Entry
- Fireplace: Yes
Exterior Features
- Exterior Walls Materials: Wood
- Foundation: None
- Roof Material: Composition
Land Information
- Land Use: Residential
- Land Use Subtype: Single Family Residential
Lot Information
- Parcel ID: 17011200030196
- Lot Size: 0 sqft
Property Information
- Property Type: Single Family Residence
- Style: Traditional
- Year Built: 1930
Tax Information
- Annual Tax: $30,608
Utilities
- Water & Sewer: Public
- Heating: Natural Gas
- Cooling: Central Air
Location
- County: Fulton
Listing Details
Investment Summary
- Monthly Cash Flow
- -$14,998
- Cap Rate
- 1.3%
- Cash-on-Cash Return
- -20.9%
- Debt Coverage Ratio
- 0.22
- Internal Rate of Return (5 years)
- -16.1%
Cash Flow
Net Operating Income (NOI) minus mortgage payments.
Calculation:
NOI - Mortgage Payments
Cap Rate (Market Value)
Capitalization Rate is a rate of return that compares the yearly Net Operating Income (NOI) to the market value.
Calculation:
NOI / Market Value
Cash-on-Cash Return (CoC)
Annual Cash Flow / Cash Invested
Calculation:
Annual cash flow divided by initial cash invested.
Debt Coverage Ratio (DCR)
Net Operating Income (NOI) divided by total debt payments.
Calculation:
NOI / Total Debt Payments
Internal Rate of Return (IRR)
A metric for assessing profitability over time. IRR is the discount rate at which the net present value (NPV) of all future cash flows (positive and negative) from an investment equals zero — including both periodic cash flow (such as rent) and a projected sale at the end of the holding period. It represents the expected annualized return, accounting for income, expenses, and the recovery of capital through a future sale.
Purchase Details
Purchase PriceThe price paid for the property. Purchase price:
| $3,750,000 |
|---|---|
Amount FinancedThe amount of the purchase financed through a loan. Amount financed:
| -$3,000,000 |
Down paymentThe initial payment made towards the purchase. Down payment:
| $750,000 |
Closing CostsFees and expenses associated with purchasing a property, typically ranging from 2% to 5% of the home’s purchase price, paid at the end of a home purchase to cover services like lending, title transfer, and taxes. Closing costs:
| $112,500 |
Rehab CostsCosts incurred to repair or improve the property, including: roof, flooring, exterior siding, kitchen, exterior paint, bathrooms, etc. Rehab costs:
| $0 |
Initial Cash InvestedThe total initial cash invested in the property. Calculation:Down payment + Buying costs + Rehab costs Initial cash invested:
| $862,500 |
Square Feet (SQFT)The total square footage of the property. Square feet:
| 0 |
Cost Per Square FootCost per square foot of the property. Calculation:Purchase Price / Square Feet Cost per square foot:
| n/a |
Monthly Rent Per Square FootMonthly rent divided by the number of square feet. This ratio helps investors compare rental income efficiency across properties, markets, and unit sizes Calculation:Monthly Rent / Square Feet Monthly rent per square foot:
| n/a |
Financing Details
Loan AmountThe total sum of money borrowed from a lender to finance a property purchase. Calculation:Purchase Price - Down Payment
Loan amount:
| $3,000,000 |
|---|---|
Loan to Value Ratio (LTV)Loan amount divided by the market value of the property. Calculation:Loan Amount / Market Value
Loan to value ratio:
| 80.0% |
Loan TypeThe type of loan (e.g., fixed, adjustable).
Loan type:
| Amortizing |
TermThe loan repayment period in years.
Term:
| 30 years |
Interest RateThe percentage a lender charges on the borrowed amount of a loan, determining the cost of borrowing money.
Interest rate:
| 6.625% |
Principal & Interest (PI)The principal is the portion of the loan payment that reduces the loan balance. The interest is the lender's charge for borrowing money. Calculation:(P * r * (1 + r) ** n) / ((1 + r) ** n - 1) Where:
P = Loan amount (principal)
Principal & interest:
| $19,209 |
Property TaxesAnnual taxes levied by local governments on real estate properties. These taxes fund public services like schools, roads, and emergency services.
Property tax:
| $2,551 |
InsuranceThe costs for insurance coverage to protect against financial losses due to risks like fire, natural disasters, theft, liability, or tenant-related damages. Calculation:Assumes 7% of gross rental income, unless insurance rates are specified.
Insurance:
| $686 |
Private Mortgage Insurance (PMI)A fee that borrowers pay when they take out a conventional loan with a loan-to-value (LTV) ratio above 80%.
Private mortgage insurance (PMI):
| $0 |
Monthly PaymentThe fixed amount a borrower pays each month to repay a loan. It typically includes principal and interest (P&I) and may also cover property taxes, insurance, HOA fees, and PMI if escrowed. Monthly payment:
| $22,446 |
Operating Income
| % Rent | Monthly | Yearly | |
|---|---|---|---|
Gross RentThe total rental income received from tenants before deducting any expenses. Includes base rent, late fees, pet fees, parking fees, and other recurring charges.
Gross rent:
| $9,800 | $117,600 | |
Vacancy LossExpected loss of rent due to vacancies.
Vacancy loss:
(6%)
| 6% | -$588 | -$7,056 |
Operating IncomeGross rental income minus vacancy loss. Calculation:Gross rent - Vacancy loss
Operating income:
| $9,212 | $110,544 |
Operating Expenses
| % Rent | Monthly | Yearly | |
|---|---|---|---|
Property TaxesAnnual taxes levied by local governments on real estate properties. These taxes fund public services like schools, roads, and emergency services. | 26% | -$2,551 | -$30,608 |
InsuranceThe costs for insurance coverage to protect against financial losses due to risks like fire, natural disasters, theft, liability, or tenant-related damages. Calculation:Assumes 7% of gross rental income, unless insurance rates are specified. | 7% | -$686 | -$8,232 |
Property ManagementThe costs associated with hiring a property manager to handle the day-to-day operations of a rental property. Includes management fees, leasing fes, eviction fees, etc. Calculation:Assumes 8% of gross rental income. | 8% | -$784 | -$9,408 |
Repairs & MaintenanceOngoing costs for routine upkeep and minor fixes needed to keep a property in good working condition. Calculation:Assumes 5% of gross rental income. Varies by property age and condition. | 5% | -$490 | -$5,880 |
Capital ExpensesLarge, infrequent costs for major improvements or replacements, like a new roof, HVAC system, or appliances. Calculation:Assumes 5% of gross rental income. Varies by property age. | 5% | -$490 | -$5,880 |
HOA FeesRegular dues paid to a Homeowners Association for community maintenance, amenities, and management. Similar fees include: Condo Association Fees, Co-op Maintenance Fees, etc. | n/a | n/a | n/a |
Operating ExpensesRecurring costs required to maintain and manage a rental property, including property taxes, insurance, maintenance, repairs, utilities (if paid by the owner), property management fees, and other day-to-day expenses. Calculation:Insurance + Property Taxes + Property Management + Repairs & Maintenance + Capital Expenditures + HOA Fees | 51% | -$5,001 | -$60,008 |
Cash Flow
| Monthly | Yearly | |
|---|---|---|
Net Operating Income (NOI)The income generated from a property after deducting all operating expenses but before deducting mortgage payments, taxes, and capital expenditures. Calculation:Gross Operating Income - Operating Expenses
Net operating income:
| $4,211 | $50,532 |
Mortgage PaymentThe fixed amount a borrower pays each month to repay a loan. It typically includes principal and interest (P&I) and may also cover property taxes, insurance, HOA fees, and PMI if escrowed. | -$19,209 | -$230,508 |
Cash FlowNet Operating Income (NOI) minus mortgage payments. Calculation:NOI - Mortgage Payments | $14,998 | $179,976 |