
$6,900,000
Investment Summary
- Monthly Cash Flow
- -$32,411
- Cap Rate
- 0.6%
- Cash-on-Cash Return
- -24.5%
- Debt Coverage Ratio
- 0.10
- Internal Rate of Return (5 years)
- -19.6%
Cash Flow
Net Operating Income (NOI) minus mortgage payments.
Calculation:
NOI - Mortgage Payments
Cap Rate (Market Value)
Capitalization Rate is a rate of return that compares the yearly Net Operating Income (NOI) to the market value.
Calculation:
NOI / Market Value
Cash-on-Cash Return (CoC)
Annual Cash Flow / Cash Invested
Calculation:
Annual cash flow divided by initial cash invested.
Debt Coverage Ratio (DCR)
Net Operating Income (NOI) divided by total debt payments.
Calculation:
NOI / Total Debt Payments
Internal Rate of Return (IRR)
A metric for assessing profitability over time. IRR is the discount rate at which the net present value (NPV) of all future cash flows (positive and negative) from an investment equals zero — including both periodic cash flow (such as rent) and a projected sale at the end of the holding period. It represents the expected annualized return, accounting for income, expenses, and the recovery of capital through a future sale.
Property Description
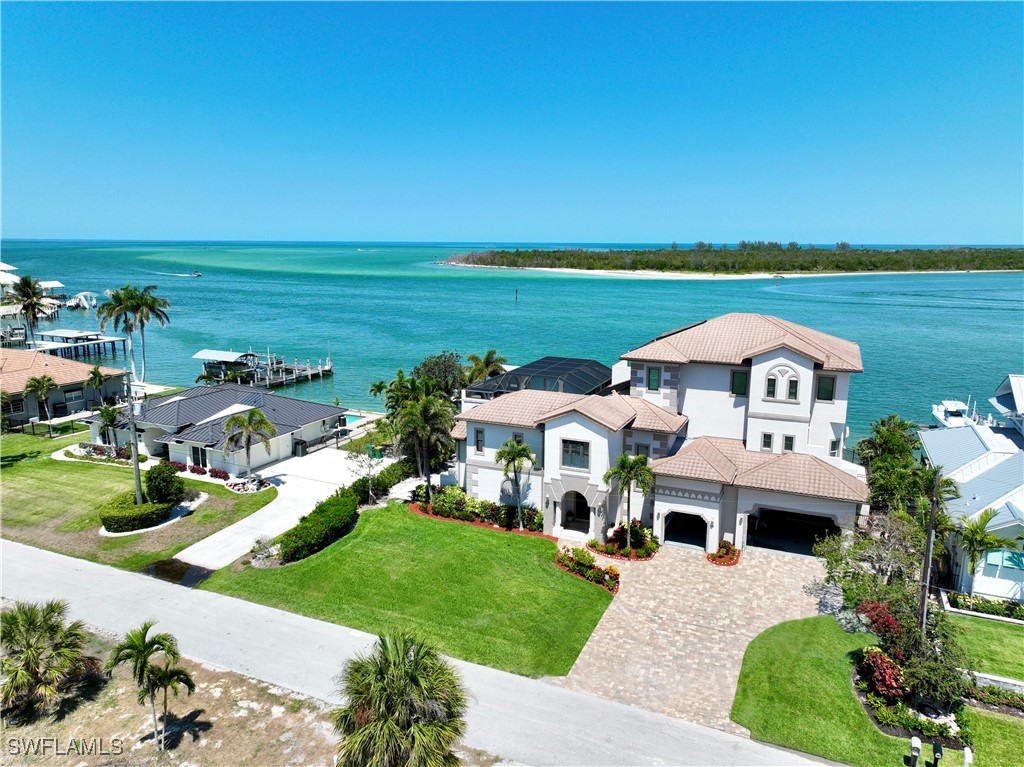
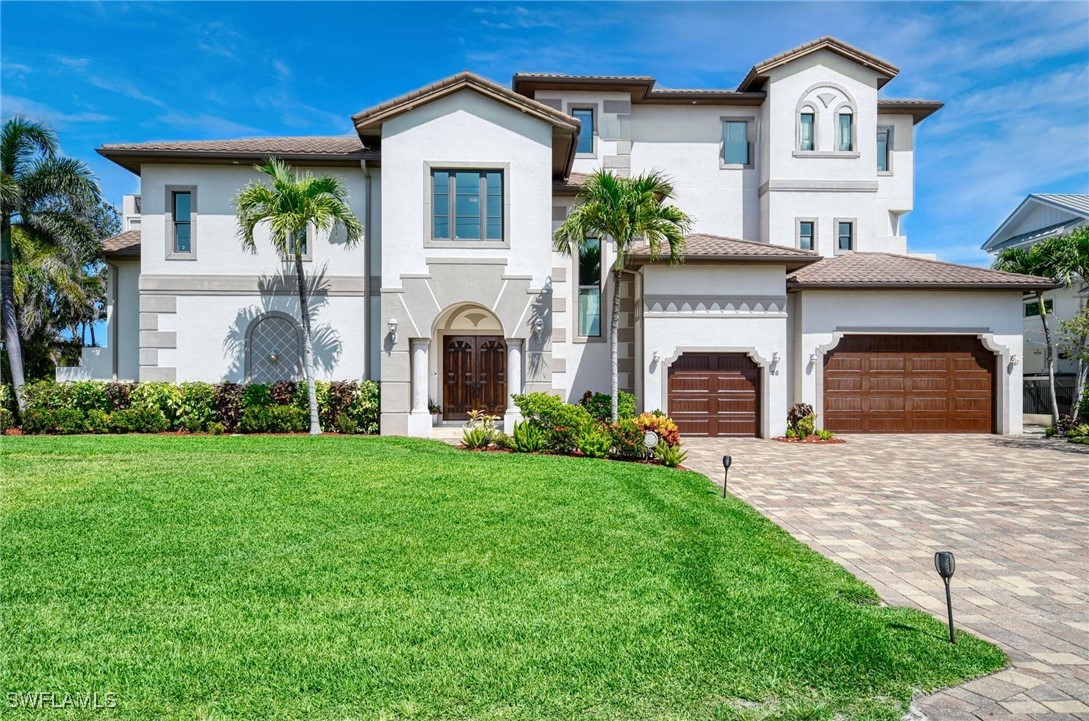
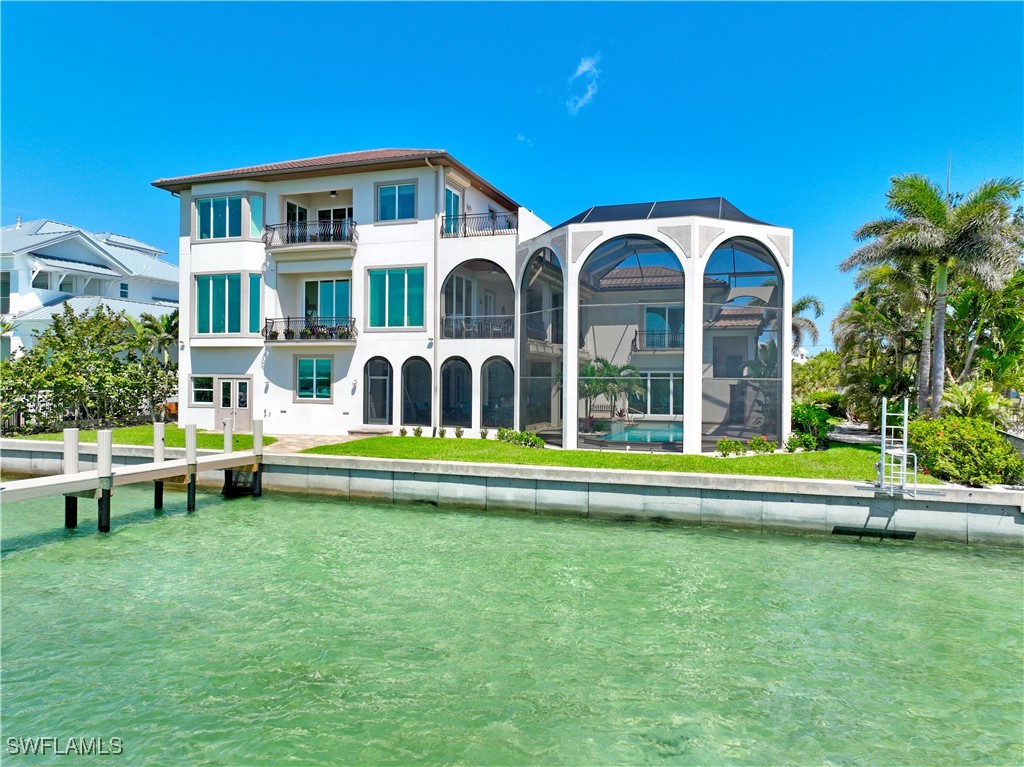
Imagine waking up to the gentle hum of the ocean & breathtaking views, with a landscape that invites the morning sun to dance upon the waves right at your doorstep. Ensconced on 1.5 lots, with panoramic water vistas & an array of aquatic adventures right at your fingertips. Located on Isles of Capri, with 5 bedrooms & 4.5 bathrooms, comfort is at every corner. The interior of the home is as impressive as its exterior with every floor easily accessible via an elevator, ensuring all your family & guests experience absolute comfort. Each living space is designed to maximize the stunning views outside, whether you're hosting in the grand living area or enjoying a tranquil sunset from the cabana. The spacious living areas are bathed in natural light, highlighting the fine craftsmanship & attention to detail throughout the home. The metal roof, hurricane impact windows / sliders & whole house generator, provide peace of mind for what ever weather, Mother Nature throws at you. A 4 car garage gives you plenty of room for all the cars and toys. Outdoor living is elevated to new heights here. With its sprawling outdoor space accentuated by a large, shimmering pool & spa, your memories are set to be unforgettable. The big dock & 2 boat lifts, ensures your maritime ventures are hassle-free, with instant access to the Gulf of America. Whether it’s casting a line off the dock to hook a Tarpon or setting sail for a whimsical day trip to Key west, the possibilities are as boundless as the ocean itself. Paddling through mangrove tunnels, kayaking down endless trails & a myriad of other water activities are all within the realm of your new daily routine. Back at home, each meal can become a scenic feast in the spacious, well- equipped kitchen, designed with the culinary enthusiast in mind. Boasting a generous 4,625 Sqft of chic living space, this home is strategically poised to offer some of the most picturesque water views that SWFL has to offer. The local fauna is vibrant, with regular sightings of playful pelicans, frolicking dolphins & ambling manatees all in your backyard. Prepare for unforgettable sunsets that paint a unique masterpiece in the sky each evening, ideal for ending your day on a magical note. The location is perfect for those who revel in nature's beauty while enjoying close proximity to modern amenities. For epicurean delights, the locality does not disappoint. Several restaurants are just a short golf cart ride away, offering delectable, dining options that promise to tantalize your taste buds. This home isn’t just a living space, it’s a lifestyle upgrade. Where every day feels like a vacation & nature’s wonders never cease to amaze. Ideal for both intimate family life & grandiose entertaining, this residence doesn’t just house you; it compels you to live vibrantly & relax profoundly. Embark on your new life, where the sky blends into the ocean, every day ends with an unforgettable sunset & life is measured by the tides
Build Your Team
Quickly find investor-friendly professionals who can help you succeed in real estate investing at any stage of the investing journey.


Agents
Match with investor-friendly agents who can help you find, analyze, and close your next deal


Lenders
Get the best funding…find investor-friendly lenders who specialize in your deal strategy


Property Managers
Transition to passive investing. Find a trusted property management partnership that lasts.


Tax Pros & Accountants
Taxes and financial reporting made easy—find experts to create tax savings strategies, file taxes, and more
Location
Property Details
Parking
- Details: Attached, Garage, Garage Door Opener
- Garage Spaces: 4
- Spaces Total: 0
Bedroom Information
- # of Bedrooms: 5
Bathroom Information
- # of Baths (Full): 4
- # of Baths (Total): 5.0
Interior Features
- # of Stories: 4
Exterior Features
- Roof Material: Metal
- Pool: Yes
Land Information
- Land Use: Residential
- Land Use Subtype: Single Family Residential
Lot Information
- Parcel ID: 52343800009
- Lot Size: 0 sqft
Property Information
- Property Type: Single Family Residence
- Style: Courtyard, Other, See Remarks
- Year Built: 2012
Tax Information
- Annual Tax: $23,234
Utilities
- Water & Sewer: Public
- Heating: Central, Electric
- Cooling: Central Air, Electric
Location
- County: Collier
Listing Details
Investment Summary
- Monthly Cash Flow
- -$32,411
- Cap Rate
- 0.6%
- Cash-on-Cash Return
- -24.5%
- Debt Coverage Ratio
- 0.10
- Internal Rate of Return (5 years)
- -19.6%
Cash Flow
Net Operating Income (NOI) minus mortgage payments.
Calculation:
NOI - Mortgage Payments
Cap Rate (Market Value)
Capitalization Rate is a rate of return that compares the yearly Net Operating Income (NOI) to the market value.
Calculation:
NOI / Market Value
Cash-on-Cash Return (CoC)
Annual Cash Flow / Cash Invested
Calculation:
Annual cash flow divided by initial cash invested.
Debt Coverage Ratio (DCR)
Net Operating Income (NOI) divided by total debt payments.
Calculation:
NOI / Total Debt Payments
Internal Rate of Return (IRR)
A metric for assessing profitability over time. IRR is the discount rate at which the net present value (NPV) of all future cash flows (positive and negative) from an investment equals zero — including both periodic cash flow (such as rent) and a projected sale at the end of the holding period. It represents the expected annualized return, accounting for income, expenses, and the recovery of capital through a future sale.
Purchase Details
Purchase PriceThe price paid for the property. Purchase price:
| $6,900,000 |
|---|---|
Amount FinancedThe amount of the purchase financed through a loan. Amount financed:
| -$5,520,000 |
Down paymentThe initial payment made towards the purchase. Down payment:
| $1,380,000 |
Closing CostsFees and expenses associated with purchasing a property, typically ranging from 2% to 5% of the home’s purchase price, paid at the end of a home purchase to cover services like lending, title transfer, and taxes. Closing costs:
| $207,000 |
Rehab CostsCosts incurred to repair or improve the property, including: roof, flooring, exterior siding, kitchen, exterior paint, bathrooms, etc. Rehab costs:
| $0 |
Initial Cash InvestedThe total initial cash invested in the property. Calculation:Down payment + Buying costs + Rehab costs Initial cash invested:
| $1,587,000 |
Square Feet (SQFT)The total square footage of the property. Square feet:
| 4,625 |
Cost Per Square FootCost per square foot of the property. Calculation:Purchase Price / Square Feet Cost per square foot:
| $1,492 |
Monthly Rent Per Square FootMonthly rent divided by the number of square feet. This ratio helps investors compare rental income efficiency across properties, markets, and unit sizes Calculation:Monthly Rent / Square Feet Monthly rent per square foot:
| $1.77 |
Financing Details
Loan AmountThe total sum of money borrowed from a lender to finance a property purchase. Calculation:Purchase Price - Down Payment
Loan amount:
| $5,520,000 |
|---|---|
Loan to Value Ratio (LTV)Loan amount divided by the market value of the property. Calculation:Loan Amount / Market Value
Loan to value ratio:
| 80.0% |
Loan TypeThe type of loan (e.g., fixed, adjustable).
Loan type:
| Amortizing |
TermThe loan repayment period in years.
Term:
| 30 years |
Interest RateThe percentage a lender charges on the borrowed amount of a loan, determining the cost of borrowing money.
Interest rate:
| 6.840% |
Principal & Interest (PI)The principal is the portion of the loan payment that reduces the loan balance. The interest is the lender's charge for borrowing money. Calculation:(P * r * (1 + r) ** n) / ((1 + r) ** n - 1) Where:
P = Loan amount (principal)
Principal & interest:
| $36,133 |
Property TaxesAnnual taxes levied by local governments on real estate properties. These taxes fund public services like schools, roads, and emergency services.
Property tax:
| $1,936 |
InsuranceThe costs for insurance coverage to protect against financial losses due to risks like fire, natural disasters, theft, liability, or tenant-related damages. Calculation:Assumes 7% of gross rental income, unless insurance rates are specified.
Insurance:
| $574 |
Private Mortgage Insurance (PMI)A fee that borrowers pay when they take out a conventional loan with a loan-to-value (LTV) ratio above 80%.
Private mortgage insurance (PMI):
| $0 |
Monthly PaymentThe fixed amount a borrower pays each month to repay a loan. It typically includes principal and interest (P&I) and may also cover property taxes, insurance, HOA fees, and PMI if escrowed. Monthly payment:
| $38,643 |
Operating Income
| % Rent | Monthly | Yearly | |
|---|---|---|---|
Gross RentThe total rental income received from tenants before deducting any expenses. Includes base rent, late fees, pet fees, parking fees, and other recurring charges.
Gross rent:
| $8,200 | $98,400 | |
Vacancy LossExpected loss of rent due to vacancies.
Vacancy loss:
(6%)
| 6% | -$492 | -$5,904 |
Operating IncomeGross rental income minus vacancy loss. Calculation:Gross rent - Vacancy loss
Operating income:
| $7,708 | $92,496 |
Operating Expenses
| % Rent | Monthly | Yearly | |
|---|---|---|---|
Property TaxesAnnual taxes levied by local governments on real estate properties. These taxes fund public services like schools, roads, and emergency services. | 24% | -$1,936 | -$23,234 |
InsuranceThe costs for insurance coverage to protect against financial losses due to risks like fire, natural disasters, theft, liability, or tenant-related damages. Calculation:Assumes 7% of gross rental income, unless insurance rates are specified. | 7% | -$574 | -$6,888 |
Property ManagementThe costs associated with hiring a property manager to handle the day-to-day operations of a rental property. Includes management fees, leasing fes, eviction fees, etc. Calculation:Assumes 8% of gross rental income. | 8% | -$656 | -$7,872 |
Repairs & MaintenanceOngoing costs for routine upkeep and minor fixes needed to keep a property in good working condition. Calculation:Assumes 5% of gross rental income. Varies by property age and condition. | 5% | -$410 | -$4,920 |
Capital ExpensesLarge, infrequent costs for major improvements or replacements, like a new roof, HVAC system, or appliances. Calculation:Assumes 5% of gross rental income. Varies by property age. | 5% | -$410 | -$4,920 |
HOA FeesRegular dues paid to a Homeowners Association for community maintenance, amenities, and management. Similar fees include: Condo Association Fees, Co-op Maintenance Fees, etc. | n/a | n/a | n/a |
Operating ExpensesRecurring costs required to maintain and manage a rental property, including property taxes, insurance, maintenance, repairs, utilities (if paid by the owner), property management fees, and other day-to-day expenses. Calculation:Insurance + Property Taxes + Property Management + Repairs & Maintenance + Capital Expenditures + HOA Fees | 49% | -$3,986 | -$47,834 |
Cash Flow
| Monthly | Yearly | |
|---|---|---|
Net Operating Income (NOI)The income generated from a property after deducting all operating expenses but before deducting mortgage payments, taxes, and capital expenditures. Calculation:Gross Operating Income - Operating Expenses
Net operating income:
| $3,722 | $44,664 |
Mortgage PaymentThe fixed amount a borrower pays each month to repay a loan. It typically includes principal and interest (P&I) and may also cover property taxes, insurance, HOA fees, and PMI if escrowed. | -$36,133 | -$433,596 |
Cash FlowNet Operating Income (NOI) minus mortgage payments. Calculation:NOI - Mortgage Payments | $32,411 | $388,932 |