$2,295,000
Investment Summary
- Monthly Cash Flow
- -$9,688
- Cap Rate
- 1.0%
- Cash-on-Cash Return
- -22.0%
- Debt Coverage Ratio
- 0.17
- Internal Rate of Return (5 years)
- -17.3%
Cash Flow
Net Operating Income (NOI) minus mortgage payments.
Calculation:
NOI - Mortgage Payments
Cap Rate (Market Value)
Capitalization Rate is a rate of return that compares the yearly Net Operating Income (NOI) to the market value.
Calculation:
NOI / Market Value
Cash-on-Cash Return (CoC)
Annual Cash Flow / Cash Invested
Calculation:
Annual cash flow divided by initial cash invested.
Debt Coverage Ratio (DCR)
Net Operating Income (NOI) divided by total debt payments.
Calculation:
NOI / Total Debt Payments
Internal Rate of Return (IRR)
A metric for assessing profitability over time. IRR is the discount rate at which the net present value (NPV) of all future cash flows (positive and negative) from an investment equals zero — including both periodic cash flow (such as rent) and a projected sale at the end of the holding period. It represents the expected annualized return, accounting for income, expenses, and the recovery of capital through a future sale.
Property Description
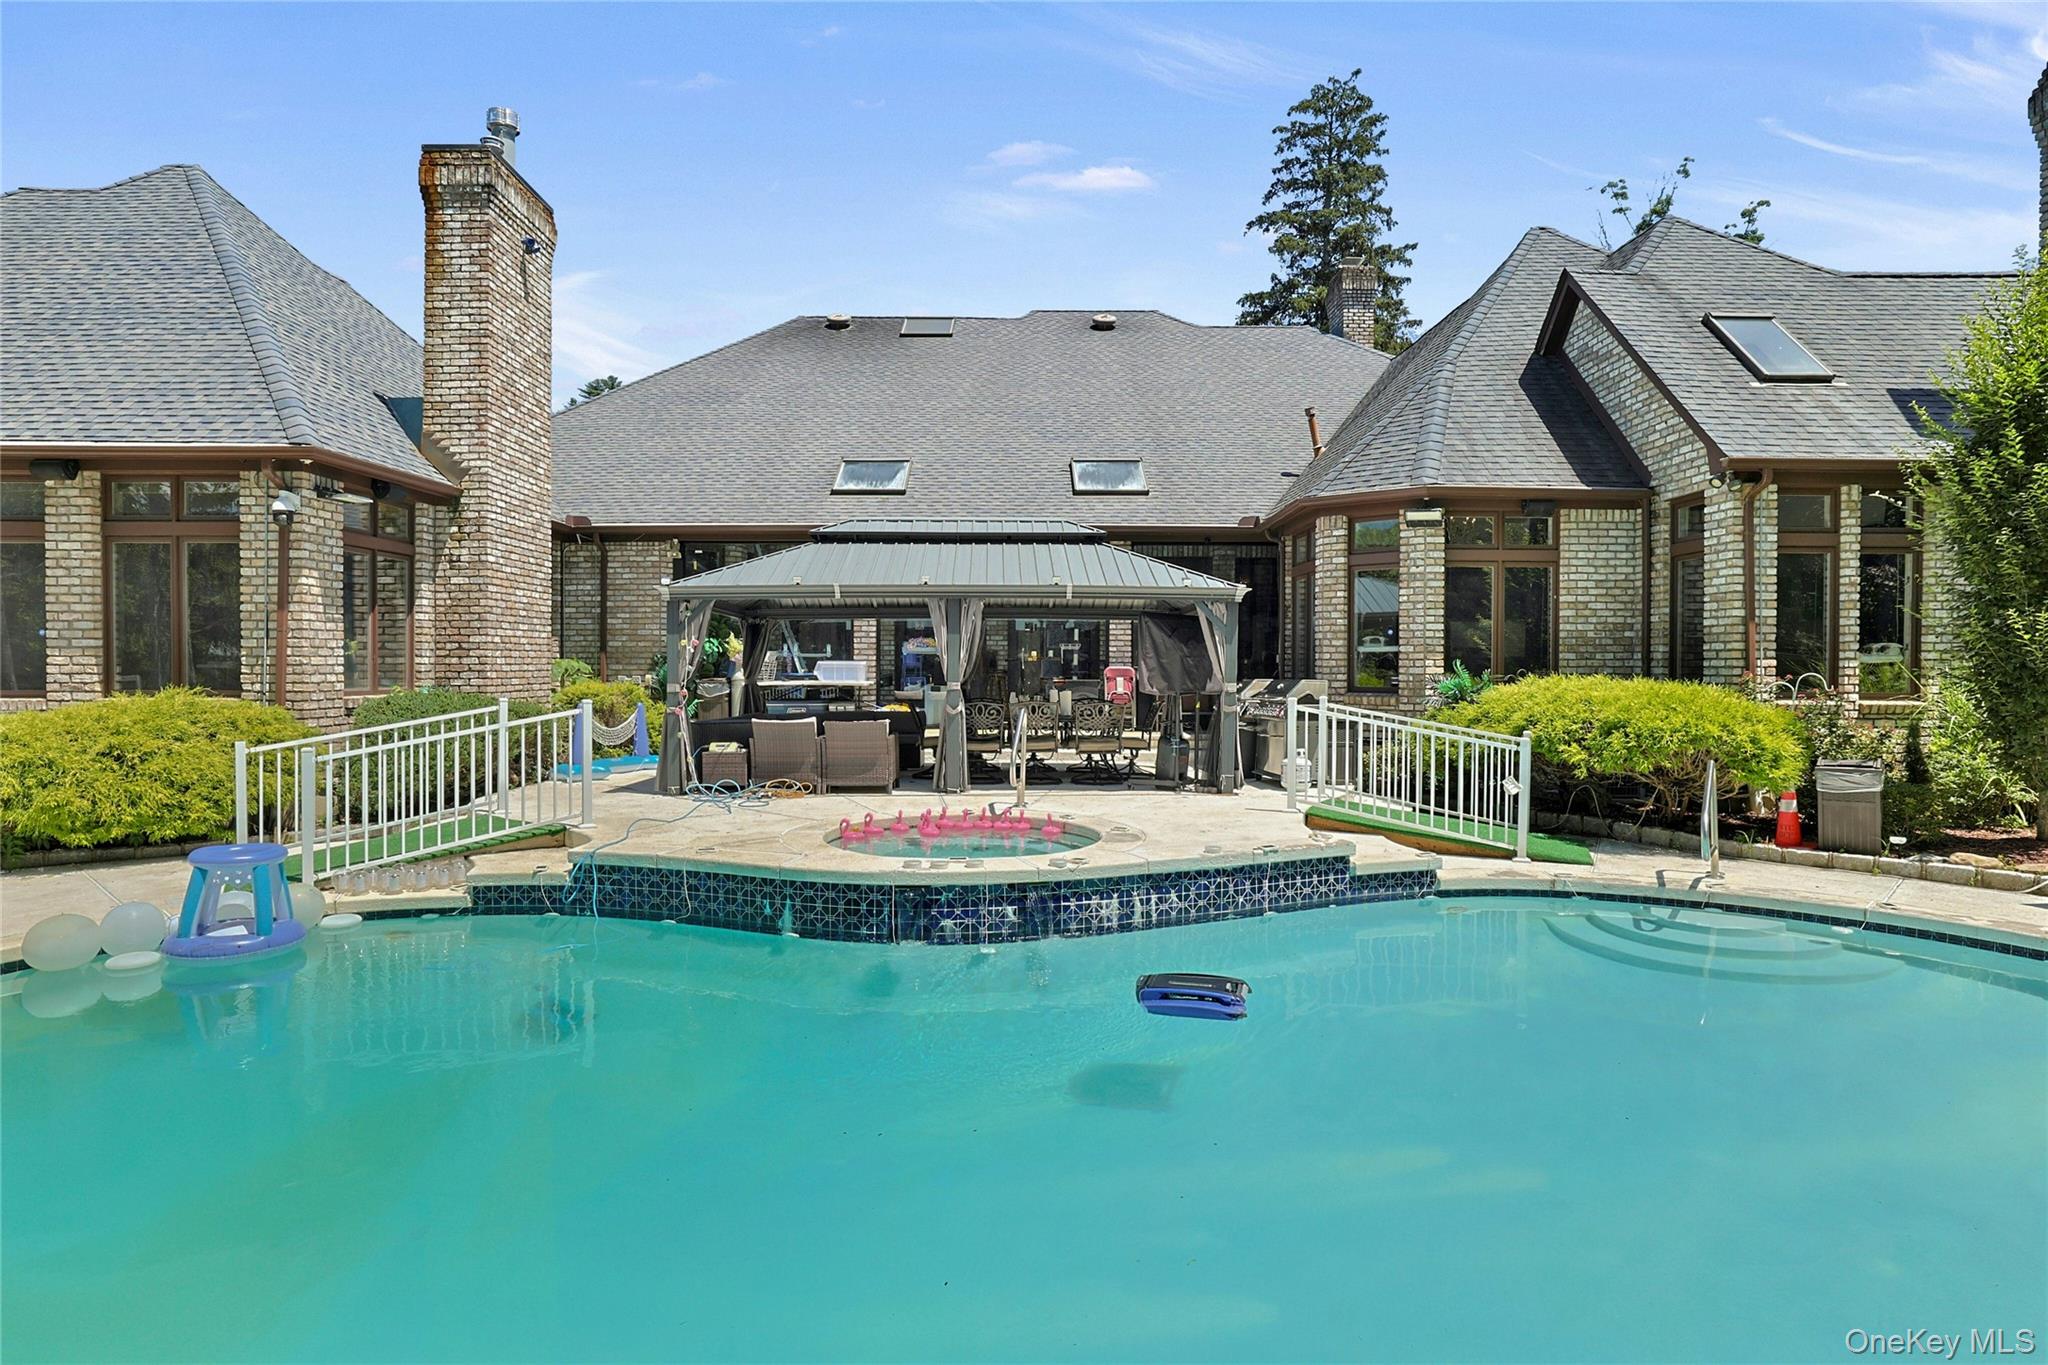
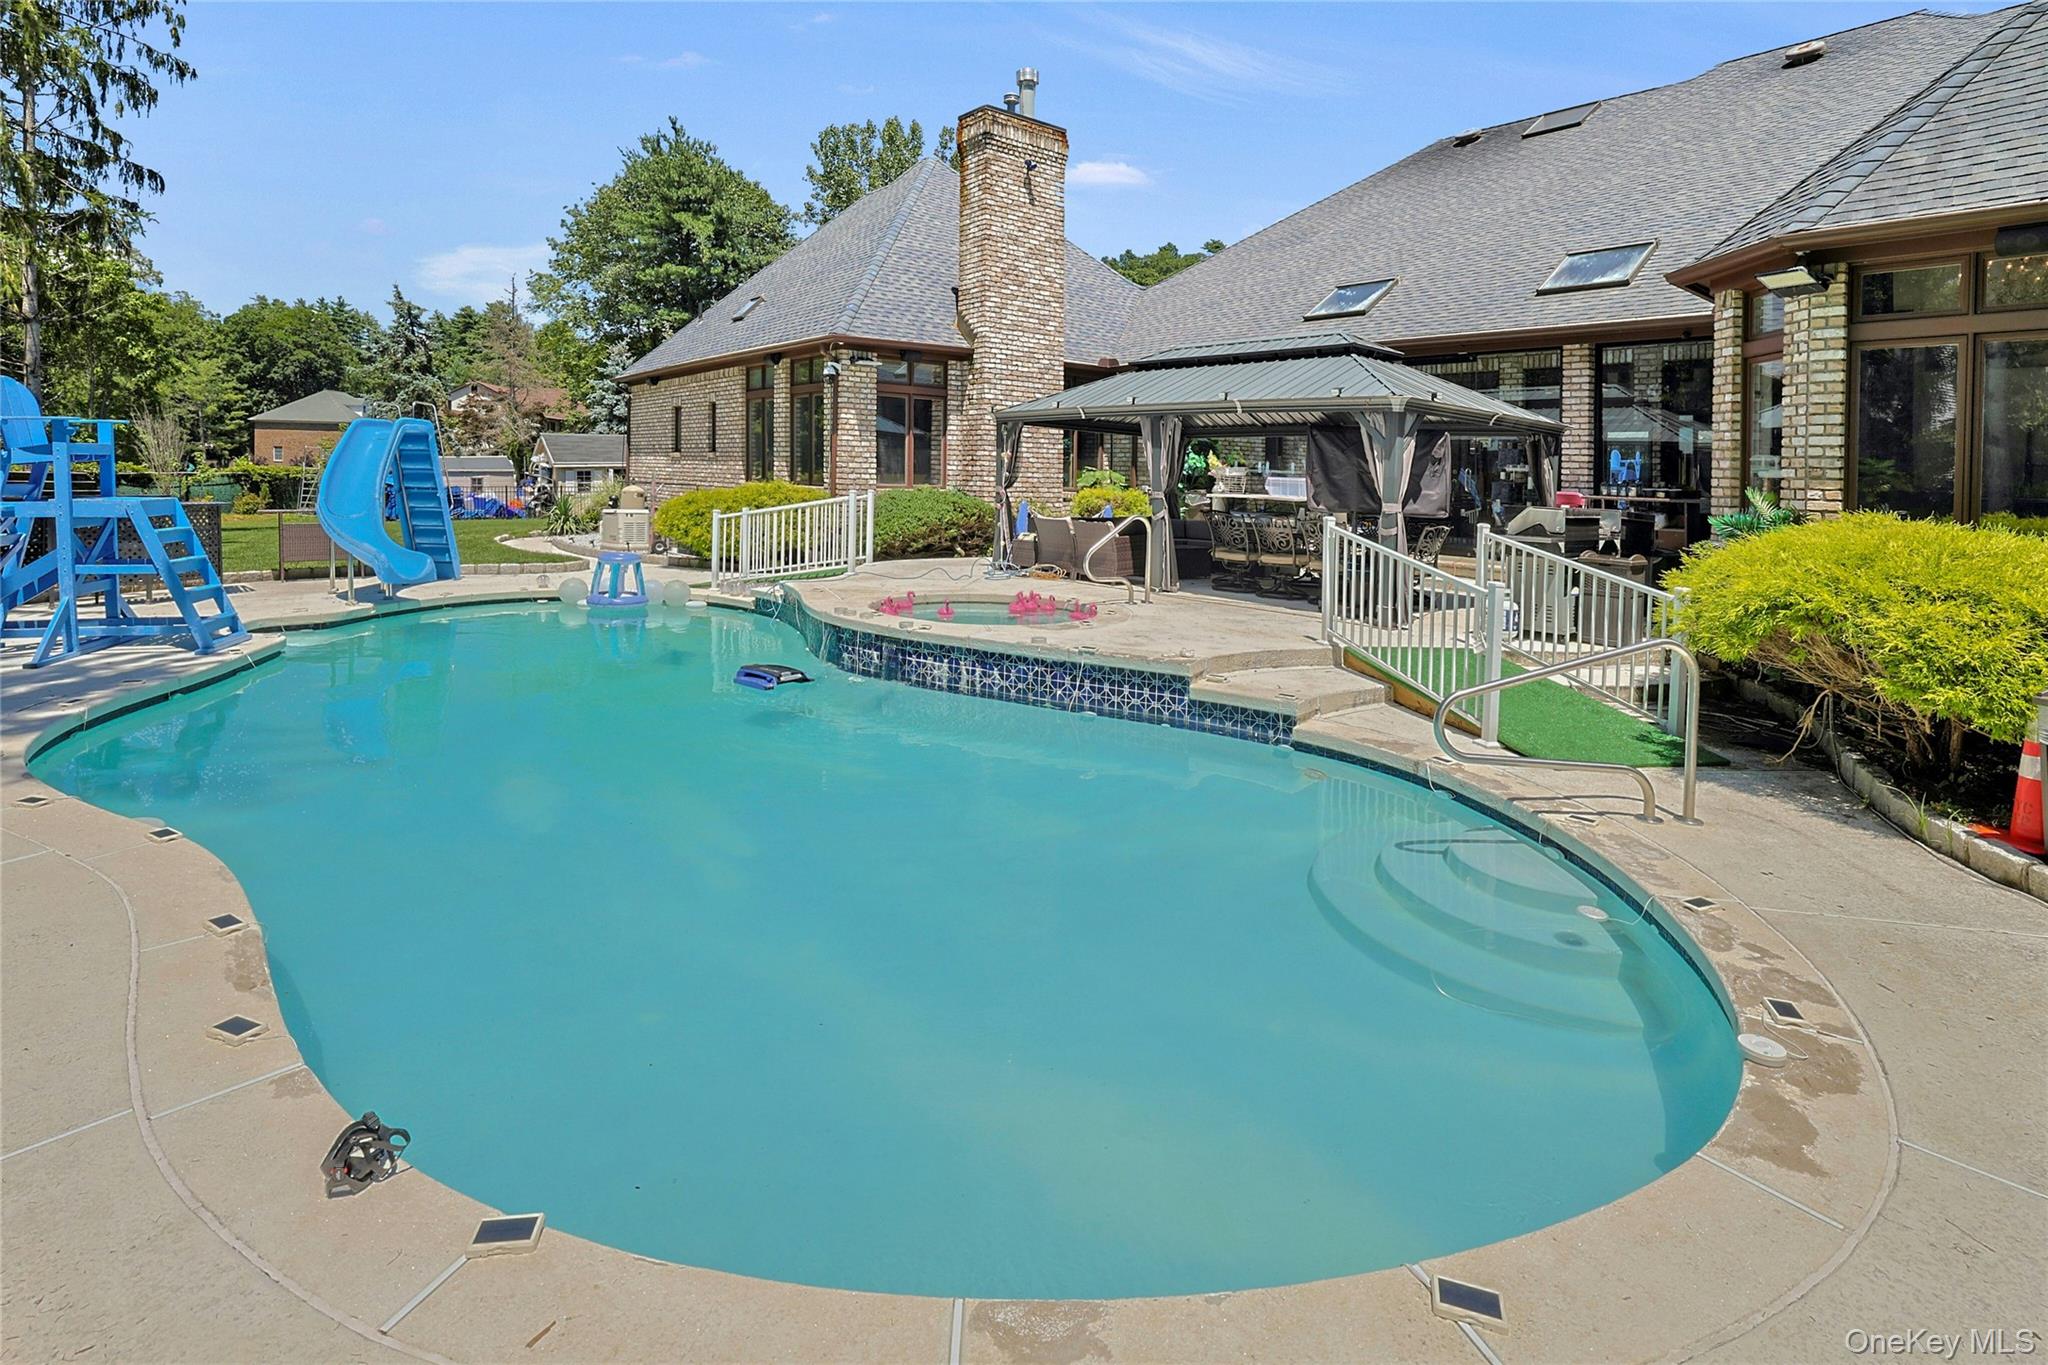
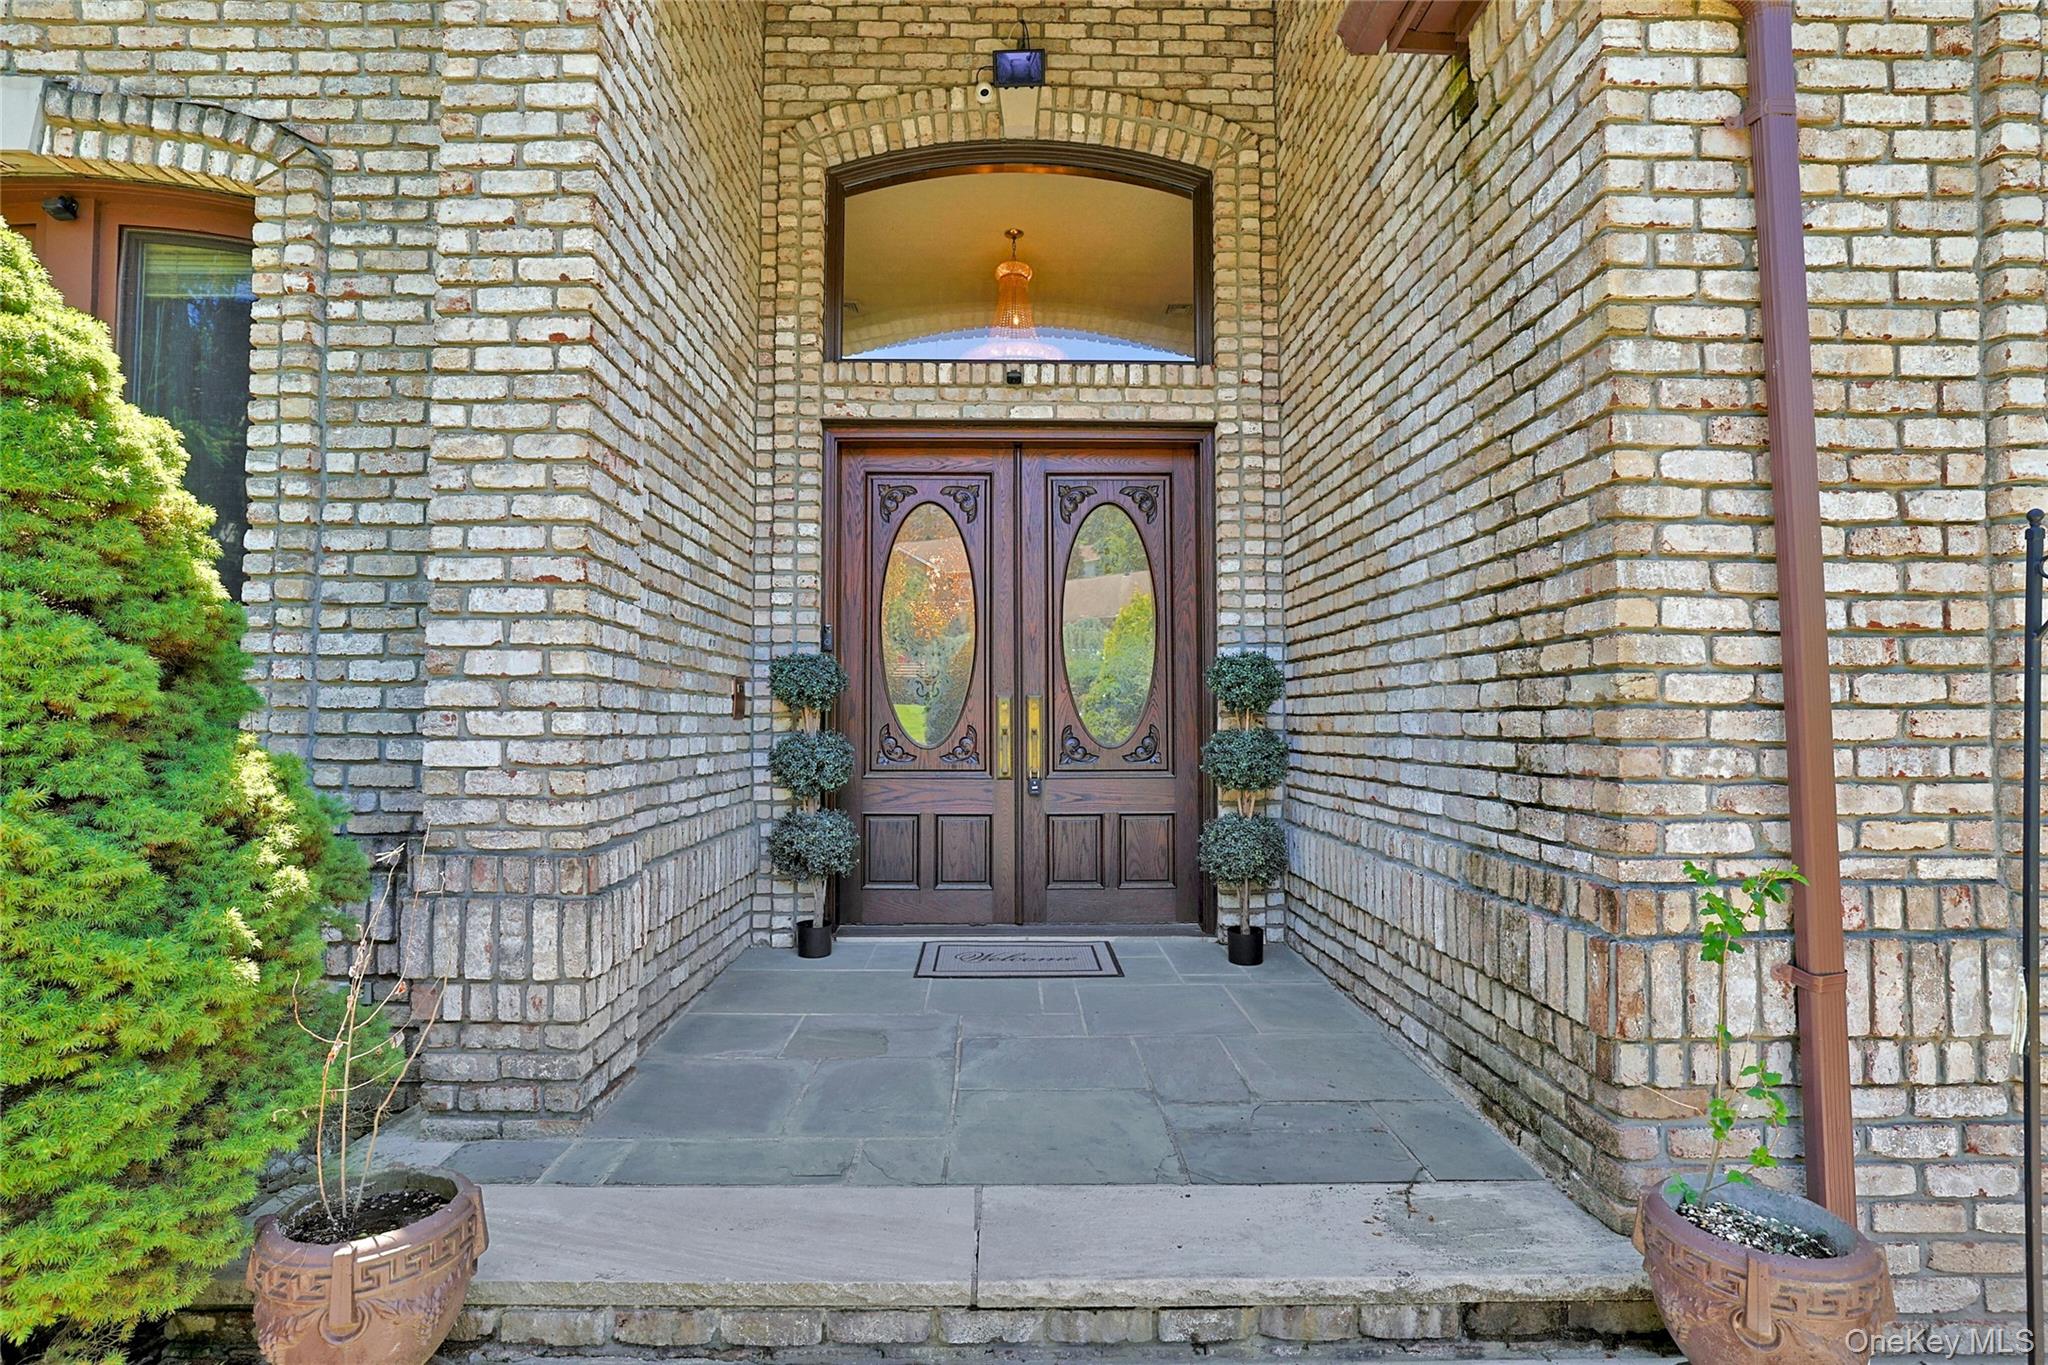
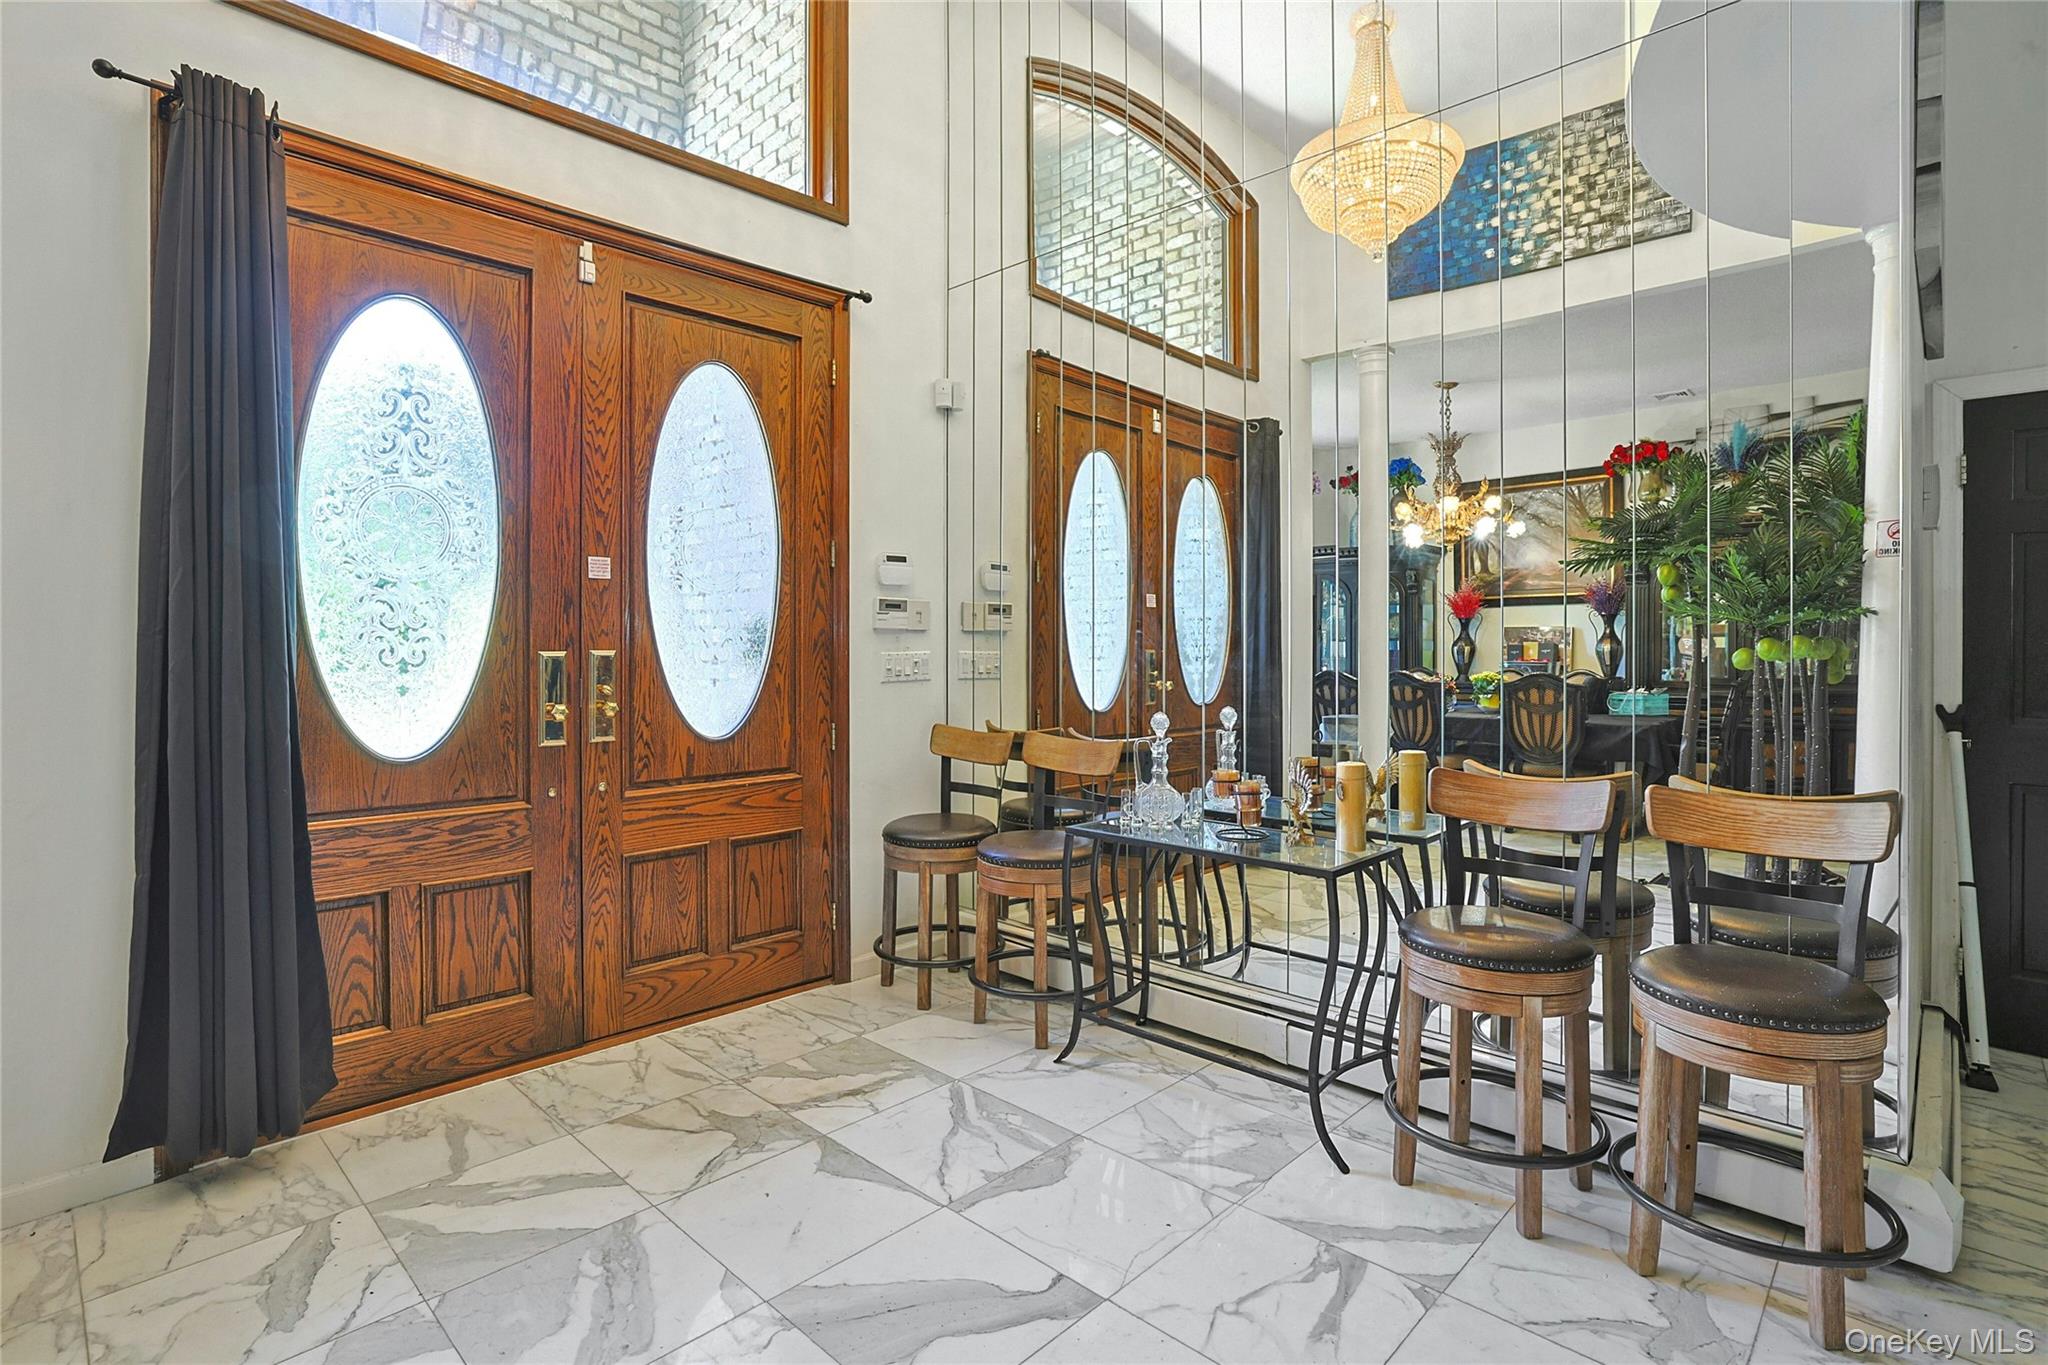
Exquisite Custom-Built Marble Palace Ranch located in one of the area’s most exclusive neighborhoods, Prestigious Pine Glen Estates. Boasting a country club–style backyard, this residence offers complete privacy with elegant metal gates at the entrance. A truly unique property, perfectly designed for entertaining and luxurious living. This is more than a home—it’s an extraordinary lifestyle waiting to be embraced. Step into the pinnacle of luxury living with this breathtaking custom-built ranch situated in the highly sought-after Pine Glen Estates. The home’s striking brick and stone facade hints at the grandeur within, where imported marble floors, walls, and a sweeping marble staircase create an atmosphere of timeless elegance and unmatched craftsmanship. Upon entering, you are greeted by a spacious and sunlit living room anchored by a stunning fireplace, setting the perfect ambiance for intimate family gatherings or lavish entertaining. The gourmet chef’s kitchen is designed for the discerning cook, featuring professional-grade stainless steel appliances, a massive granite island with an integrated wine cooler, and custom cabinetry providing both style and function. Adjacent, the oversized dining area boasts floor-to-ceiling glass doors that open to reveal a greenhouse—ideal for year-round enjoyment of your favorite plants or as a serene breakfast nook overlooking nature. The expansive great room is a masterpiece of comfort and sophistication, complete with a second fireplace and a built-in wet bar—perfect for hosting cocktail parties or unwinding in style after a long day. The master suite is a private oasis featuring dual fireplaces that add warmth and ambiance. The spa-inspired en-suite bathroom impresses with dual vanities, two luxurious showers, a deep Jacuzzi soaking tub, and two expansive walk-in closets outfitted for maximum organization and convenience. Wake up every morning feeling pampered in this lavish retreat. The home offers 3/4 more additional generously sized bedrooms, each thoughtfully designed with comfort in mind, along with three more bathrooms that combine classic elegance with modern fixtures and finishes. The fully finished lower level expands your living space dramatically. You can use as movie theater room, gym, creative studio, etc. Also abundant storage options. 2 Car garage & huge paver driveway. Outside, this estate truly shines with a meticulously landscaped and professionally manicured .92 acre lot that offers your very own private country club lifestyle. Relax or entertain beside the sparkling in-ground pool, surrounded by lush greenery, mature trees. The expansive paver driveway provides ample parking and complements the impressive curb appeal of this extraordinary residence. Additional highlights this house is literally behind the moat and electric metal gates for entry, vaulted ceilings throughout, skylights, state-of-the-art lighting, high end security system, advanced climate control systems, and premium finishes throughout, ensuring a home that is as comfortable as it is stunning. A commuter's dream, close to Palisades Parkway, 15 minutes to GW Bridge or TZ Bridge and minutes to NJ. Close to all major shopping and everything Orangetown has to offer:
Build Your Team
Quickly find investor-friendly professionals who can help you succeed in real estate investing at any stage of the investing journey.


Agents
Match with investor-friendly agents who can help you find, analyze, and close your next deal


Lenders
Get the best funding…find investor-friendly lenders who specialize in your deal strategy


Property Managers
Transition to passive investing. Find a trusted property management partnership that lasts.


Tax Pros & Accountants
Taxes and financial reporting made easy—find experts to create tax savings strategies, file taxes, and more
Location
Property Details
Parking
- Description: Attached, 3 Car Attached
- Garage Spaces: 3
- Spaces Total: 0
Bedroom Information
- # of Bedrooms: 4
Bathroom Information
- # of Baths (Full): 5
- # of Baths (Total): 5.0
Interior Features
- # of Rooms: 10
- # of Stories: 1
- Basement: Yes
- Basement Description: Finished, Full
- Fireplace: Yes
Exterior Features
- Exterior Walls Materials: Brick
- Pool: Yes
Land Information
- Land Use: Residential
- Land Use Subtype: Single Family Residential
Lot Information
- Parcel ID: 39248965.19129
- Lot Size: 40075 sqft
Property Information
- Property Type: Single Family Residence
- Style: Ranch
- Year Built: 1988
Tax Information
- Annual Tax: $23,369
Utilities
- Water & Sewer: Public
- Heating: Baseboard, Natural Gas
- Cooling: Central Air
Location
- County: Rockland
Listing Details
Investment Summary
- Monthly Cash Flow
- -$9,688
- Cap Rate
- 1.0%
- Cash-on-Cash Return
- -22.0%
- Debt Coverage Ratio
- 0.17
- Internal Rate of Return (5 years)
- -17.3%
Cash Flow
Net Operating Income (NOI) minus mortgage payments.
Calculation:
NOI - Mortgage Payments
Cap Rate (Market Value)
Capitalization Rate is a rate of return that compares the yearly Net Operating Income (NOI) to the market value.
Calculation:
NOI / Market Value
Cash-on-Cash Return (CoC)
Annual Cash Flow / Cash Invested
Calculation:
Annual cash flow divided by initial cash invested.
Debt Coverage Ratio (DCR)
Net Operating Income (NOI) divided by total debt payments.
Calculation:
NOI / Total Debt Payments
Internal Rate of Return (IRR)
A metric for assessing profitability over time. IRR is the discount rate at which the net present value (NPV) of all future cash flows (positive and negative) from an investment equals zero — including both periodic cash flow (such as rent) and a projected sale at the end of the holding period. It represents the expected annualized return, accounting for income, expenses, and the recovery of capital through a future sale.
Purchase Details
Purchase PriceThe price paid for the property. Purchase price:
| $2,295,000 |
|---|---|
Amount FinancedThe amount of the purchase financed through a loan. Amount financed:
| -$1,836,000 |
Down paymentThe initial payment made towards the purchase. Down payment:
| $459,000 |
Closing CostsFees and expenses associated with purchasing a property, typically ranging from 2% to 5% of the home’s purchase price, paid at the end of a home purchase to cover services like lending, title transfer, and taxes. Closing costs:
| $68,850 |
Rehab CostsCosts incurred to repair or improve the property, including: roof, flooring, exterior siding, kitchen, exterior paint, bathrooms, etc. Rehab costs:
| $0 |
Initial Cash InvestedThe total initial cash invested in the property. Calculation:Down payment + Buying costs + Rehab costs Initial cash invested:
| $527,850 |
Square Feet (SQFT)The total square footage of the property. Square feet:
| 5,167 |
Cost Per Square FootCost per square foot of the property. Calculation:Purchase Price / Square Feet Cost per square foot:
| $444 |
Monthly Rent Per Square FootMonthly rent divided by the number of square feet. This ratio helps investors compare rental income efficiency across properties, markets, and unit sizes Calculation:Monthly Rent / Square Feet Monthly rent per square foot:
| $1.08 |
Financing Details
Loan AmountThe total sum of money borrowed from a lender to finance a property purchase. Calculation:Purchase Price - Down Payment
Loan amount:
| $1,836,000 |
|---|---|
Loan to Value Ratio (LTV)Loan amount divided by the market value of the property. Calculation:Loan Amount / Market Value
Loan to value ratio:
| 80.0% |
Loan TypeThe type of loan (e.g., fixed, adjustable).
Loan type:
| Amortizing |
TermThe loan repayment period in years.
Term:
| 30 years |
Interest RateThe percentage a lender charges on the borrowed amount of a loan, determining the cost of borrowing money.
Interest rate:
| 6.500% |
Principal & Interest (PI)The principal is the portion of the loan payment that reduces the loan balance. The interest is the lender's charge for borrowing money. Calculation:(P * r * (1 + r) ** n) / ((1 + r) ** n - 1) Where:
P = Loan amount (principal)
Principal & interest:
| $11,605 |
Property TaxesAnnual taxes levied by local governments on real estate properties. These taxes fund public services like schools, roads, and emergency services.
Property tax:
| $1,947 |
InsuranceThe costs for insurance coverage to protect against financial losses due to risks like fire, natural disasters, theft, liability, or tenant-related damages. Calculation:Assumes 7% of gross rental income, unless insurance rates are specified.
Insurance:
| $392 |
Private Mortgage Insurance (PMI)A fee that borrowers pay when they take out a conventional loan with a loan-to-value (LTV) ratio above 80%.
Private mortgage insurance (PMI):
| $0 |
Monthly PaymentThe fixed amount a borrower pays each month to repay a loan. It typically includes principal and interest (P&I) and may also cover property taxes, insurance, HOA fees, and PMI if escrowed. Monthly payment:
| $13,944 |
Operating Income
| % Rent | Monthly | Yearly | |
|---|---|---|---|
Gross RentThe total rental income received from tenants before deducting any expenses. Includes base rent, late fees, pet fees, parking fees, and other recurring charges.
Gross rent:
| $5,600 | $67,200 | |
Vacancy LossExpected loss of rent due to vacancies.
Vacancy loss:
(6%)
| 6% | -$336 | -$4,032 |
Operating IncomeGross rental income minus vacancy loss. Calculation:Gross rent - Vacancy loss
Operating income:
| $5,264 | $63,168 |
Operating Expenses
| % Rent | Monthly | Yearly | |
|---|---|---|---|
Property TaxesAnnual taxes levied by local governments on real estate properties. These taxes fund public services like schools, roads, and emergency services. | 35% | -$1,947 | -$23,369 |
InsuranceThe costs for insurance coverage to protect against financial losses due to risks like fire, natural disasters, theft, liability, or tenant-related damages. Calculation:Assumes 7% of gross rental income, unless insurance rates are specified. | 7% | -$392 | -$4,704 |
Property ManagementThe costs associated with hiring a property manager to handle the day-to-day operations of a rental property. Includes management fees, leasing fes, eviction fees, etc. Calculation:Assumes 8% of gross rental income. | 8% | -$448 | -$5,376 |
Repairs & MaintenanceOngoing costs for routine upkeep and minor fixes needed to keep a property in good working condition. Calculation:Assumes 5% of gross rental income. Varies by property age and condition. | 5% | -$280 | -$3,360 |
Capital ExpensesLarge, infrequent costs for major improvements or replacements, like a new roof, HVAC system, or appliances. Calculation:Assumes 5% of gross rental income. Varies by property age. | 5% | -$280 | -$3,360 |
HOA FeesRegular dues paid to a Homeowners Association for community maintenance, amenities, and management. Similar fees include: Condo Association Fees, Co-op Maintenance Fees, etc. | n/a | n/a | n/a |
Operating ExpensesRecurring costs required to maintain and manage a rental property, including property taxes, insurance, maintenance, repairs, utilities (if paid by the owner), property management fees, and other day-to-day expenses. Calculation:Insurance + Property Taxes + Property Management + Repairs & Maintenance + Capital Expenditures + HOA Fees | 60% | -$3,347 | -$40,169 |
Cash Flow
| Monthly | Yearly | |
|---|---|---|
Net Operating Income (NOI)The income generated from a property after deducting all operating expenses but before deducting mortgage payments, taxes, and capital expenditures. Calculation:Gross Operating Income - Operating Expenses
Net operating income:
| $1,917 | $23,004 |
Mortgage PaymentThe fixed amount a borrower pays each month to repay a loan. It typically includes principal and interest (P&I) and may also cover property taxes, insurance, HOA fees, and PMI if escrowed. | -$11,605 | -$139,260 |
Cash FlowNet Operating Income (NOI) minus mortgage payments. Calculation:NOI - Mortgage Payments | -$9,688 | -$116,256 |