
$1,995,000
Investment Summary
- Monthly Cash Flow
- -$4,094
- Cap Rate
- 3.7%
- Cash-on-Cash Return
- -10.7%
- Debt Coverage Ratio
- 0.60
- Internal Rate of Return (5 years)
- -6.4%
Cash Flow
Net Operating Income (NOI) minus mortgage payments.
Calculation:
NOI - Mortgage Payments
Cap Rate (Market Value)
Capitalization Rate is a rate of return that compares the yearly Net Operating Income (NOI) to the market value.
Calculation:
NOI / Market Value
Cash-on-Cash Return (CoC)
Annual Cash Flow / Cash Invested
Calculation:
Annual cash flow divided by initial cash invested.
Debt Coverage Ratio (DCR)
Net Operating Income (NOI) divided by total debt payments.
Calculation:
NOI / Total Debt Payments
Internal Rate of Return (IRR)
A metric for assessing profitability over time. IRR is the discount rate at which the net present value (NPV) of all future cash flows (positive and negative) from an investment equals zero — including both periodic cash flow (such as rent) and a projected sale at the end of the holding period. It represents the expected annualized return, accounting for income, expenses, and the recovery of capital through a future sale.
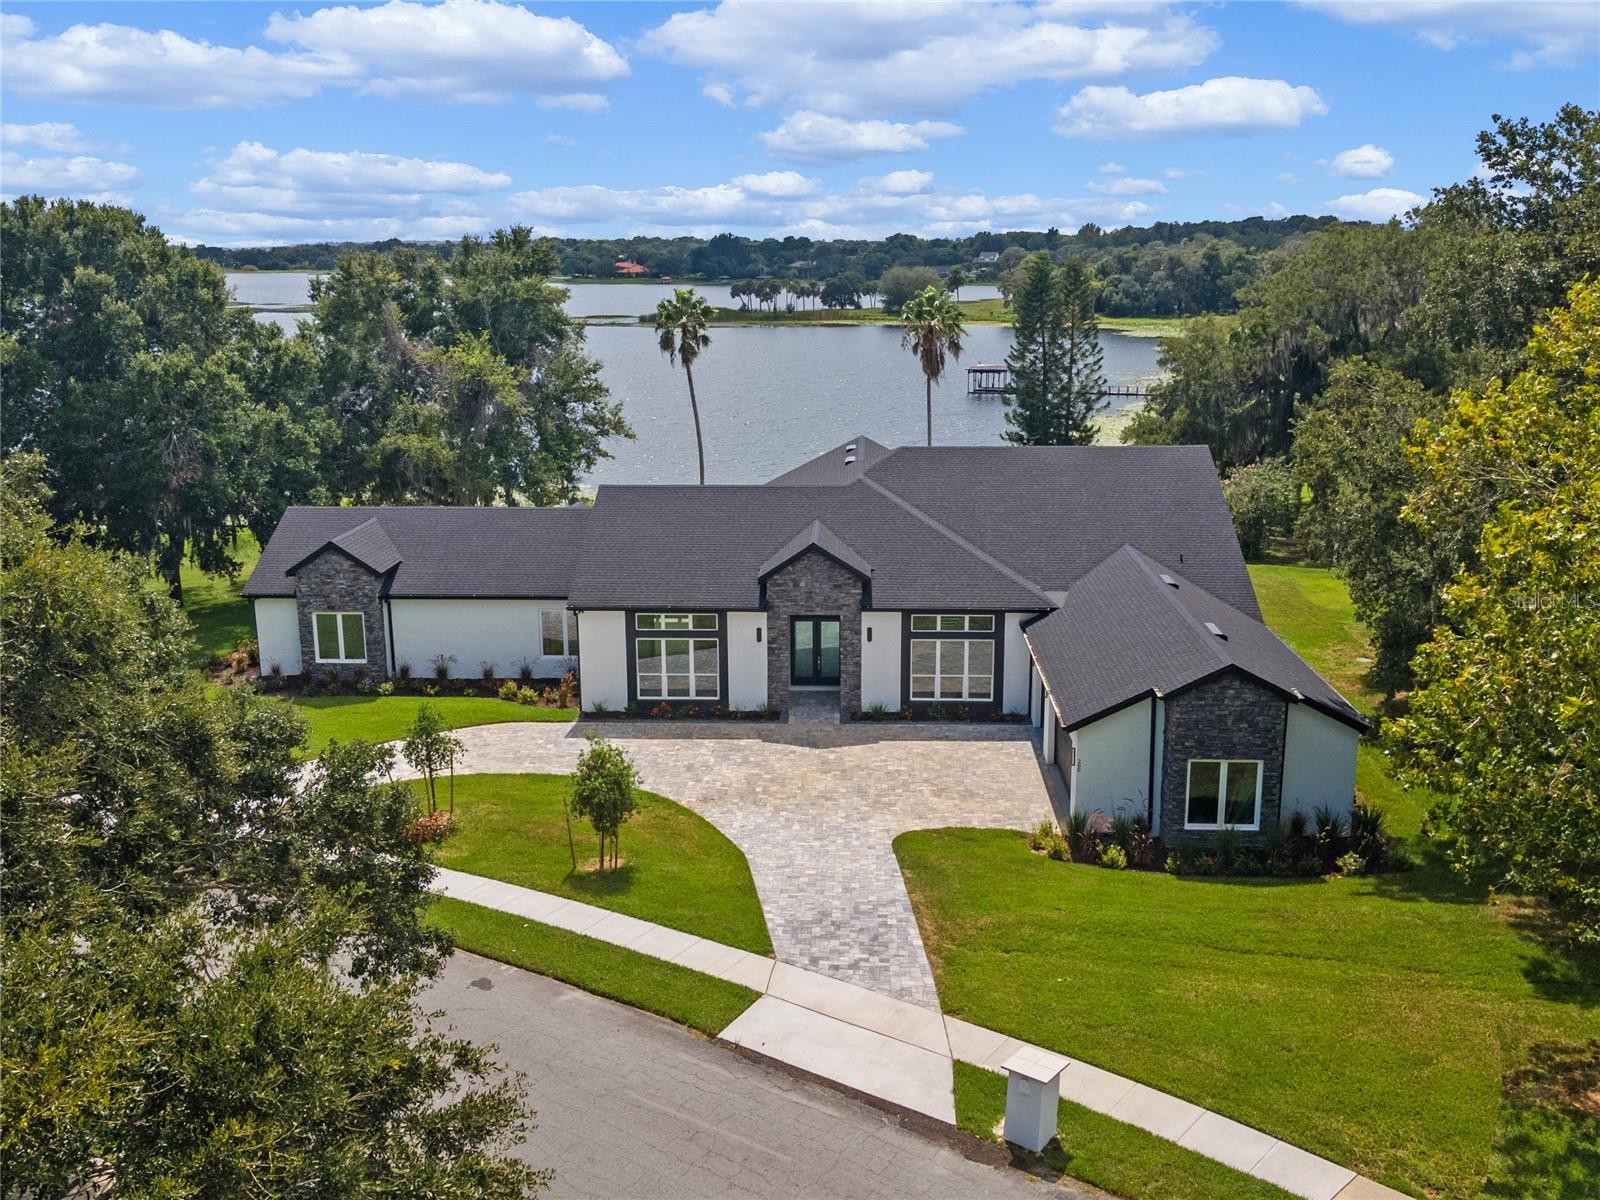
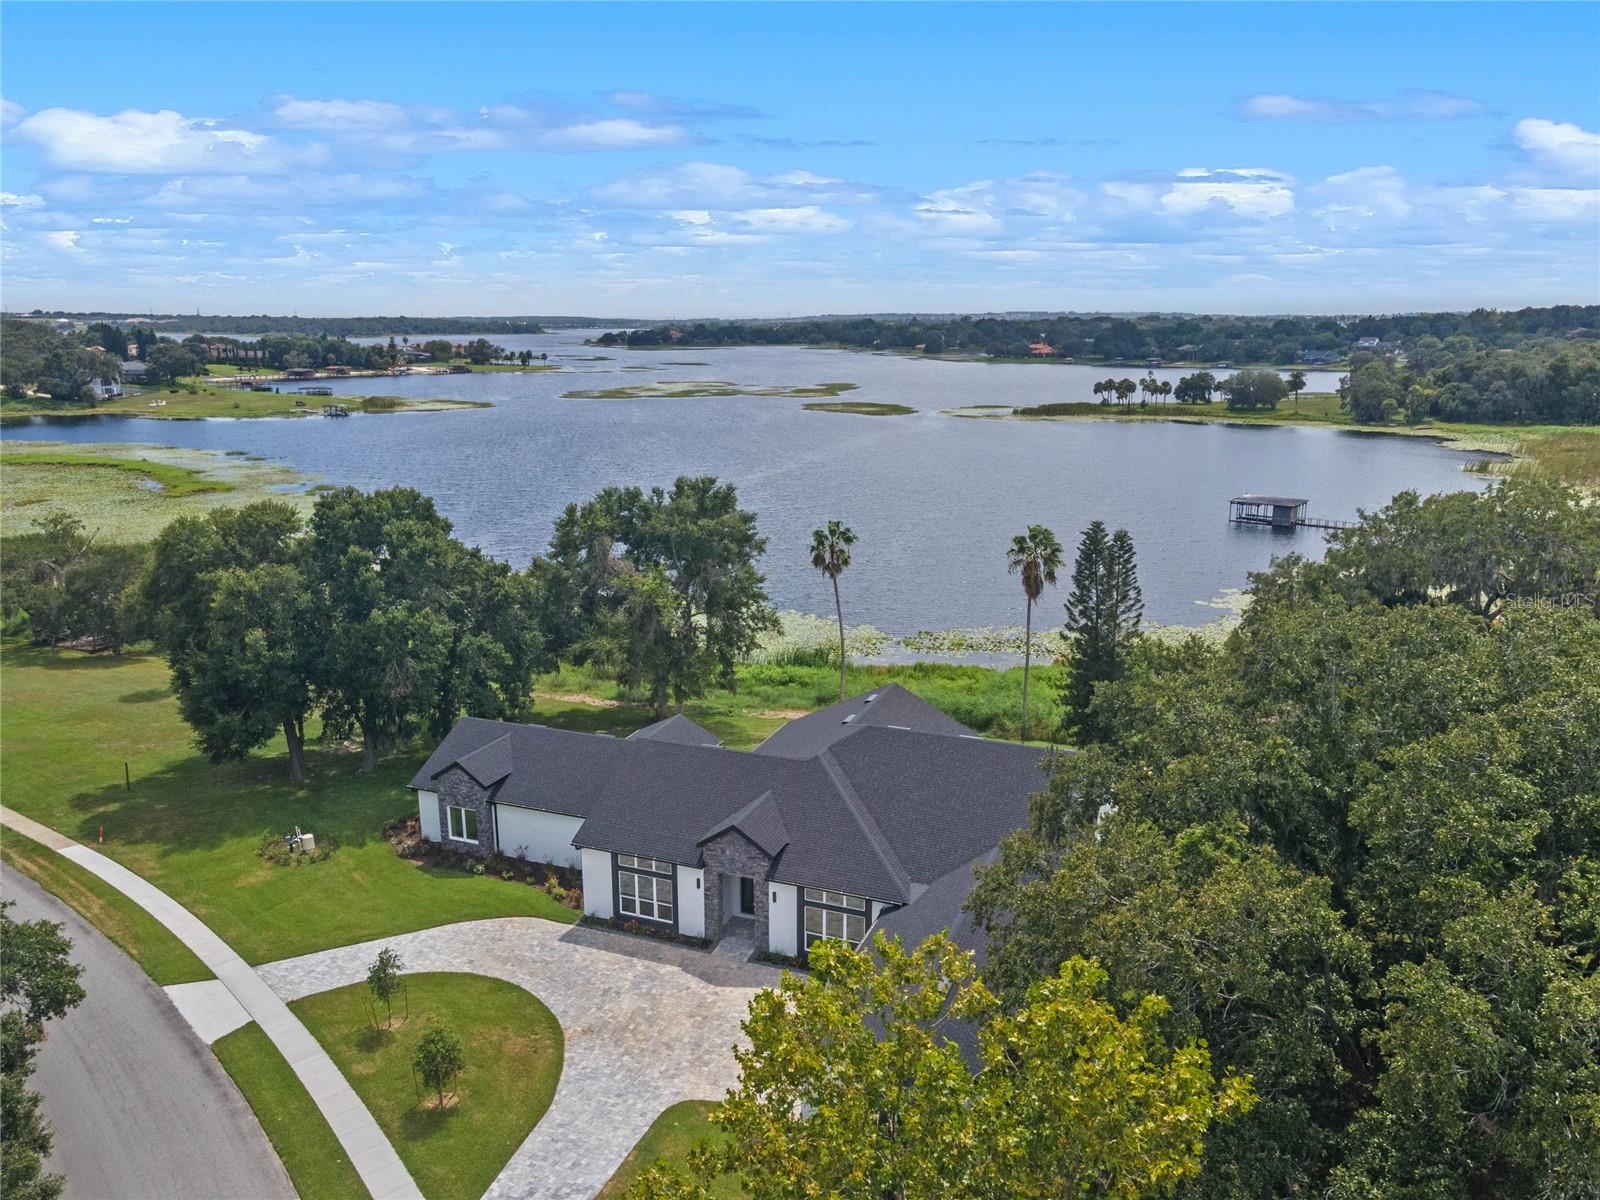
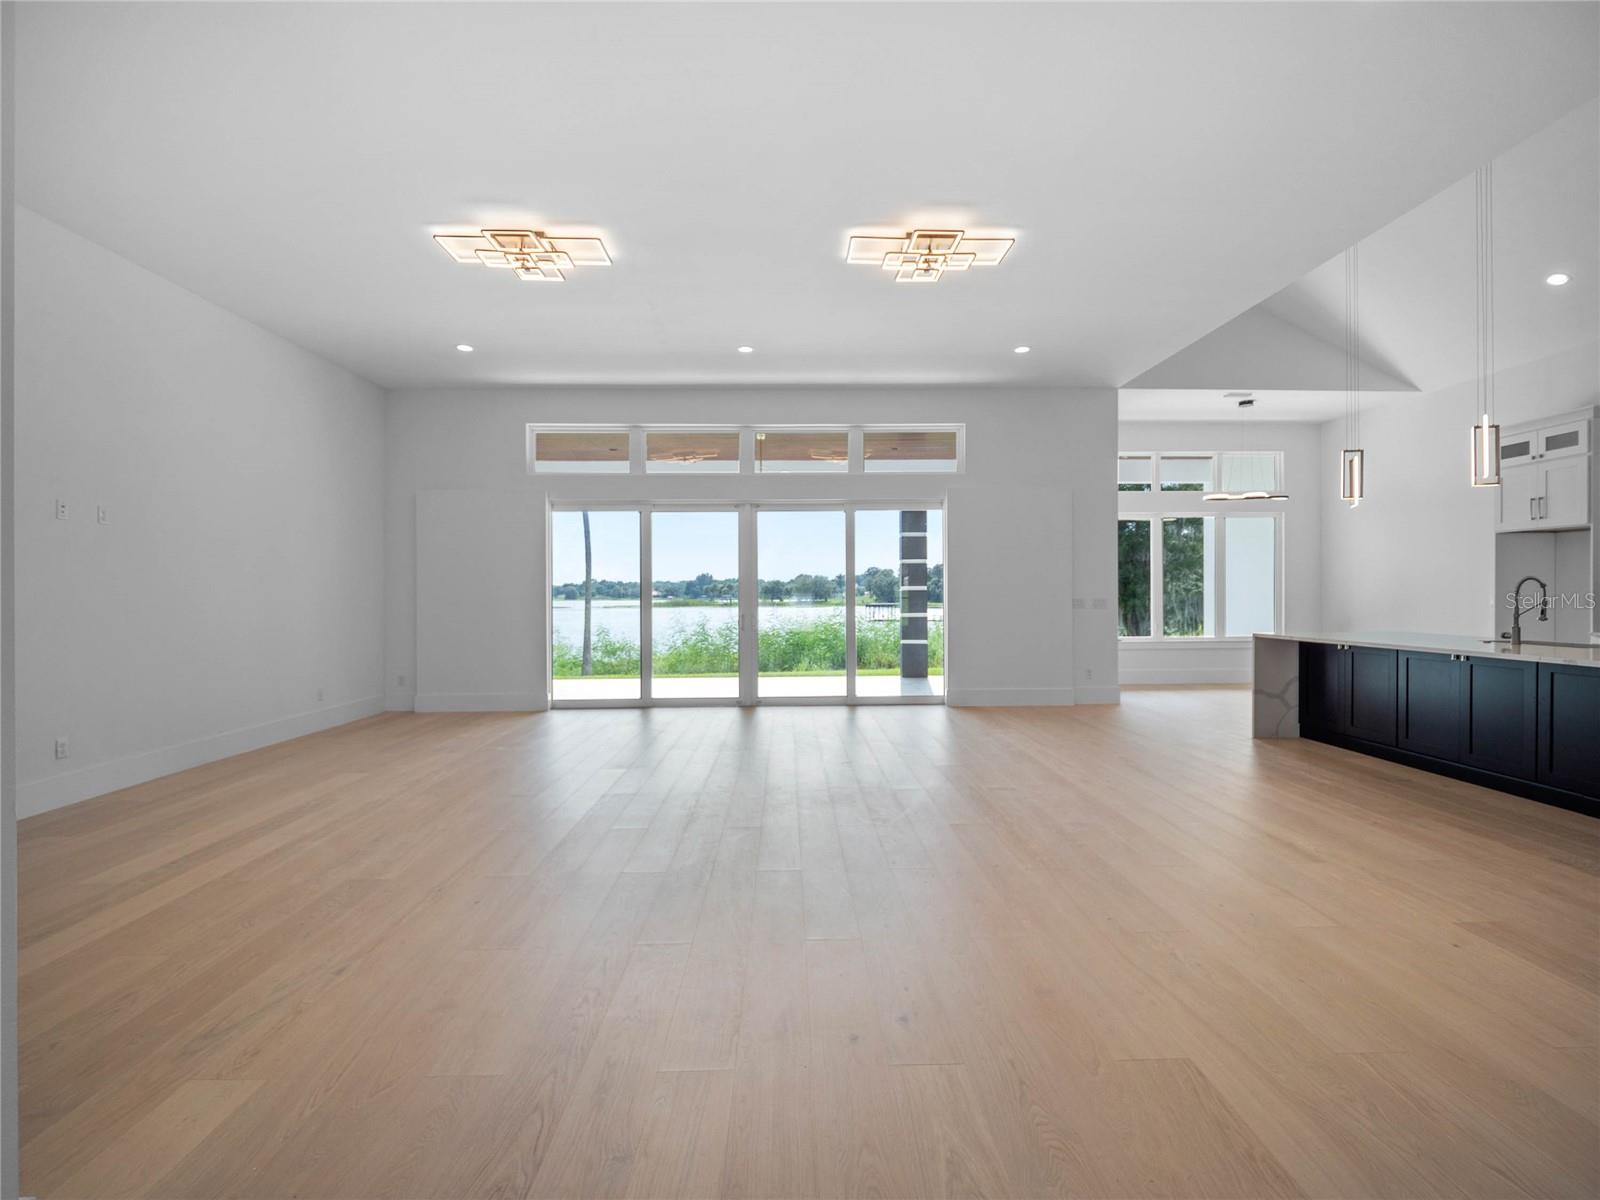
Property Description
This BRAND NEW CONSTRUCTION home directly on John's Lake is one of a kind with over 2 acres behind, high and dry, over 500 feet of direct lake frontage, plus 4700 sqft of living space, 5 spacious bedrooms, 4 full bathrooms, one half bath and a true open concept design. As you walk in the front door, you're greeted by tons of natural light from all the sliding glass doors and oversized windows, along with 12 foot high ceilings, a living room, dining room and kitchen combo, plus luxury hardwood flooring throughout the entire house. The family room is perfect for all gatherings, cozy nights in, and has breathtaking views of the lake. The kitchen has a massive island, luxury countertops with a waterfall feature over the sides, plenty of cabinetry, high end appliances, and perfect for entertaining as it's open to the entire home. If you enjoy having a large formal dining room and living room then this house has designated areas for both! The owner's suite is on the left side of the house and is completely private with tons of amenities. The owner's suite has stunning views from the bedroom, ensuite, closets and even the workout room. The owner's ensuite has his and her vanities, custom lighting, a large walk in shower with high end tile work, a soaking tub that sits in front of a large window overlooking the lake, and is completely private with exterior walls on the side. The owner's retreat also offers two oversized closets, and a third room that could be another closet, a nursery, a second office, or even a home gym. The right side of the home offers 3 spacious bedrooms all with ensuite bathrooms and walk in closets. It also has a half bathroom for guests and a laundry room with built in cabinetry and sink. If you enjoy entertaining then open up your sliding glass doors and step onto your over 500 sqft of covered lanai space with wood ceilings and sunset views. This property has a grandfathered in tree house boat dock that can be one of a kind for this neighborhood. This property has the ability to add an additional mother in law suite, casita, secondary garage or etc. John's lake is approximately 2500 acres that offers sport fishing, skiing, canoeing, kayaking and all other water-sports. This new construction home comes with a builder warranty as well, ask for further details! This home is nestled in the highly sought after Deer Island community, known for its lake frontage on John's lake, community amenities and amazing location right between downtown Winter Garden and Downtown Clermont. It's also located just a short drive from the magic of Disney, the vibrant atmosphere of International Drive, and premier shopping at Millennia Mall, this home offers convenience paired with quality. Montverde Academy, a world-class educational institution known for its commitment to academic excellence, is also less than seven miles away. Discover the perfect blend of sophistication and functionality in this meticulously crafted home, offering both comfort and style. Schedule a private viewing today and make this your retreat in the heart of convenience.
Build Your Team
Quickly find investor-friendly professionals who can help you succeed in real estate investing at any stage of the investing journey.


Agents
Match with investor-friendly agents who can help you find, analyze, and close your next deal


Lenders
Get the best funding…find investor-friendly lenders who specialize in your deal strategy


Property Managers
Transition to passive investing. Find a trusted property management partnership that lasts.


Tax Pros & Accountants
Taxes and financial reporting made easy—find experts to create tax savings strategies, file taxes, and more
Location
Property Details
Parking
- Description: Garage
- Details: Attached
- Garage Spaces: 3
- Spaces Total: 0
Bedroom Information
- # of Bedrooms: 5
Bathroom Information
- # of Baths (Full): 4
- # of Baths (Partial): 1
- # of Baths (Total): 5.0
Interior Features
- # of Rooms: 10
- # of Stories: 1
Exterior Features
- Exterior Walls Materials: Stucco
- Foundation: Slab
- Roof Type: Gable or Hip
- Roof Material: Shingle
HOA
- Has HOA: Yes
- Association: Hara Management/ Carol Rumaly
- HOA Fee: $1,738/semi-annually
Land Information
- Land Use: Residential
- Land Use Subtype: Single Family Residential
Lot Information
- Parcel ID: 302227198500890
- Lot Size: 87652 sqft
Property Information
- Property Type: Single Family Residence
- Year Built: 2023
Tax Information
- Annual Tax: $5,819
Utilities
- Water & Sewer: Private, Well
- Heating: Central
- Cooling: Central Air
Location
- County: Orange
Listing Details
Investment Summary
- Monthly Cash Flow
- -$4,094
- Cap Rate
- 3.7%
- Cash-on-Cash Return
- -10.7%
- Debt Coverage Ratio
- 0.60
- Internal Rate of Return (5 years)
- -6.4%
Cash Flow
Net Operating Income (NOI) minus mortgage payments.
Calculation:
NOI - Mortgage Payments
Cap Rate (Market Value)
Capitalization Rate is a rate of return that compares the yearly Net Operating Income (NOI) to the market value.
Calculation:
NOI / Market Value
Cash-on-Cash Return (CoC)
Annual Cash Flow / Cash Invested
Calculation:
Annual cash flow divided by initial cash invested.
Debt Coverage Ratio (DCR)
Net Operating Income (NOI) divided by total debt payments.
Calculation:
NOI / Total Debt Payments
Internal Rate of Return (IRR)
A metric for assessing profitability over time. IRR is the discount rate at which the net present value (NPV) of all future cash flows (positive and negative) from an investment equals zero — including both periodic cash flow (such as rent) and a projected sale at the end of the holding period. It represents the expected annualized return, accounting for income, expenses, and the recovery of capital through a future sale.
Purchase Details
Purchase PriceThe price paid for the property. Purchase price:
| $1,995,000 |
|---|---|
Amount FinancedThe amount of the purchase financed through a loan. Amount financed:
| -$1,596,000 |
Down paymentThe initial payment made towards the purchase. Down payment:
| $399,000 |
Closing CostsFees and expenses associated with purchasing a property, typically ranging from 2% to 5% of the home’s purchase price, paid at the end of a home purchase to cover services like lending, title transfer, and taxes. Closing costs:
| $59,850 |
Rehab CostsCosts incurred to repair or improve the property, including: roof, flooring, exterior siding, kitchen, exterior paint, bathrooms, etc. Rehab costs:
| $0 |
Initial Cash InvestedThe total initial cash invested in the property. Calculation:Down payment + Buying costs + Rehab costs Initial cash invested:
| $458,850 |
Square Feet (SQFT)The total square footage of the property. Square feet:
| 4,714 |
Cost Per Square FootCost per square foot of the property. Calculation:Purchase Price / Square Feet Cost per square foot:
| $423 |
Monthly Rent Per Square FootMonthly rent divided by the number of square feet. This ratio helps investors compare rental income efficiency across properties, markets, and unit sizes Calculation:Monthly Rent / Square Feet Monthly rent per square foot:
| $2.12 |
Financing Details
Loan AmountThe total sum of money borrowed from a lender to finance a property purchase. Calculation:Purchase Price - Down Payment
Loan amount:
| $1,596,000 |
|---|---|
Loan to Value Ratio (LTV)Loan amount divided by the market value of the property. Calculation:Loan Amount / Market Value
Loan to value ratio:
| 80.0% |
Loan TypeThe type of loan (e.g., fixed, adjustable).
Loan type:
| Amortizing |
TermThe loan repayment period in years.
Term:
| 30 years |
Interest RateThe percentage a lender charges on the borrowed amount of a loan, determining the cost of borrowing money.
Interest rate:
| 6.625% |
Principal & Interest (PI)The principal is the portion of the loan payment that reduces the loan balance. The interest is the lender's charge for borrowing money. Calculation:(P * r * (1 + r) ** n) / ((1 + r) ** n - 1) Where:
P = Loan amount (principal)
Principal & interest:
| $10,219 |
Property TaxesAnnual taxes levied by local governments on real estate properties. These taxes fund public services like schools, roads, and emergency services.
Property tax:
| $485 |
InsuranceThe costs for insurance coverage to protect against financial losses due to risks like fire, natural disasters, theft, liability, or tenant-related damages. Calculation:Assumes 7% of gross rental income, unless insurance rates are specified.
Insurance:
| $700 |
Private Mortgage Insurance (PMI)A fee that borrowers pay when they take out a conventional loan with a loan-to-value (LTV) ratio above 80%.
Private mortgage insurance (PMI):
| $0 |
Monthly PaymentThe fixed amount a borrower pays each month to repay a loan. It typically includes principal and interest (P&I) and may also cover property taxes, insurance, HOA fees, and PMI if escrowed. Monthly payment:
| $11,404 |
Operating Income
| % Rent | Monthly | Yearly | |
|---|---|---|---|
Gross RentThe total rental income received from tenants before deducting any expenses. Includes base rent, late fees, pet fees, parking fees, and other recurring charges.
Gross rent:
| $10,000 | $120,000 | |
Vacancy LossExpected loss of rent due to vacancies.
Vacancy loss:
(6%)
| 6% | -$600 | -$7,200 |
Operating IncomeGross rental income minus vacancy loss. Calculation:Gross rent - Vacancy loss
Operating income:
| $9,400 | $112,800 |
Operating Expenses
| % Rent | Monthly | Yearly | |
|---|---|---|---|
Property TaxesAnnual taxes levied by local governments on real estate properties. These taxes fund public services like schools, roads, and emergency services. | 5% | -$485 | -$5,819 |
InsuranceThe costs for insurance coverage to protect against financial losses due to risks like fire, natural disasters, theft, liability, or tenant-related damages. Calculation:Assumes 7% of gross rental income, unless insurance rates are specified. | 7% | -$700 | -$8,400 |
Property ManagementThe costs associated with hiring a property manager to handle the day-to-day operations of a rental property. Includes management fees, leasing fes, eviction fees, etc. Calculation:Assumes 8% of gross rental income. | 8% | -$800 | -$9,600 |
Repairs & MaintenanceOngoing costs for routine upkeep and minor fixes needed to keep a property in good working condition. Calculation:Assumes 5% of gross rental income. Varies by property age and condition. | 5% | -$500 | -$6,000 |
Capital ExpensesLarge, infrequent costs for major improvements or replacements, like a new roof, HVAC system, or appliances. Calculation:Assumes 5% of gross rental income. Varies by property age. | 5% | -$500 | -$6,000 |
HOA FeesRegular dues paid to a Homeowners Association for community maintenance, amenities, and management. Similar fees include: Condo Association Fees, Co-op Maintenance Fees, etc. | 3% | -$290 | -$3,480 |
Operating ExpensesRecurring costs required to maintain and manage a rental property, including property taxes, insurance, maintenance, repairs, utilities (if paid by the owner), property management fees, and other day-to-day expenses. Calculation:Insurance + Property Taxes + Property Management + Repairs & Maintenance + Capital Expenditures + HOA Fees | 33% | -$3,275 | -$39,299 |
Cash Flow
| Monthly | Yearly | |
|---|---|---|
Net Operating Income (NOI)The income generated from a property after deducting all operating expenses but before deducting mortgage payments, taxes, and capital expenditures. Calculation:Gross Operating Income - Operating Expenses
Net operating income:
| $6,125 | $73,500 |
Mortgage PaymentThe fixed amount a borrower pays each month to repay a loan. It typically includes principal and interest (P&I) and may also cover property taxes, insurance, HOA fees, and PMI if escrowed. | -$10,219 | -$122,628 |
Cash FlowNet Operating Income (NOI) minus mortgage payments. Calculation:NOI - Mortgage Payments | $4,094 | $49,128 |