
$1,299,999
Investment Summary
- Monthly Cash Flow
- -$3,141
- Cap Rate
- 3.4%
- Cash-on-Cash Return
- -12.6%
- Debt Coverage Ratio
- 0.54
- Internal Rate of Return (5 years)
- -8.2%
Cash Flow
Net Operating Income (NOI) minus mortgage payments.
Calculation:
NOI - Mortgage Payments
Cap Rate (Market Value)
Capitalization Rate is a rate of return that compares the yearly Net Operating Income (NOI) to the market value.
Calculation:
NOI / Market Value
Cash-on-Cash Return (CoC)
Annual Cash Flow / Cash Invested
Calculation:
Annual cash flow divided by initial cash invested.
Debt Coverage Ratio (DCR)
Net Operating Income (NOI) divided by total debt payments.
Calculation:
NOI / Total Debt Payments
Internal Rate of Return (IRR)
A metric for assessing profitability over time. IRR is the discount rate at which the net present value (NPV) of all future cash flows (positive and negative) from an investment equals zero — including both periodic cash flow (such as rent) and a projected sale at the end of the holding period. It represents the expected annualized return, accounting for income, expenses, and the recovery of capital through a future sale.
Property Description
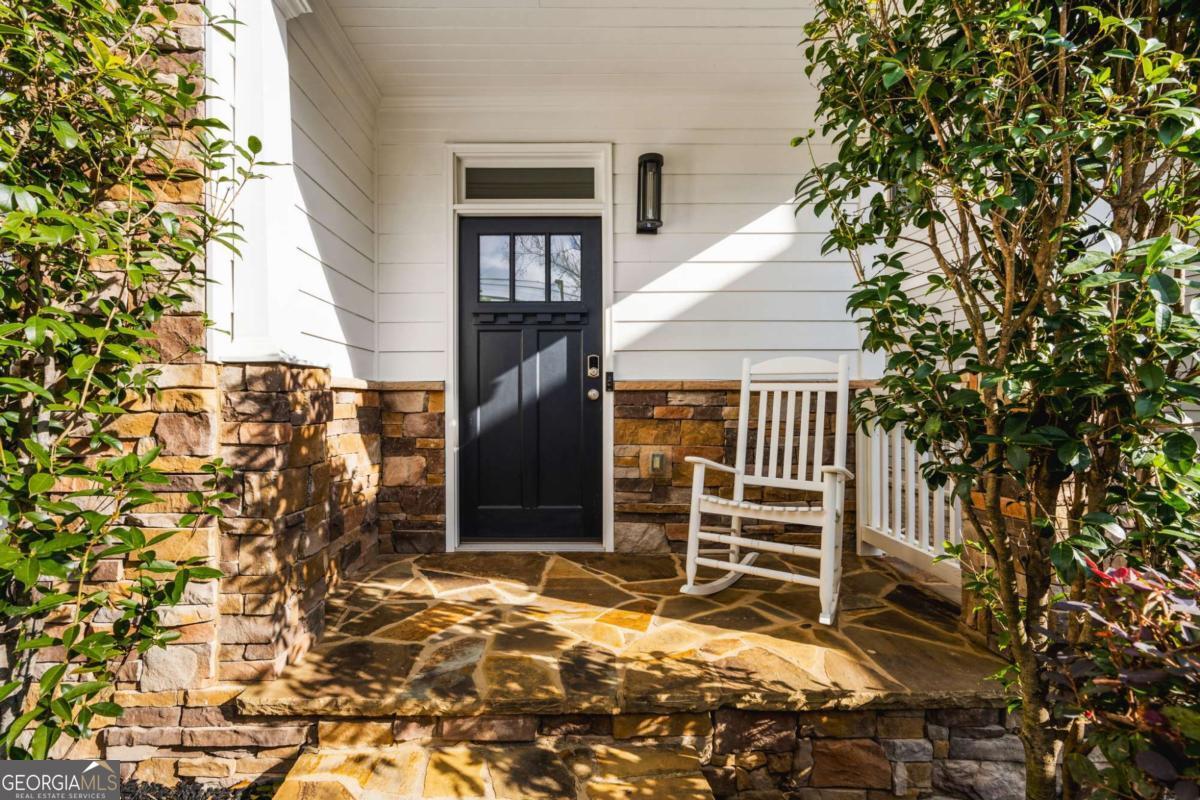
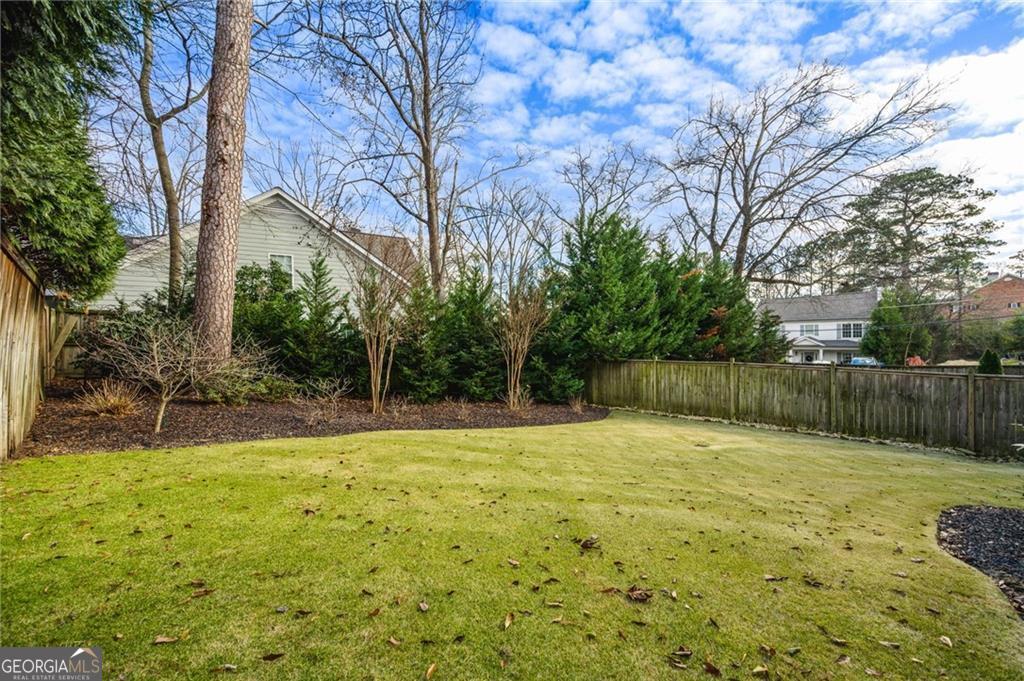
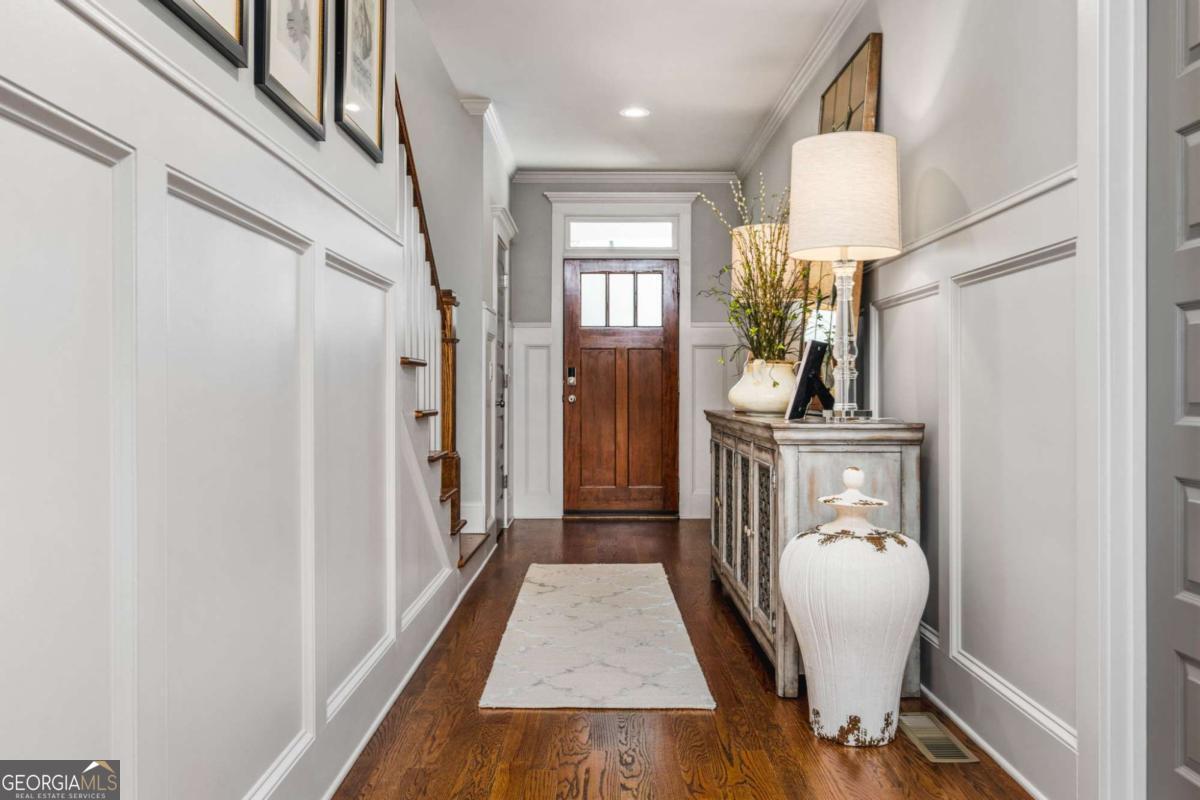
REDUCED $150K FOR A QUICK SALE! THIS IS A STEAL OF A DEAL! Nestled in the heart of Brookhaven, GA, this custom-built home offers a rare blend of luxury, comfort, and an unbeatable location! This property is just steps away from the vibrant Dresden shops, Brookhaven Farmers Market, the new Parkside on Dresden, multiple parks, and the local library and coffee shop! The open floor plan epitomizes sophistication and functionality. The main level features rich hardwood floors, hand-milled moldings, plantation shutters, and architectural details that complement every space. At the heart of the home is the chef-inspired kitchen equipped with a large island and granite countertops. All stainless appliances include a six-burner commercial oven, custom vent hood, soft-close stained custom cabinets, and a designer glass backsplash. Have your morning coffee in the beautiful built-in breakfast nook in a quiet kitchen corner. The custom wall treatment highlights the elegant formal dining room and offers tons of natural light from the wall of windows! The living room invites both entertaining and relaxation and boasts a cozy gas fireplace with slate surround and painted mantle. Enhance your entertaining experience in the cozy 4-season room just a few steps from the kitchen and living room, complete with a built-in stacked stone fireplace, tile floors, shiplap walls, and removable windows that transform the area into a screen porch! The large deck with stairs to the garden-like backyard is not to be missed. The second floor hosts the oversized primary suite, a spa-like escape with a beautiful tray ceiling, plantation shutters, a space for a sitting area, and fabulous lighting. The gracious primary bath boasts tile floors, a freestanding soaking tub, and a huge tiled glass walk-in shower. Completing the bath space is a wall of stained cabinets with double sinks and granite countertops. A separate walk-in dressing room with a built-in shelving system provides excellent space for expansive wardrobes and will not disappoint! Three additional guest suites and a fabulous laundry room with custom cabinets and a laundry sink complete the second floor. Not to be missed is the large unfinished daylight basement, which is stubbed for a bath and could be built out as an in-law suite for a multi-generational family! This area offers easy access to the gorgeous fenced backyard. This home showcases not just luxury but also practicality, with a two-car garage located on the kitchen level and featuring custom cabinets and storage. These features ensure maximum convenience and utilization of every space. The grounds are adorned with professional landscaping, and an updated irrigation system ensures lush greenery and easy maintenance throughout the year. This property is in a prime location, has extraordinary features, and will not disappoint even the most discerning purchaser!
Build Your Team
Quickly find investor-friendly professionals who can help you succeed in real estate investing at any stage of the investing journey.


Agents
Match with investor-friendly agents who can help you find, analyze, and close your next deal


Lenders
Get the best funding…find investor-friendly lenders who specialize in your deal strategy


Property Managers
Transition to passive investing. Find a trusted property management partnership that lasts.


Tax Pros & Accountants
Taxes and financial reporting made easy—find experts to create tax savings strategies, file taxes, and more
Location
Property Details
Parking
- Description: Attached, Garage, Kitchen Level, Level Driveway
- Details: Attached, Garage, Kitchen Level
- Garage Spaces: 0
- Spaces Total: 0
Bedroom Information
- # of Bedrooms: 4
Bathroom Information
- # of Baths (Full): 3
- # of Baths (Partial): 1
- # of Baths (Total): 0.0
Interior Features
- # of Stories: 2
- Basement: Yes
- Basement Description: Bath/Stubbed, Daylight, Exterior Entry, Full, Interior Entry, Unfinished
- Fireplace: Yes
Exterior Features
- Exterior Walls Materials: Brick
- Roof Material: Composition
Land Information
- Land Use: Residential
- Land Use Subtype: Single Family Residential
Lot Information
- Parcel ID: 1824108034
- Lot Size: 0 sqft
Property Information
- Property Type: Single Family Residence
- Style: Craftsman, Traditional
- Year Built: 2015
Tax Information
- Annual Tax: $8,989
Utilities
- Water & Sewer: Public
- Heating: Wood Stove, Forced Air, Natural Gas, Zoned
- Cooling: Attic Fan, Ceiling Fan(s), Central Air, Zoned
Location
- County: De Kalb
Investment Summary
- Monthly Cash Flow
- -$3,141
- Cap Rate
- 3.4%
- Cash-on-Cash Return
- -12.6%
- Debt Coverage Ratio
- 0.54
- Internal Rate of Return (5 years)
- -8.2%
Cash Flow
Net Operating Income (NOI) minus mortgage payments.
Calculation:
NOI - Mortgage Payments
Cap Rate (Market Value)
Capitalization Rate is a rate of return that compares the yearly Net Operating Income (NOI) to the market value.
Calculation:
NOI / Market Value
Cash-on-Cash Return (CoC)
Annual Cash Flow / Cash Invested
Calculation:
Annual cash flow divided by initial cash invested.
Debt Coverage Ratio (DCR)
Net Operating Income (NOI) divided by total debt payments.
Calculation:
NOI / Total Debt Payments
Internal Rate of Return (IRR)
A metric for assessing profitability over time. IRR is the discount rate at which the net present value (NPV) of all future cash flows (positive and negative) from an investment equals zero — including both periodic cash flow (such as rent) and a projected sale at the end of the holding period. It represents the expected annualized return, accounting for income, expenses, and the recovery of capital through a future sale.
Purchase Details
Purchase PriceThe price paid for the property. Purchase price:
| $1,299,999 |
|---|---|
Amount FinancedThe amount of the purchase financed through a loan. Amount financed:
| -$1,039,999 |
Down paymentThe initial payment made towards the purchase. Down payment:
| $260,000 |
Closing CostsFees and expenses associated with purchasing a property, typically ranging from 2% to 5% of the home’s purchase price, paid at the end of a home purchase to cover services like lending, title transfer, and taxes. Closing costs:
| $39,000 |
Rehab CostsCosts incurred to repair or improve the property, including: roof, flooring, exterior siding, kitchen, exterior paint, bathrooms, etc. Rehab costs:
| $0 |
Initial Cash InvestedThe total initial cash invested in the property. Calculation:Down payment + Buying costs + Rehab costs Initial cash invested:
| $299,000 |
Square Feet (SQFT)The total square footage of the property. Square feet:
| 0 |
Cost Per Square FootCost per square foot of the property. Calculation:Purchase Price / Square Feet Cost per square foot:
| n/a |
Monthly Rent Per Square FootMonthly rent divided by the number of square feet. This ratio helps investors compare rental income efficiency across properties, markets, and unit sizes Calculation:Monthly Rent / Square Feet Monthly rent per square foot:
| n/a |
Financing Details
Loan AmountThe total sum of money borrowed from a lender to finance a property purchase. Calculation:Purchase Price - Down Payment
Loan amount:
| $1,039,999 |
|---|---|
Loan to Value Ratio (LTV)Loan amount divided by the market value of the property. Calculation:Loan Amount / Market Value
Loan to value ratio:
| 80.0% |
Loan TypeThe type of loan (e.g., fixed, adjustable).
Loan type:
| Amortizing |
TermThe loan repayment period in years.
Term:
| 30 years |
Interest RateThe percentage a lender charges on the borrowed amount of a loan, determining the cost of borrowing money.
Interest rate:
| 6.840% |
Principal & Interest (PI)The principal is the portion of the loan payment that reduces the loan balance. The interest is the lender's charge for borrowing money. Calculation:(P * r * (1 + r) ** n) / ((1 + r) ** n - 1) Where:
P = Loan amount (principal)
Principal & interest:
| $6,808 |
Property TaxesAnnual taxes levied by local governments on real estate properties. These taxes fund public services like schools, roads, and emergency services.
Property tax:
| $749 |
InsuranceThe costs for insurance coverage to protect against financial losses due to risks like fire, natural disasters, theft, liability, or tenant-related damages. Calculation:Assumes 7% of gross rental income, unless insurance rates are specified.
Insurance:
| $448 |
Private Mortgage Insurance (PMI)A fee that borrowers pay when they take out a conventional loan with a loan-to-value (LTV) ratio above 80%.
Private mortgage insurance (PMI):
| $0 |
Monthly PaymentThe fixed amount a borrower pays each month to repay a loan. It typically includes principal and interest (P&I) and may also cover property taxes, insurance, HOA fees, and PMI if escrowed. Monthly payment:
| $8,005 |
Operating Income
| % Rent | Monthly | Yearly | |
|---|---|---|---|
Gross RentThe total rental income received from tenants before deducting any expenses. Includes base rent, late fees, pet fees, parking fees, and other recurring charges.
Gross rent:
| $6,400 | $76,800 | |
Vacancy LossExpected loss of rent due to vacancies.
Vacancy loss:
(6%)
| 6% | -$384 | -$4,608 |
Operating IncomeGross rental income minus vacancy loss. Calculation:Gross rent - Vacancy loss
Operating income:
| $6,016 | $72,192 |
Operating Expenses
| % Rent | Monthly | Yearly | |
|---|---|---|---|
Property TaxesAnnual taxes levied by local governments on real estate properties. These taxes fund public services like schools, roads, and emergency services. | 12% | -$749 | -$8,989 |
InsuranceThe costs for insurance coverage to protect against financial losses due to risks like fire, natural disasters, theft, liability, or tenant-related damages. Calculation:Assumes 7% of gross rental income, unless insurance rates are specified. | 7% | -$448 | -$5,376 |
Property ManagementThe costs associated with hiring a property manager to handle the day-to-day operations of a rental property. Includes management fees, leasing fes, eviction fees, etc. Calculation:Assumes 8% of gross rental income. | 8% | -$512 | -$6,144 |
Repairs & MaintenanceOngoing costs for routine upkeep and minor fixes needed to keep a property in good working condition. Calculation:Assumes 5% of gross rental income. Varies by property age and condition. | 5% | -$320 | -$3,840 |
Capital ExpensesLarge, infrequent costs for major improvements or replacements, like a new roof, HVAC system, or appliances. Calculation:Assumes 5% of gross rental income. Varies by property age. | 5% | -$320 | -$3,840 |
HOA FeesRegular dues paid to a Homeowners Association for community maintenance, amenities, and management. Similar fees include: Condo Association Fees, Co-op Maintenance Fees, etc. | n/a | n/a | n/a |
Operating ExpensesRecurring costs required to maintain and manage a rental property, including property taxes, insurance, maintenance, repairs, utilities (if paid by the owner), property management fees, and other day-to-day expenses. Calculation:Insurance + Property Taxes + Property Management + Repairs & Maintenance + Capital Expenditures + HOA Fees | 37% | -$2,349 | -$28,189 |
Cash Flow
| Monthly | Yearly | |
|---|---|---|
Net Operating Income (NOI)The income generated from a property after deducting all operating expenses but before deducting mortgage payments, taxes, and capital expenditures. Calculation:Gross Operating Income - Operating Expenses
Net operating income:
| $3,667 | $44,004 |
Mortgage PaymentThe fixed amount a borrower pays each month to repay a loan. It typically includes principal and interest (P&I) and may also cover property taxes, insurance, HOA fees, and PMI if escrowed. | -$6,808 | -$81,696 |
Cash FlowNet Operating Income (NOI) minus mortgage payments. Calculation:NOI - Mortgage Payments | $3,141 | $37,692 |